1
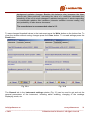
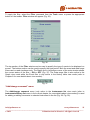
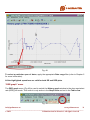
Fig. 47
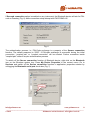
To return the axes to their original scale, left click then drag any plot window location and move
the cursor from bottom right to the top left corner. After releasing the mouse button axes will be
returned to their original scale.
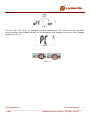
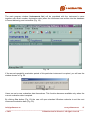
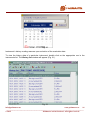
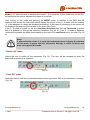
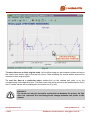
To read the data at a particular point, double-click on the desired plot point or on the
corresponding X-axis date and time. The Red cursor line will be moved to the selected point; the X
and Y marker values will be displayed in the status line (Fig. 48).
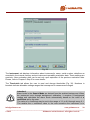
Attention!
The cursor can only be moved to a point but not between the points; the line
does not represent the real background change between two points in the
dataset.
[email protected]
www.polimaster.us
30
_____________________________________________________________________________________
© 2012
Polimaster and its licensors. All rights reserved