1
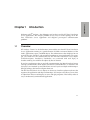
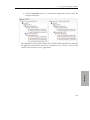
RTI Analyzer
RTI Data Distribution Service
Debugging and Analysis Tool
Getting Started Guide
Version 1.4
© 2006-2010 Real-Time Innovations, Inc.
All rights reserved.
Printed in U.S.A. First printing.
June 2010.
Trademarks
Real-Time Innovations and RTI are registered trademarks of Real-Time Innovations, Inc.
All other trademarks used in this document are the property of their respective owners.
Copy and Use Restrictions
No part of this publication may be reproduced, stored in a retrieval system, or transmitted in any
form (including electronic, mechanical, photocopy, and facsimile) without the prior written permission of Real-Time Innovations, Inc. The software described in this document is furnished
under and subject to the RTI software license agreement. The software may be used or copied only
under the terms of the license agreement.
Technical Support
Real-Time Innovations, Inc.
385 Moffett Park Drive
Sunnyvale, CA 94089
Phone:
(408) 990-7444
Email:
[email protected]
Website: http://www.rti.com/support
Contents
1
Introduction
1.1 Overview .................................................................................................................................1-1
2
Installation
2.1 Installing RTI Analyzer .........................................................................................................2-1
2.2 Installing the License File......................................................................................................2-2
2.3 Uninstalling RTI Analyzer ....................................................................................................2-2
3
Starting RTI Analyzer
3.1 Windows Systems ..................................................................................................................3-1
3.2 Solaris and Linux Systems ....................................................................................................3-2
3.3 Running without an Active Network Interface .................................................................3-2
4
Configuring RTI Analyzer
4.1 Specifying a QoS Profile ........................................................................................................4-2
4.2 Configuring RTI Analyzer from the GUI............................................................................4-3
5
Tutorial
5.1 Setting Up RTI Shapes Demo ...............................................................................................5-2
5.2 Connecting RTI Analyzer to RTI Shapes Demo.................................................................5-5
5.3 Working with the Entity Tree ...............................................................................................5-8
5.3.1 Changing the Tree Layout ........................................................................................5-8
5.3.2 Filtering Out Specific Entities.................................................................................5-10
5.4 Viewing Entity Details.........................................................................................................5-13
5.5 Debugging Object Communication Problems with “Match Analysis”........................5-14
iii
5.6 Filtering the Match Results Tree........................................................................................ 5-17
5.6.1 Filtering the Contents of the Match Analysis Tree ............................................. 5-17
5.6.2 Analyzing Selected Objects Only.......................................................................... 5-19
5.7 Correcting the Circle’s Liveliness QoS ............................................................................. 5-22
5.8 Saving and Comparing Snapshots.................................................................................... 5-23
iv
Introduction
Welcome to RTI® Analyzer—the debugging and analysis tool for RTI Data Distribution
Service applications. RTI Analyzer provides an easy way to see the topology of an RTI
Data Distribution Service application and diagnose peer-to-peer communication
problems.
1.1
Overview
RTI Analyzer “listens” to the declarations (meta-traffic) sent from RTI Data Distribution
Service applications running in a specific domain. It builds an internal database of the
nodes, applications, topics, and DDS objects. This information is then displayed in one
or more tree view windows, each organized according to your specifications. For example, you could have one window that lists the RTI Data Distribution Service objects
(DomainParticipants, DataWriters, DataReaders, etc.) associated with each Topic; in
another window, you could list the objects by host or domain.
If you have applications that are not fully communicating, the Match Analysis feature
can help you determine which objects (DataWriters and DataReaders, or Publishers and
Subscribers) are ‘matched’ up and which ones are not. If you have objects with incompatible QoS settings, this feature will point them out.
The RTI Data Distribution Service objects are shown in a familiar explorer-style tree that
organizes the application and object relationships. RTI Analyzer also allows you to select
an object from the tree and display its status and QoS properties. This facility makes it
easy to understand your distributed application.
1-1
1. Introduction
Chapter 1
Chapter 1
DDS Entities are listed in a
tree. You can control how
the tree is organized.
Details on Entity
selected from
the tree
Summary
of Entities
Start Here
Begin by configuring the agent that
captures data from RTI Data Distribution
Service applications.
Match
Analysis
Snapshot
Comparison
Messages from RTI Analyzer
In this example, the RTI Shapes Demo has created Writers for 2 squares, 1 triangle, and 1 circle. The
squares use the same Topic name, with color as the ‘key.’ You can modify how the tree is organized and
filter out Entities that are not of interest.
1-2
1.1 Overview
RTI Analyzer’s main window is composed of the following sections.
❏ Agent Control Allows you to start, stop, and configure RTI Analyzer’s Spy agent,
which collects discovery data from RTI Data Distribution Service applications.
❏ Display Control Allows you to pause the automatic redisplay of data, and to control how often data on the display is refreshed.
lyzer “listens” to the declarations and lists the discovered objects. The Entity Tree
uses Windows Explorer-style displays and techniques for expanding and collapsing the tree. You can double-click the folders to expand the lists of hosts, Participants, Writers, Topics, etc..
❏ Types Displays the data types for each discovered Topic. This view highlights
type-related conflicts such as two Topics with the same name that use different
data types, or two data types with the same name that have different structures.
❏ Entity Info Contains subordinate tabs for QoS, Status, and Data Type. The contents
of these tabs are determined by the object selected in the tree. The QoS tab can also
be used to temporarily change mutable QoS policies.
❏ Summary Shows you how many DDS objects of each type have been discovered.
❏ Match Analysis Shows you which Writers/Readers or Publishers/Subscribers are
‘matched’ to each other. This information can help you diagnose communications
problems between applications, such as incompatible QoS settings.
❏ Snapshots Comparison Provides a way to quickly compare the hierarchy of DDS
entities in two different systems. You can take snapshots of various systems, then
compare them in a graphical manner to see how they differ.
❏ Message Log Displays messages from RTI Analyzer. You can control which type
of messages are displayed (severe, warning, info, etc.).
Context-sensitive help is available when you press F1 on Windows systems or Ctrl-F1
on Solaris and Linux systems, or select the help button
found in the lower left corner of some dialogs.
Chapter 2 describes the installation process and important information about the
required license file.
Chapter 3 explains how to start RTI Analyzer.
Chapter 5 presents a short tutorial to introduce the major RTI Analyzer features. To follow along with the tutorial, you will start the RTI Shapes Demo application and then
walk through the various RTI Analyzer windows and options. Once you have completed
the tutorial, RTI Analyzer operation is intuitive.
1-3
1. Introduction
❏ Entity Tree The tree is a sorted list of RTI Data Distribution Service objects. RTI Ana-
Chapter 1
1-4
2. Installation
Chapter 2
Installation
This chapter provides instructions on how to download, install, and start RTI Analyzer:
❏ Installing RTI Analyzer (Section 2.1)
❏ Installing the License File (Section 2.2)
❏ Uninstalling RTI Analyzer (Section 2.3)
After installation, see Chapter 3: Starting RTI Analyzer; then we recommend that you
walk through Chapter 5: Tutorial.
2.1
Installing RTI Analyzer
In the following instructions, replace x to match your version of RTI Analyzer.
1. To install RTI Analyzer, simply run the installer and follow the on-screen instructions.
2. Optional: Download and install RTI Shapes Demo. This is only required if you
want to follow the steps in Chapter 5: Tutorial. RTI Shapes Demo is available from
RTI’s Downloads page (http://www.rti.com/downloads) in the section titled
Interactive DDS Demonstration. RTI Shapes Demo runs on Windows and Linux
systems. Follow the installation instructions that accompany the distribution file.
Additional Steps for Linux Systems
1. cd <location of RTI_Analyzer-1.4.x-SetupLinux.sh>
2. chmod 755 RTI_Analyzer-1.4.x-SetupLinux.sh
3. ./RTI_Analyzer-1.4.x-SetupLinux.sh
2-1
Chapter 2
Additional Notes for Solaris Systems
If you are root/administrator when you install RTI Analyzer, then only the root
user/administrator will be able to run RTI Analyzer unless you do the following:
• Make sure other users have read access to all files in
<installation directory>/apps/RTI Analyzer 1.4.x.
• Provide other users with ‘execute’ permission on directories and executables
under the <installation directory>/apps/RTI Analyzer 1.4.x directory.
• Make the <installation directory>/apps/RTI Analyzer 1.4.x/eclipse/configuration directory writable by users other than root/administrator.
2.2
Installing the License File
RTI Analyzer requires a valid license to run. You will receive one via email after you
download the software.
Save the license file in any location of your choice. When RTI Analyzer starts, it will look
in these locations until it finds a valid license:
1. The file <installation directory>/RTI Analyzer 1.4.x/rti_license.dat.
2. The file specified in the environment variable RTI_LICENSE_FILE, which you
may set to point to the full path of the license file, including the filename (for
example, C:\RTI\my_rti_license.dat).
3. The file rti_license.dat in the current working directory.
4. The file rti_license.dat in the directory specified by the environment variable
NDDSHOME.
If RTI Analyzer cannot find a valid license file automatically, it will prompt you to enter
the location of a license file.
If you have any questions about license installation, please contact [email protected].
2.3
Uninstalling RTI Analyzer
On a Windows system, select Start, Programs, RTI, RTI Analyzer 1.4.x, RTI Analyzer
Uninstaller. (Or you can select Start, Control Panel, Add/Remove Programs1.)
2-2
2.3 Uninstalling RTI Analyzer
On a Linux or Solaris system, run:
<install-dir>/uninstall
Note: If RTI Analyzer was installed on a remote file system, the following files will not be
removed:
.install4j
2. Installation
❏
❏
❏
❏
❏
❏
❏
❏
❏
❏
jre
jre/bin
jre/lib
jre/lib/ext
jre/lib/i386
jre/lib/i386/xawt
jre/lib/i386/native_threads
jre/lib/i386/client
jre/lib/font
To completely uninstall RTI Analyzer on a remote file system, run:
rm -rf <install-dir>
1. On Windows Vista systems, select Start, Control Panel, Programs and Features.
2-3
Chapter 2
2-4
Chapter 3
Starting RTI Analyzer
❏ You must use a new workspace with RTI Analyzer 1.4. Workspaces created with
older versions of RTI Analyzer will not work.
increases. RTI Analyzer is configured for 256 MB of memory by default, which is
sufficient for a total of 2,000 data readers and data writers.
For larger data sets, make this change before starting RTI Analyzer: In the file
<install-dir>/apps/RTI_Analyzer_1.4.x/eclipse/rdp.ini, change "-Xmx256m" to
"-Xmx512m" or "-Xmx1024m", depending on the total number of endpoints your
system contains.
In the following, we refer to RTI Analyzer 1.4.x; x is place-holder for a release-specific
number.
3.1
Windows Systems
On a Windows Vista system:
1. Modify the RTI Analyzer shortcut to run as Administrator:
a. From the Start menu, select All Programs, RTI, RTI Analyzer 1.4.x
b. Right-click the RTI Analyzer shortcut and select Properties
c. In the Properties' Shortcut tab, select Advanced...
d. Check the box Run as administrator
e. Click OK twice
3-1
3. Starting RTI
Analyzer
❏ RTI Analyzer requires more memory as the size of data set it has to process
Chapter 3
2. Make sure you have administrator privileges.
3. From the Start menu, select All Programs, RTI, RTI Analyzer 1.4.x, RTI Analyzer.
On other Windows systems:
❏ From the Start menu, select Programs, RTI, RTI Analyzer 1.4.x, RTI Analyzer.
3.2
Solaris and Linux Systems
Enter the following command:
$ <install-dir>/scripts/rtianalyzer
3.3
Running without an Active Network Interface
To use RTI Analyzer on a computer that does not have an active network interface, you
must configure the tool so that it only uses shared memory, as follows:
1. Click the Configure
button to open the DDS Domain Configuration dialog.
2. Select the Transport Properties tab and clear the checkbox for Enable Multicast.
(If this option is disabled, click the Add button first.)
3. Click OK.
3-2
Chapter 4
Configuring RTI Analyzer
There are two parts to RTI Analyzer configuration—domain configuration and Qos
parameters.
Domain configuration consists of providing RTI Analyzer with the list of domain IDs
that you would like to analyze. To access the dialog seen in Figure 4.1, select the Configure button
in the Agent Control view (lower left corner). From the Agent Configuration window, in the lower left portion of this view, you can select Add or Delete to add
or delete domain IDs to be analyzed. Each domain ID can have separate QoS parameters.
There are two ways to configure RTI Analyzer Qos parameters:
You can use either method; however you cannot use both at the same time.
The QoS profile method gives you greater control over the configuration because you
can change all DomainParticipant QoS settings. It’s also a simple way to use the exact
same profile as the RTI Data Distribution Service application that you are analyzing. The
GUI method allows you to change a subset of QoS values.
If you do not configure RTI Analyzer, it will use the same default configuration as RTI
Data Distribution Service. The default configuration file for RTI Data Distribution Service is
located here:
❏ $NDDSHOME1/resource/qos_profiles_4.5x2/xml/NDDS_QOS_PROFILES.xml
1. NDDSHOME represents the installation directory for RTI Data Distribution Service.
2. x stands for the version letter of the current release.
4-1
4. Configuration
❏ Specifying a QoS Profile (Section 4.1)
❏ Configuring RTI Analyzer from the GUI (Section 4.2)
Chapter 4
4.1
Specifying a QoS Profile
The DDS Domain Configuration dialog allows you to specify an XML configuration
profile from a file.
To access the dialog seen in Figure 4.1, select the Configure button
in the Agent
Control view (lower left corner). Select the option labeled Configure using XML QoS
Profile. Then select the profile file, library, and profile that you want to use.
Figure 4.1
Selecting an XML QoS Profile
You can create your own profile file and use it to make changes to any DomainParticipant QoS. RTI Analyzer will ignore other QoS settings in the profile (because it does not
create any other DDS entities).
Note: If you make a mistake in entering the File Name, Library Name or Profile Name,
RTI Analyzer will print an error message the next time you click the “Start/Stop” button
in the Agent Control window.
4-2
4.2 Configuring RTI Analyzer from the GUI
4.2
Configuring RTI Analyzer from the GUI
You can change commonly used configuration settings from the Configure DDS
Domains dialog. If you need to change a parameter not exposed through the GUI,
please use XML profiles (see Section 4.1).
To access this dialog, select the Configure button
in the Agent Control view (lower
left corner). Then select the option labeled Configure within RTI Analyzer.
Then you can select from several tabs, described in the following figures.
Figure 4.2
Peer Locators Tab
The Peer Locators tab allows
you to set the peer list used by
RTI Data Distribution Service to
discover other DDS entities. By
default this list includes shared
memory, UDP loopback and
multicast. Please refer to the
RTI Data Distribution Service
User’s Manual for more information about discovery peers.
4. Configuration
4-3
Chapter 4
Figure 4.3
Transport Properties
The Transport Properties tab
allows you to set the properties of the transports used by
RTI Data Distribution Service.
By default, the UDPv4 and
shared-memory
transports
are enabled; there are also
tabs for UDPv6 and RTI
Secure WAN Transport. You
may also enable or disable
multicast from this tab.
4-4
4.2 Configuring RTI Analyzer from the GUI
Figure 4.4
Resource Limits Tab
The Resource Limits tab
allows you to change
some commonly used
resource limits for RTI
Data Distribution Service.
4. Configuration
4-5
Chapter 4
Figure 4.5
Wire Protocol Tab
The Wire Protocol tab
allows you to change
configuration parameters
for the Real-Time Publish
Subscribe protocol used by
RTI
Data
Distribution
Service.
4-6
4.2 Configuring RTI Analyzer from the GUI
Figure 4.6
Properties Tab
The
Properties
tab
allows you to add Properties to the DomainParticipant’s Property QoS
policy. The properties
have a wide range of
uses, from configuring
transports to being propagated with the RTI Data
Distribution Service discovery information.
Please see the RTI Data
Distribution Service User’s
Manual for more information on properties.
4. Configuration
4-7
Chapter 4
4-8
Chapter 5
Tutorial
The best way to learn about RTI Analyzer is to start using it. The goal of the tutorial is to
help you become familiar with RTI Analyzer’s main features. We will use RTI Shapes
Demo as an easy way to start a DDS publish-subscribe application; then we will use RTI
Analyzer to analyze the application’s DDS entities. We’ll create a communications problem on purpose, then walk through the steps to diagnose and correct it.
The RTI Shapes Demo runs on Windows and Linux systems. If you are using a different
operating system, you can still read through this tutorial to get a sense of the features,
then you can experiment with the Hello World example described in the RTI Data Distribution Service Getting Started Guide, or the Stock Price and Stock News examples
described in the RTI Data Distribution Service Tutorial.
This tutorial assumes you have a basic understanding of DDS terms such as DomainParticipants, Publishers, DataWriters, Topics, and Quality of Service (QoS) policies. For an
overview of DDS terms, please see the RTI Data Distribution Service User’s Manual.
The tutorial assumes you have the following software installed:
❏ RTI Shapes Demo 2.x
❏ RTI Analyzer 1.4.x
See Chapter 2 for installation instructions.
The tutorial walks you through the following exercises:
Setting Up RTI Shapes Demo (Section 5.1)
5. Tutorial
❏
❏
❏
❏
❏
Connecting RTI Analyzer to RTI Shapes Demo (Section 5.2)
Working with the Entity Tree (Section 5.3)
Viewing Entity Details (Section 5.4)
Debugging Object Communication Problems with “Match Analysis”
(Section 5.5)
5-1
Chapter 5
❏ Filtering the Match Results Tree (Section 5.6)
❏ Correcting the Circle’s Liveliness QoS (Section 5.7)
❏ Saving and Comparing Snapshots (Section 5.8)
5.1
Setting Up RTI Shapes Demo
We’ll use RTI Shapes Demo to publish and subscribe to Topics which will appear in the
Demo’s window as colored moving shapes. Each shape is a Topic; the shape’s color is
used as the Topic key.
RTI Shapes Demo showcases the capabilities of RTI Data Distribution Service, including
publish-subscribe communication, quality of service (QoS), fault tolerance and automatic discovery. The demo is a turnkey graphical application and does not require any
programming.
❏ This tutorial assumes you are using a computer that has an active network interface. If this is not the case, see Running without an Active Network Interface
(Section 3.3).
❏ RTI Shapes Demo uses Domain ID 0 by default. If you want to use a different
Domain ID, when you start RTI Shapes Demo, use the -domainId <#> option (for
example, to use domain ID 5, enter: rtishapesdemo -domainId 5).
To Begin the Tutorial:
1. Start two copies of RTI Shapes Demo.
On Windows Vista systems: From the Start menu, select: All Programs, RTI,
RTI Shapes Demo <version>, RTI Shapes Demo.
On other Windows systems: From the Start menu, select: Programs, RTI,
RTI Shapes Demo <version>, RTI Shapes Demo.
On UNIX-based systems: Run RTI Shapes Demo from a command shell:
> <install directory>/rti/shapesdemo/rtishapesdemo
5-2
5.1 Setting Up RTI Shapes Demo
The figure to the right shows the
demo program’s main window.
You should start two of these.
We’ll refer to the first Demo
window as the Publisher Demo
and the second as the Subscriber
Demo.
2. In the Publisher Demo, create
2 squares, 1 triangle, and
1 circle—all with default QoS
settings:
a. Under Publishers, click on
Square.
b. In the Create New Publisher
dialog, select RED and click
OK. (Use the defaults for the
other settings).
You should see a red square
moving in the display area.
c. Use the same process to create a green square, a yellow circle, and an orange
triangle (with default settings).
You’ve just created 4 Writers (2 Squares, a Triangle, and a Circle).
3. In the Subscriber Demo, subscribe to squares and circles (but not triangles):
a. Under Subscribers, click on Square and click OK. (Leave the default settings.)
You’ve just created 1 Reader that will receive data for all squares (all colors).
b. Use the same process to create a Reader for circles—with Liveliness set to
AUTOMATIC and Lease Duration set to 50 ms.
Do not create a Reader for triangles—this will demonstrate how RTI Analyzer
points outs Writers without matching Readers.
5-3
5. Tutorial
Recall that we created the Circle Writer with the defaults, so its Liveliness
Lease Duration is INFINITE. The QoS compatibility rules for Liveliness
require that the Writers’ Lease Duration must be <= the Reader’s. By setting
the Reader’s to 50 ms., we are intentionally causing the Circle Reader/Writer
pair to be incompatible. This will demonstrate how RTI Analyzer points out
the error and then allows you to correct it by writing a new QoS value to the
RTI Shapes Demo.
Chapter 5
Your two RTI Shapes Demo windows should look like this:
Publisher
Subscriber
Notice that the Subscriber’s shapes have colored borders. This is how you can
distinguish between Subscribers (colored borders) and Publishers (thin black
borders). By default, Subscribers show the most recent 6 samples—this is why
you see extra squares behind the leading one. The most recent shape has a
thick border. Older (historical) samples have a thinner border.
Also notice that you do not see a triangle or circle shape in the Subscriber’s
window. (We didn’t create a Reader for Triangles, and the Reader for Circles
has an incompatible QoS.)
c. You may minimize these two windows, we won’t need them for a while.
5-4
5.2 Connecting RTI Analyzer to RTI Shapes Demo
5.2
Connecting RTI Analyzer to RTI Shapes Demo
1. Start RTI Analyzer.
On Windows Vista systems: Run RTI Analyzer from the Start menu:
select All Programs, RTI Analyzer <version>; right-click RTI Analyzer and
select Run as administrator.
On other Windows systems: Run RTI Analyzer from the Start menu:
select Programs, RTI Analyzer <version>, RTI Analyzer.
On UNIX-based systems: Run RTI Analyzer from a command shell:
> <install directory>/scripts/rtianalyzer
Next, select Go To RTI Analyzer when you see this Welcome screen1:
5. Tutorial
1. The Welcome screen is only displayed the first time you use a new workspace.
5-5
Chapter 5
2. In the Agent Control view (lower left corner), select the Configure button
This is where you will tell RTI Analyzer what applications to look for.
.
3. In the DDS Domain Configuration dialog, click OK. This will configure the tool
to use the default Domain ID, 0, which is the same default value used by the RTI
Shapes Demo. (However, if you started the Demo with a different ID, change it
before clicking OK.)
4. Back in the Agent Control tab, select the Start button
.
5. Within a few seconds, you should see DomainID 0 in the Entity tree. (Or, if you
changed the domain ID, you should see your modified ID.)
5-6
5.2 Connecting RTI Analyzer to RTI Shapes Demo
6. Select the Expand Tree button
to see all the entities:
Click here to
expand the tree.
(Note: Your HostId, AppId, etc., will be different from those in the screenshots shown
throughout this document.)
5. Tutorial
5-7
Chapter 5
5.3
Working with the Entity Tree
The Entity tree shows you what Entities have been discovered. By default, the objects in
the tree are sorted in this order:
• Domain ID
• Host address
• Application Name (Host ID, App ID, Instance ID, Entity ID
• Subscriber/Publisher (Host ID, App ID, Instance ID, Entity ID)
• Reader/Writer (Topic:DataType, Host ID, App ID, Instance ID, Entity ID
5.3.1Changing the Tree Layout
You can change the way the tree is sorted. There are two other predefined layouts (Sort
by Topic
, Sort by Domain ID
). Try both buttons to see their effect.
You can create your own tree views by using the Build Your Own Tree button
5-8
.
5.3 Working with the Entity Tree
For example, let’s create a view that only shows these objects:
• Application
• Reader/Writer
• Topic
To create a custom tree layout:
1. From the Entity Tree tab, click the Build Your Own Tree button
.
2. Click, or drag and drop, the Application, Reader/Writer, and Topic buttons (in
that order).
2. Save your custom tree.
5. Tutorial
1. Click, or drag and drop the desired types into the Preview area.
5-9
Chapter 5
3. To save this tree layout:
a. Click Save As....
b. Enter a name for the view, such as MyTreeView.
c. Click OK.
4. Click OK to close the Build Your Own Tree dialog.
In the Entity Tree pane, you will see a new button for Tree Layouts
button only appears when there are custom tree layouts.
5. Click the triangle on the right of the
from the drop-down list.
6. Select the Expand Tree button
now look like this:
5.3.2
— this
button and select your new layout
to see all the entities in the tree, which should
Filtering Out Specific Entities
The Filter button
appear in the tree.
allows you to control which domain IDs, hosts, and Topics
In the Tree Filter Settings dialog, you can enter text, wildcard expressions, or regular
expressions to refine the filter.
5-10
5.3 Working with the Entity Tree
For example, let’s hide the Topic called Triangle for now:
1. Select the Sort by Topic button
2. Select the Filter button
.
.
3. In the Tree Filter Settings dialog, clear the TopicName checkbox and enter
‘Triangle’ as shown below:
4. Click OK to close the dialog.
5. Tutorial
5-11
Chapter 5
5. Select the Expand Tree button
which should now look like this:
to see all the (non-triangle) entities in the tree,
The filter button turns green when a filter is in use.
5-12
5.4 Viewing Entity Details
5.4
Viewing Entity Details
Now let’s see what details are available about the Entities in the tree.
1. Select a Reader, such as the one for the Topic named Circle.
2. Select the Entity Info view. Within that view, select the different tabs to become
familiar with their contents:
•
•
QoS
•
•
User Data QoS
Displays the current QoS settings for the selected entity.
Displays the entity’s current state, the timestamp from the last
update, and the number of state changes. (Not applicable to hosts or applications.)
Status
Displays the contents of the User Data QoS policy, if any.
Displays the definition of the data type used by the selected
Writer, Reader, or Topic. (Not applicable to other types of objects in the tree.)
Data Type
5. Tutorial
5-13
Chapter 5
5.5
Debugging Object Communication Problems with
“Match Analysis”
RTI Analyzer’s Match Analysis feature helps you see which Writers and Readers are
‘matched’ (and therefore able to communicate with each other) and which ones aren’t.
This feature can help you spot incompatible QoS settings, as well as common errors
such as misspelled Topic names.
❏ As you may recall, in Setting Up RTI Shapes Demo (Section 5.1), we deliberately
created an error in our Publisher and Subscriber Demo, so we could see how RTI
Analyzer helps you diagnose problems. On the publishing side, we created a Circle with default Liveliness (AUTOMATIC kind, with INFINITE lease_duration);
on the subscribing side, we created a Circle with Liveliness set to 50 ms. Since the
offered lease_duration (INFINITE) is not <= the requested lease_duration (50
ms), a Writer/Reader pair with incompatible QoS.
❏ We also created a Triangle on the publishing side, but not on the subscribing
side. While this is not technically an error, it is a situation that you may want to
be aware of.
The Match Analysis view uses a tree view to show DDS objects, with the following hierarchy:
• Domain ID
• Topic
• Writer
• Reader
The results are color-coded to make it easy to see:
❏ Matches (green by default)
❏ Mismatches (that is, incompatible QoS) (pink by default)
❏ Potential Mismatches (meaning RTI Analyzer does not have enough information
to determine if there is a match or not) (yellow by default)
❏ Readers without Writers (and vice-versa) (light purple by default)
You can change the colors used for each category simply by clicking the colored boxes in
the legend at the bottom of the tab.
5-14
5.5 Debugging Object Communication Problems with “Match Analysis”
Let’s see how these two issues show up in RTI Analyzer’s Match Analysis view.
1. Select the Match Analysis tab.
2. Click the Perform Match Analysis button. (If the button is disabled, make sure
that the Match Entities list box has All Writers and Readers selected.)
3. Click the Expand Tree button
button in the Tree pane.)
in the upper right corner. (This is not the same
The Match Results tree should look like this:
5. Tutorial
5-15
Chapter 5
4. Click the pink line for the Reader (under Topic Circle) to see the details:
The Compatibility column shows you which ‘matching’ criteria are okay and
which ones are not. In this case, the Liveliness QoS settings are not compatible.
Recall that we created this ‘mismatch’ on purpose to demonstrate how RTI Analyzer helps you diagnose this type of problem. (In Section 5.7, we will correct this
error.)
5. Click OK to close the details window.
5-16
5.6 Filtering the Match Results Tree
5.6
Filtering the Match Results Tree
The Match Results tree can get rather large if you have several Writers and Readers.
There are two ways to scale down the number of objects included in the Match Results
tree. You can filter out Topics that you are not interested in, or you can limit the analysis
to selected objects. The following steps allow you to practice both ways.
5.6.1
Filtering the Contents of the Match Analysis Tree
Since we know the Square Topic is working correctly, let’s filter it out for now.
1. Select the Filter button
in the Tree pane.)
in the upper right corner. (This is not the same button
2. Clear the checkbox for Topic Square.
5. Tutorial
3. Click OK.
4. Click the Perform Match Analysis button.
5-17
Chapter 5
5. Select the Expand Tree button
on the right.
The Match Results tree should now look like this:
5-18
5.6 Filtering the Match Results Tree
5.6.2
Analyzing Selected Objects Only
Let’s perform a Match Analysis on just the Writer and Reader for the Topic Circle:
1. In the Entity Tree, right-click the Reader for Topic Circle. From the pop-up menu,
select Add to Match List.
If you’d like to change the color used for highlighting entities in the match list,
click the colored Match Entities box at the bottom.
5. Tutorial
5-19
Chapter 5
2. Do the same thing for the Topic Circle’s Writer. Now you should see that both
entities are highlighted to show they are in the match list.
3. In the Match Analysis view’s Match Entities field, use the drop-down list to
choose Selected Writers and Readers.
4. Click the Perform Match Analysis button.
5. Select the Expand Tree button
5-20
on the right.
5.6 Filtering the Match Results Tree
The Match Results tree should now look like this:
Important Step!
6. In the next section we will correct the incompatible QoS. But before we make any
changes, take a snapshot of the current system. A snapshot saves the DDS
object information. Later (in Section 5.8), we will take another snapshot and
show you how to compare them.
Take a snapshot of our current configuration by selecting Snapshots, Save Snapshot As... and selecting a filename of your choice, such as mysnapshotA.
5. Tutorial
5-21
Chapter 5
5.7
Correcting the Circle’s Liveliness QoS
Now that we’ve seen how RTI Analyzer can help you find incompatible QoS settings,
let’s correct the problem.
1. Open the RTI Shapes Demo window for the Subscriber Demo. (This window’s
shapes have dark blue borders.)
2. In the Legend at the bottom, select the row for the Circle.
3. Press the Delete key on your keyboard.
4. Recreate the Reader for Circles: under Subscribers, select Circle and click OK.
(So this time, we will use the default Liveliness.)
5. While we’re correcting problems, create a Reader for Triangles: under Subscribers, select Triangle and click OK. (Although this isn’t part of correcting the Circles’ problem, it will make the snapshot comparison in the next section more
interesting.)
6. In the Subscriber Demo window, notice that it is now receiving data for Squares,
the now-compatible Circle, and Triangles, too.
Publisher
5-22
Subscriber
5.8 Saving and Comparing Snapshots
7. In the RTI Analyzer’s Match Analysis view, change the Match Entities list box to
All Writers and Readers. Then press Perform Match Analysis. You will see the
mismatch is gone. (Squares are not displayed because we filtered them out in
Section 5.6).
Congratulations, you have diagnosed and corrected the communications problem!
5.8
Saving and Comparing Snapshots
In this section, we’ll look at RTI Analyzer’s Snapshots Comparison feature.
A snapshot saves the DDS object information about an attached application. You can
compare one saved snapshot to the current “live” data, or compare two saved snapshots
to each other. This feature can help you understand why one configuration behaves differently from another.
2. Select the Snapshots Comparison view.
3. Under Snapshot 1, select the checkbox fore Live Data.
4. For Snapshot 2, use the two Browse… buttons to select your snapshot file.
5-23
5. Tutorial
1. Recall that we took a snapshot of our original configuration just before we corrected the QoS of the Reader for Circles in Step 6 on page 5-21.
Chapter 5
5. Ensure that the two checkboxes under Options are selected (System being analyzed... and Exclude disposed entities...).
6. Click the Compare Snapshots button and select the Differences tab. The Entity
Counts tab will show that the current system (live data) has one more Reader
than the snapshot:
7. Click the Detailed Differences subtab.
Here, RTI Analyzer points out more details. Keep in mind that we deleted a Circle
in the subscriber, then added a new Circle and a Triangle.
Lines 1-2 (pink):
The Topic Triangle and its Subscriber exist in both the live
data and the snapshot, but something about them has
changed. (Recall that we deleted them and then added them
back.)
Lines 3-4 (yellow): Two Readers were added after the snapshot was taken.
Line 5 (blue):
5-24
The original Reader for Circles has been deleted.
5.8 Saving and Comparing Snapshots
8.
Click the Snapshots tab to see a side-by-side comparison of the live-data and
snapshot entity trees.
This completes the RTI Analyzer tutorial. You can gain further experience by analyzing
the applications described in the RTI Data Distribution Service Tutorial or one of your
own RTI Data Distribution Service applications.
5. Tutorial
5-25
Chapter 5
5-26