1
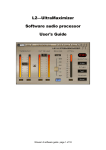
Three-Way USB Scope Shootout . . . are they any good? Are you curious about those low-cost PC-based digital sampling oscilloscopes currently available via the web? This comparison review of the three most common units shows that they can be a cheap alternative to a full-size scope. By JIM ROWE U SING YOUR LAPTOP PC as the heart of a digital oscilloscope has a lot of appeal, as most laptops have a much larger screen than that in most free-standing digital oscilloscopes. But are USB scopes any good? Typically, the vendors all claim outstanding performance, yet they are all overseas and there’s no chance of being able to try their units out; you 70 Silicon Chip have to buy them sight unseen. What about reviews in electronics publications? I could find only one solitary review, of the Hantek DSO2250 USB, written by Geoff Graham, a frequent contributor to SILICON CHIP, on his website at http://geoffg.net The Hantek scope has been available for about six years – under a variety of other brand names including Protek, Acetech, Voltcraft and Tenma. Geoff Graham didn’t rate the DSO-2250 very highly and a more recent online video review really tore it to shreds. It is included in this comparison because it is well-known. The other two units are the Virtins DSO-2820R and the Link Instruments MSO-19.2 (which is actually a mixed signal scope). Hantek and Virtins’ units are made siliconchip.com.au The Hantek DSO-2250 comes with two switchable (10x/1x) 100MHz probes, a USB cable, an 80mm software CD and a 15-page user manual. It has a maximum sampling rate of 250MSa/s and an analog bandwidth of 100MHz, although the sampling rate drops to 125MSa/s when both channels are being used (indicating that the sampling is interleaved). in China, while the Link MSO-19.2 seems to be made in the USA (Fairfield, New Jersey). All three come with drivers and software for PCs running Windows. Hantek DSO-2250 The Hantek unit is housed in a moulded plastic box measuring 190 x 100 x 33mm and weighing 304g. It comes with two switchable (10x/1x) 100MHz probes, a USB cable to be hooked up to two USB ports on your PC, an 80mm software CD and a 15-page A5-size user manual which mainly covers software installation. Hantek claims that the DSO-2250 has a maximum sampling rate of 250MSa/s and an analog bandwidth of 100MHz. However, that only applies when a single channel is being used. With both channels in use, the sampling rate drops to 125MSa/s – so the sampling must be interleaved. Since the effective analog bandwidth is usually defined as the maximum sampling rate divided by at least 2.5, this means that when both channels are used the effective bandwidth for each channel must drop to 50MHz. This is still quite respectable, although it’s not necessarily achieved by the DSO-2250’s analog input channels. siliconchip.com.au When it comes to the size of the internal buffer memory, Hantek specifies a range of 10K – 512K sample points. This upper limit sounds good but after playing with their software for quite a while I still couldn’t figure out (a) whether these figures apply to one or both channels or (b) how to increase the buffer size from 10K anyway. This figure seems to be fixed, although it does seem to apply to each channel. For triggering, the DSO-2250 software lets you choose either one of the two main input channels, both alternately, or the external trigger input (either directly or via a 10:1 attenuator). It also provides a choice of Auto/Normal/Single shot trigger modes, edge triggering (± slope), automatic 50% level triggering and adjustable triggering level over a range of ±4 full vertical divisions. Plus you can also select an HF rejection filter. There’s quite an impressive range of waveform voltage and time/frequency measurements: Vpp, Vmax, Vmin, Vmean, Vrms, Vamp and ±overshoot; plus period, frequency, ±pulse width and rise/fall times. You can also average between 1-128 traces for noise reduction, select either Step, Linear or Sin(x)/x interpolation and even select a virtual display persistence of either zero or within the range of 100ms – 10s. In addition, the DSO-2250 provides an FFT (Fast Fourier transform) based Spectrum Analyser function, with five selectable bin sizes (256, 512, 1024, 2048 or 4096) and a choice of Rectangular, Hanning, Hamming or Blackman window functions. Hantek doesn’t specify the current drawn by the DSO-2250 from the PC’s USB port but the fact that it is supplied with a USB cable fitted with two Type-A plugs at the PC end suggests that its current drain is fairly hefty. We measured it at between 560mA and 580mA. That explains the second Type-A plug, to share the load between two of the PC’s USB ports. Virtins DSO-2820R We reviewed the Virtins Multi-Instrument virtual instrument software MI3.2 in the September 2012 issue of SILICON CHIP. This software was capable of turning a PC with a decentquality sound card into a 2-channel audio scope combined with an FFT spectrum analyser, plus a 2-channel audio signal/function generator. In the same issue, we described a Virtual Instrument Audio Test Interface and you can see a 2-page preview at February 2015 71 Virtins’ DSO-2820R is a 2-channel USB DSO and FFT spectrum analyser, with a maximum sample rate of 200MSa/s (one channel) or 100MSa/s (two channels) and a claimed analog bandwidth of 80MHz. It’s housed in an extruded aluminium case and comes with a pair of switchable (10x/1x) 100MHz test probes, a USB cable and a CD with Virtins MI software, the Windows drivers and two manuals in PDF format. The Link Instruments MSO-19.2 is the smallest of the three units but still packs in a single-channel DSO with a maximum sampling rate of 200MSa/s and a claimed analog bandwidth of 60MHz. Also included is an 8-bit digital logic analyser that can also sample at up to 200MSa/s (synchronised with the DSO) with decoders for SPI and I2C serial digital signals, a 100MSa/s pattern generator or digital word generator, and an FFT spectrum analyser covering from DC to 100MHz. And it also has the makings of a pulse-type time domain reflectometer or TDR! www.siliconchip.com.au/Issue/2012/ September/USB+Test+Instrument+In terface+For+PCs The DSO-2820R is one of a number of PC-based DSOs from Virtins now, all supplied with the Multi-Instrument software – now revised as MI3.4. The DSO-2820R is again a 2-channel USB DSO and FFT spectrum analyser, with a maximum sample rate of 200MSa/s (one channel) or 100MSa/s (two channels) and a claimed analog bandwidth of 80MHz. (There’s also the 72 Silicon Chip lower cost DSO-2810R [US$200] with a maximum sample rate of 100MSa/s, and the larger and more expensive DSO-2820E [US$370] which combines the 2820R DSO and spectrum analyser with a 10-bit 200MSa/s DC-60MHz arbitrary waveform/signal generator.) Smaller than the Hantek unit, the Virtins DSO-2820R is housed in an extruded aluminium case measuring 115 x 70 x 25mm and has an overall weight of 150g. It comes with a pair of switchable (10x/1x) 100MHz test probes, a USB cable to hook it up to one USB port on your PC and a 120mm CD with a bundled copy of Virtins MI software, plus the Windows drivers and two manuals in PDF form – ie, an 80-page hardware manual and a 296-page MI software manual (some of which is not applicable with the DSO-2820R). Virtins claims a maximum sampling rate of 200MSa/s and an analog bandwidth of 80MHz for the DSO-2820R. You will find that the 200MSa/s samsiliconchip.com.au siliconchip.com.au $249.00 $249.00 $220.00 COST IN US DOLLARS, (EXCLUDING FREIGHT) 1x Analog Input (1M//15pF), 8 x Digital Inputs/Outputs (Logic Analyser, Pattern Gen), 1 x Trigger Output 60MHz 8~16 bits/ch, 200MSa/s (1Channel) 100MSa/s (2 Channels) Frame Mode, 2GSa/s RIS Mode* Sampling 8 bits (DSO), 200MSa/s Single Shot, 2GSa/s RIS Mode* Sampling 2 x 80MHz 8 bits/channel, 250MSa/s (1 Channel) 125MSa/s (2 Channels) 2x Analog Inputs (1M//25pF) one External. Trigger Input, 1 x Digital (Probe Comp) Output 2x Analog Inputs (1M//15pF), 1 x Digital (Probe Comp) Output 100MHz (1 Ch), 2 x 60MHz (2 Ch) RESOLUTION, MAXIMUM SAMPLING RATE NUMBER OF INPUT, OUTPUT CHANNELS CLAIMED ANALOG BANDWIDTH 1000 points per channel (DSO, Logic Analyser) In Streaming Mode, Limited only by PC memory or Hard Disk In Frame Mode, 20K (16b) or 40K (8b) Samples per channel. 10K points per channel FRAME BUFFER SIZE 92x61x20mm, plastic (ABS), 74g 115x70x25mm, metal (Aluminium), 150g 190x100x33mm, Plastic (ABS), 304g PHYSICAL CASE SIZE, MATERIAL & WEIGHT 1 x 1M/10M (x1/x10) Input Probe, harness with 15x Digital I/O leads, 9 x nano clips, USB cable (Type A plug to Mini Type B plug) 2 x 1M/10M (x1/x10) Input probes, 1 x USB cable (Type A plug to Type B plug) 2 x 1M (x1)/ 10M (x10) Input probes, 1 x USB cable (2 x Type A plugs, 1 x Type B plug) PROBES & CABLES SUPPLIED YES (120mm CD) YES: Virtins MultiInstrument 3.3 (120mm CD) YES (80mm CD) WINDOWS DRIVER & SOFTWARE SUPPLIED? 4-page A5 Install Guide plus 100-page Software Manual in PDF form on CD 80-page A4 Hardware Manual Plus 296-page M-I 3.3 Software Manual (both in PDF form on CD) 15-page A5 User Manual only HARDWARE & SOFTWARE MANUALS SUPPLIED? CURRENT DRAIN FROM PC’s USB PORT(S) 560-580mA running or stopped (2 USB ports required) 322mA running, 250mA stopped 300mA running, 275mA stopped TRIGGERING FACILITIES SOURCES: Ch1,Ch2, Alt, External, Ext/10 MODES: Auto, Normal, Single Edge, ±Slope, HF reject TRIG LEVEL: 50% or full scale adjustable SOURCES: ChA, ChB, Alt MODES: Auto, Normal, Single, Slow Edge, ± Slope, HF reject, noise rej TRIG LEVEL: Full scale adj, Adj Pre/Post Dig Triggering SOURCES: DSO or any combn of Logic Analyser inputs MODES: Auto, Normal, Single Edge, ±Slope, <pulse width> TRIG LEVEL: full scale adjust, Pre/Post trig for Logic Analyser MAIN FEATURES ADDITIONAL FUNCTIONS Logic Analyser, SPI and I2C analysis MEASUREMENTS: Vp-p, Vmax, Vmin, Vmean, Vmedian, Vrms, VcursorA, VcursorB Period, Frequency, ±pulse width, rise/fall time etc. MEASUREMENTS: Vmax, Vmin, Vmean, Vrms, dBV, dBu, dB, dB(A/B/C) Frequency, RPM, duty cycle etc (Many of these via the ‘DMM’ display.) SPI & I2C DECODERS PATTERN GENERATOR: Maximum 1023 points, Rate 10kSa – 100MSa/s 8-bit LOGIC ANALYSER: 100MHz bandwidth FFT/SPECTRUM ANALYSIS: 1000 points/channel Seven Window Functions CALIBRATION SIGNAL GENERATOR: Square wave or MLS, Frequency 25MHz/N where N = 1 – 25000. FFT/SPECTRUM ANALYSIS: Nine bin sizes (128 – 32768), 50 Window Functions MEASUREMENTS: Vp-p, Vmax, Vmin, Vmean, Vrms, Vamp, ± overshoot, FFT/SPECTRUM ANALYSIS: Period, Frequency, Five bin sizes ± pulse width, (256 – 4096), rise/fall time etc. Four Window Functions Averaging (Rectangular, Hanning, (1�––128 traces Hamming, Blackman) Interpolation (Step, Linear, sin(x)/x) Persistence (Min, 100ms – 10s) FIG.1: A COMPARISON CHART OF THREE LOW COST PC-BASED/USB POWERED DSO & MSO DEVICES *RIS mode is ‘Random Interleave Sampling’, one variant of Equivalent Time Sampling or ‘ETS’ (used to achieve higher effective sampling rates, but for repetitive signals only) USA (Link Instruments, Fairfield, NJ) LINK Instruments MSO-19 CHINA VIA SINGAPORE (Virtins Technology) VIRTINS VT DSO-2820R CHINA (QingDao Hantek Electronics) HANTEK DSO-2250 BRAND, MODEL & COUNTRY OF ORIGIN pling rate only applies when a single channel is being used. With both channels in use, the figure drops to 100MSa/s – again, the sampling must be interleaved. The effective analog bandwidth would also drop to 40MHz. The size of the 2820R’s internal frame buffer memory is given as 40,000 bytes, which equates to 40,000 8-bit samples using a single channel or 20,000 8-bit samples per channel when using both channels. This is for normal real-time 8-bit sampling in frame mode. However, Virtins claims that the 2820R and its other second generation DSOs offer additional features, such as hardware DSP-based bit-resolutionenhancement (BRE) and an adaptive anti-aliasing filter. The BRE feature is only available for sampling rates below 100MSa/s but when it is enabled the effective sampling resolution of the 2820R increases by 1/2 a bit for each halving in sampling frequency. So for a sampling rate of 25MSa/s, BRE gives an effective bit resolution of 9 bits, rising to 10 bits at sampling rates below 6.25MSa/s, 11 bits at rates below 1.563MSa/s and so on. In fact, the effective bit resolution can be raised to a full 16 bits for sampling rates of 1.526kSa/s and below. In other words, BRE provides a way of trading sampling rate for effective sampling bit resolution – allowing you to examine and measure low-frequency signals with higher resolution. Virtins MI software also allows for equivalent time sampling and Streaming/Record mode sampling. The triggering flexibility is also quite good, with Auto/Normal/Single shot or Slow trigger modes, edge triggering (± slope), adjustable triggering level and trigger delay adjustable anywhere between the start (-100%) and finish (+100%) of the record length (normally the delay is set to 0%, or the centre of the record). You can also choose between either of the two main input channels as the trigger source when they’re both being used. There’s also the ability to select from 13 different trigger signal filtering options including NIL (all pass), HFR (high frequency reject), NR0-NR4 for noise rejection, HN0-HN4 for HF rejection plus noise rejection, and HNX for user-configurable filtering. Voltage and time/frequency measurements (Vmax, Vmin, Vmean and Vrms) are displayed automatically at the top of the DSO display window, while Vrms, frequency, duty cycle, February 2015 73 x1 Probe Bandwidth The blue curves in Fig.2 show the much poorer bandwidth of all three USBDSO devices when their input probes were switched into their x1 position. This is quite typical – even though probe and scope manufacturers are usually rather coy about this. The reason for the reduced bandwidth of the probes in their x1 position is that their frequency compensation is designed to optimise performance in the x10 position, where the input signal is divided by 10 before passing through the distributed capacitance, resistance and inductance of the output cable. Since the input divider and compensation are effectively shorted out in the x1 position, the signals end up being attenuated by the output cable before they reach the input of the scope. So if you want to achieve the full bandwidth of any scope for measuring small signals, it’s better to use a direct connection to the scope input – not a x10/x1 probe switched to its x1 position. dBV, dBu, dB and dB(A/B/C filtering) can be displayed in a separate DMM window. There doesn’t appear to be any provision for averaging, while the Chart options seem to provide a choice of Line, Scatter, Column, Bar and Step so there is no option for sin(x)/x interpolation. However, you can select a virtual display persistence of either Zero, Phosphorescent, Rainbow or Equivalent Time Sampling (with the ability to set the number of frames). You can also set the trace line width from 1-10 pixels. In addition, the DSO-2820R again provides an FFT (Fast Fourier Transform) based Spectrum Analyser function, with nine selectable bin sizes (128-32,768) and 50 different window functions to suit many different applications. As well as Rectangle, Triangle, Hamming, Hanning, Blackman, Exact Blackman, Blackman-Harris and Blackman-Nuttal, Flat Top, Welch, Riemann, Parzen and Bohman, there are 14 different Kaiser windows, three Poisson, three Hanning-Poisson, three Cauchy, three Tukey, four Cosine and three Gaussian windows. Virtins quote the DSO-2820R’s maximum power consumption as 1.5W. We measured the total current drain at 250mA when the DSO and FFT were stopped and 322mA when they were running. In other words, just over half the drain of the DSO-2250 and well within the capabilities of a single standard USB 2.0 host port. Link Instruments MSO-19.2 This is the smallest of the three units and is housed in a moulded 74 Silicon Chip plastic case measuring 92 x 61 x 20mm and weighing a mere 74g. Yet Link Instruments has managed to pack in a single-channel DSO with a maximum sampling rate of 200MSa/s and a claimed analog bandwidth of 60MHz, an 8-bit digital logic analyser that can also sample at up to 200MSa/s (synchronised with the DSO) with decoders for SPI and I2C serial digital signals, a 100MSa/s pattern generator or digital word generator, and an FFT spectrum analyser covering from DC to 100MHz. And it also has the makings of a pulse-type time domain reflectometer or TDR! So as well as being very small and light, it’s a versatile mixed signal package of PC-based test instruments. Small wonder Link Instruments can boast that the MSO-19 was chosen by NASA as the only oscilloscope to be provided on the International Space Station. It comes with a single passive switchable (10x/1x) 100MHz test probe but there’s also a plug-in 15-wire harn ess for the digital logic analyser inputs and pattern generator outputs, together with nine nanoclips for attaching the digital leads to a device under test (DUT). There is also the USB cable, a 4-page A5 installation guide, a 120mm CD with the companion drivers and software, plus a 100-page software manual PDF. Although the MSO-19.2 has a maximum real-time sampling rate of 200MSa/s, it also has provision for RIS (Random Interleaved Sampling), a type of Equivalent Time Sampling (ETS), at rates of either 1GSa/s or 2GSa/s. The interpolation seems to be fixed at linear though, for both real time and RIS sampling. The size of the MSO-19.2’s internal buffer memory appears to be 2KB, with 1023 bytes allocated to the DSO for storage of 1000 sample points and the other 1023 bytes used for storing the logic analyser and pattern generator data. When either of these buffers become full, their contents are transferred to the PC via the USB cable. There is a choice of Auto/Normal/ Single shot trigger modes, edge triggering (± slope), adjustable triggering level over a range of ±4 full vertical divisions with a resolution of 12.5mV, and pulse width triggering. There’s also an Autosetup mode. Triggering can be from the DSO input channel or any of the eight logic analyser digital inputs. The chosen triggering signal also becomes available via the second BNC connector on the front of the case, although this connector can also be used as an output for the probe compensation signal, a white noise signal, the TDR output pulses or a low-frequency function generator signal. The measurements comprise Vmax, Vmin, Vpp, Vmean, Vmedian and Vrms, frequency, period, ± pulse width and rise/fall times. In addition, you can activate two voltage cursors and two time cursors, to allow other measurements. The MSO-19.2’s FFT based spectrum analyser function seems to offer a fixed number of bins but a choice of seven window functions: Rectangular, Tapered Rectangular, Triangular, Hamming, Hanning, Flat-Top or BlackmanHarris. There’s also a choice of display types: Magnitude, Power Spectrum, Power Density, Real or Imaginary. There’s also the ability to produce and display an average over 10, 20, 50 or 100 captures. Total current drain of the sample unit proved to be about 275mA when the DSO and logic analyser were stopped, and about 300mA when they were running; well within the capabilities of a PC’s USB2.0 port. Bench tests Our first tests on each of the devices were to check out their actual analog bandwidths. We did this by installing each one’s driver and software on a Compaq CQ61 laptop running Windows 7 Home Premium (32-bit), and then checking its HF response when siliconchip.com.au RELATIVE RESPONSE IN DECIBELS – DSO-2250 +5 +4 +3 RED CURVE: Hantek DSO-2250 (x1 direct input, Rs = 50 Ω) BLUE CURVE: Hantek DSO-2250 (x1 probe input, Rs = 50 Ω) GREEN CURVE: Hantek DS0-2250 (x10 probe input, Rs = 50 Ω) +2 +1 0 –1 –2 –3 –4 –5 100 kHz 200 300 400 500 600 800 1 MHz 2 3 4 5 6 7 FREQUENCY 8 9 10 MHz 20 30 40 50 60 70 80 20 30 40 50 60 70 80 20 30 40 50 60 70 80 100 MHz RELATIVE RESPONSE IN DECIBELS – DSO-2820R +5 +4 +3 RED CURVE: Virtins DSO-2820R (x1 direct input, Rs = 50 Ω) BLUE CURVE: Virtins DSO-2820R (x1 probe input, Rs = 50 Ω) GREEN CURVE: Virtins DSO-2820R (x10 probe input, Rs = 50 Ω) +2 +1 0 –1 –2 –3 –4 –5 100 kHz 200 300 400 500 600 800 1 MHz 2 3 4 5 6 7 FREQUENCY 8 9 10 MHz 100 MHz RELATIVE RESPONSE IN DECIBELS – MSO-19.2 +5 +4 +3 RED CURVE: Link Inst’s MSO-19.2 (x1 direct input, Rs = 50 Ω) BLUE CURVE: Link Inst’s MSO-19.2 (x1 probe input, Rs = 50 Ω) GREEN CURVE: Link Inst’s MSO-19.2 (x10 probe input, Rs = 50 Ω) +2 +1 0 –1 –2 –3 –4 –5 100 kHz 200 300 400 500 600 800 1 MHz 2 3 4 5 FREQUENCY 6 7 8 9 10 MHz 100 MHz Fig.2: these three graphs show the response of each instrument when measuring the unmodulated output of a Gratten GA1484B signal generator. The generator’s output was set to +13dBm (1.0V RMS) and its signal fed to the input of the device being tested via a 50Ω cable, terminated with a 50Ω load. Three different tests were done: (1) with the generator signal fed directly into the DSO channel input; (2) with the signal fed via the matching test probe, set to the x10 position and with its compensation optimised; and (3) with the signal via the same test probe set to the x1 position. siliconchip.com.au February 2015 75 Fig.3: a grab taken when the Virtins 2820R was being used to examine a 48MHz 0dBm sinewave using Equivalent Time Sampling. The Oscilloscope Properties dialog is open at upper right, with the waveform visible to its left and the FFT plot below. Fig.4: this screen grab shows the Link MSO-19.2 capturing a 48MHz 0dBm sinewave using RIS/ETS sampling at 1GSa/s. Note the linear interpolation and the frequency measurement error. Fig.5: the Link MSO-19.2 capturing a 20MHz +13dBm sinewave at 200MSa/s. The linear interpolation is again quite evident. measuring the unmodulated output of a Gratten GA1484B signal generator. The generator’s output was set to 76 Silicon Chip +13dBm (= 1.0Vrms) and the output signal taken to the input of the device being tested via a 50Ω cable, terminated with a 50Ω load at the device end to minimise reflections and standing waves. Three different tests were done: (1) with the generator signal fed directly into the DSO channel input; (2) then via the matching test probe, set to the x10 position and with its compensation optimised; and (3) finally, via the same test probe to the x1 position. The results of these tests are shown graphically in Fig.2. In each case, the curve for the first (direct) input test is shown in red, that for the compensated x10 test probe test is shown in green and that for the x1 test probe test is shown in dark blue. You’ll see that the basic analog bandwidth of the Virtins DSO-2820R is within +0/-1dB up to 40MHz and falls to -3dB at very close to 70MHz; Similarly, the Link MSO-19.2 is within +0.5/-0.5dB up to 44MHz and falls to -3dB at about 74MHz. In this respect, they’re both noticeably better than the Hantek DSO-2250 which falls to the -1dB point at about 8MHz and falls to -3dB at close to 40MHz. Then after falling to -4dB at 50MHz, it rises again to reach +1.9dB at 100MHz. We can probably attribute that upward rise in the DSO-2250’s red curve to aliasing artefacts, so this part of the curve is best ignored. If we look at the green compensated x10 probe curves, the results are a little more equivocal. Even the response of the Hantek DSO-2250 doesn’t fall to -1dB until 24MHz and extends out to 40MHz before it drops to -3dB. In other words, the compensated x10 probe actually lifts the performance of the DSO-2250. On the other hand, the Virtins DSO2820R is now within +0.7/-1.0dB only up to 34MHz, and falls to -3dB at about 38MHz – so the compensated x10 probe has lowered its performance a little. The Link MSO-19.2’s compensated x10 probe has again improved its performance slightly, albeit with a small dip between 40-50MHz and a small peak at 60MHz. But its -3dB point has risen to just on 80MHz. The three blue curves show the x1 probe responses. These all show a significant drop in bandwidth compared with the direct input bandwidth of each device. This is to be expected as it’s a fairly well known limitation of the x1 position of just about all switched passive probes. But the really surprising thing when siliconchip.com.au you compare the three blue curves in Fig.2 is that the bandwidth of the MSO-19.2 with its probe in the x1 position is much better than the other two. It rises to a broad +1dB peak at 15MHz and only falls to -3dB at about 28MHz. This improved performance of the MSO-19.2’s probe in the x1 position suggests either that it’s of a higher quality or that Link has built some compensation into its software. RIS/ETS sampling As already noted, both the DSO2820R and the MSO-19.2 offer the ability to perform RIS/ETS sampling as well as real-time sampling, to allow better definition of higher-frequency repetitive signals. We tried out the ETS functions of both devices but we were not overly impressed with either of them. On the DSO-2820R, we initially had a problem even getting the MI3.3 software to allow us to turn on the ETS option in the Oscilloscope Chart Options dialog – it seemed to be permanently greyed out and unavailable. It was only after sending a help email to Virtins that we received a reply explaining that the trick was to set the Trigger mode to Normal, the Trigger Frequency Rejection to NIL and the Trigger Delay to zero or less than zero. We were advised that this is indicated on page 105 of the MI3.3 software manual and when we looked on that page there it was – not in the text though, just buried in a screen grab. When we did get the ETS function working, we were able to capture a few waveforms that appeared to be sampled at a higher sampling rate. However there was no indication on the screen of the effective sampling rate – just the actual real-time sampling rate in the usual position near the top of the screen. In any case, the waveform being displayed seemed to be infected with travelling glitches, like those visible in the screen grab of Fig.3 (which shows a sinewave at 48MHz). This can also be seen from the FFT display of the same waveform below it where quite a few spurs were also visible – although most of them remained below about -55dBV. At first we wondered if these glitches and spurs were due to speed limitations in the processor of the laptop being used, which only has an Intel dual-core Celeron CPU running at 1.8GHz. So we tried installing the siliconchip.com.au Fig.6: here’s a grab of the Hantek DSO-2250 capturing a 35MHz +10dBm sinewave signal, with the acquisition menu showing that sin(x)/x interpolation has been selected. Note the smoother sine waveform (green), plus the superimposed FFT in deep purple. MI3.3 software and Virtins driver on a somewhat faster Asus BP6320 desktop with an Intel Core i7-3770 CPU running at 3.4GHz, with Windows 7 Pro (64-bit) and a 250GB SSD. The results were almost identical, so the glitches and spurs must be due to something else. When we tried out the RIS/ETS function on the MSO-19.2, the results were a little more promising. The MSO-19.2’s software does show you the effective sampling rate in this mode, just below the horizontal speed knob at upper left on the screen. And there were no glitches as such on the waveform display – just moving linear interpolation vector lines and their junctions, as you can see in the screen grab of Fig.4. As the displays using real-time sampling are much the same (see Fig.5), we are inclined to think that the effect is due to the lack of sin(x)/x sample interpolation in the MSO-19.2’s display processing. Virtins MI3.3 and MI3.4 don’t seem to offer sin(x)/x interpolation either, so that may be part of the explanation for those glitches. to a rather dark purple which is hard to read (see Fig.6). There’s also a weird problem in the FFT settings dialog box, where the first and second harmonics are always the same in both frequency and value (Fig.7). With the Link MSO-19.2 software, there seems to be only a fixed number of FFT bins (“1000”, presumably 1024) but a choice of any of seven window functions: Rectangular (Dirichlet), Tapered Rectangle (Tukey), Triangular (Bartlett), Hamming, Hanning, Flat-Top and Blackman-Harris. The spectrum can also be scaled in Magnitude (mV), in Power Spectrum (dBm), in Power Density or in its Real and Imaginary components. Multiple FFTs can also be averaged to give a clearer spectrum display – see Fig.8. The Virtins DSO-2820R + MI soft- FFT/spectrum analyser functions When we checked the FFT/spectrum analyser functions on each of the three DSOs, there were strengths and weaknesses in each one. For example, Hantek’s DSO-2250 offers five bin sizes (from 256-4096) and four window functions, plus trace averaging and variable persistence. Yet the spectrum display can only be shown superimposed on the waveform display and seems to be fixed in colour Fig.7: this is the FFT Setting dialog box in Hantek’s software for the DSO-2250, showing how the window function and number of bins can be selected. Note the curious duplication of the first and second harmonics information. February 2015 77 Nyquist-Shannon Sampling Theorem You’ll find the name “Nyquist” cropping up frequently when you’re reading about digital sampling, DSOs, ADCs and DACs – either by itself or together with the name “Shannon”. That’s because Harry Nyquist and Claude Shannon were two of the main researchers and theorists working in the field of information and sampling theory early last century. The sampling theorem usually named after them essentially defines the maximum signal frequency Fmax that can be conveyed by a digital sampling system working at a sampling frequency Fs: Fmax < Fs/2 By the way Fs is often called the Nyquist Rate, while Fs/2 is usually called the Nyquist Frequency. This looks simple enough but a couple of aspects need to be kept in mind when you’re dealing with sampling. First, Fmax refers to the highest frequency COMPONENT in the signal being sampled. For example, a clean 99MHz sinewave signal can be conveyed at a sampling rate of 200MSa/s and reconstructed faithfully at the output – at least in theory. But the same can’t be done with a nominal 99MHz signal having a more complex waveform, because this will have harmonics and other components at frequencies well above 99MHz. Remember – Fmax applies to ALL components in the signal, not just the fundamental. The other thing to remember is that the Nyquist-Shannon theorem assumes that all samples are equally spaced in time. In other words, that Fs is fixed and constant. This often doesn’t happen in the real world, where sampling clock signals generally have at least a small amount of jitter. The Nyquist-Shannon theorem tells you the effective analog bandwidth of a digital scope by defining Fmax as below Fs/2. So with a DSO sampling at 200MSa/s, Fmax will be just below 100MHz. But remember that this limit is (a) theoretical and assumes no clock jitter and (b) applies to all frequency components in the signal to be measured. Digital scope makers often play safe by quoting a figure of Fs/2.5 for the effective analog bandwidth of their instrument. But even this figure is really only relevant for practical measurement of sinewave signals. When you want to examine square waves or other signals with a high harmonic content, it’s best to assume that the effective bandwidth is nearer Fs/10. For example, you really need a digital scope sampling at 1GSa/s to examine complex signals at frequencies up to 100MHz. And conversely, a USB scope sampling at 200MSa/s has an effective analog bandwidth of around 20MHz for complex signals. ware doesn’t have any of the problems of the DSO-2250 mentioned above. It also has a larger choice of nine bin sizes (from 128 - 32,768), plus those 50 different window functions. The DSO and spectrum displays can also be shown either separately on screen or both together (one above the other). But there does seem to be a lot of aliasing spurs on the spectrum display, as shown in Fig.9. Extra functions In addition to its DSO and FFT/ Signal Analyser functions, the DSO2820R provides a signal generator function of sorts. This makes use of the same internal circuit used to generate 78 Silicon Chip the 1kHz square-wave probe compensation adjust signal, available via the small terminal lug on the DSO-2820R’s front panel. The signal generator is limited to providing a digital or single bit output – essentially either a square wave or a maximal length sequence (MLS), and with a fixed amplitude of roughly 3.3Vp-p. However, it can be programmed in terms of frequency, via the DAC Device Setting dialog (accessed via the Setting -> DAC Device menu options). This dialog allows you to set the generator to any frequency defined by the expression 25MHz/N, where N is any integer between 1 and 25,000. You don’t have to work the divisor out for yourself though; you simply type in the frequency you want and the MI software gives you the closest frequency it can produce. Clearly it can’t provide any frequency below 1kHz, because this is the lowest frequency available (and just happens to be the default frequency used for adjusting probe compensation). But it is capable of providing 25,000 discrete frequencies, with good resolution down at the low end but gradually becoming poorer as you move up. At 10kHz the resolution is only about 4Hz for example, while at 100kHz it has risen to about 400Hz. Still, this could be useful in some applications. The Link MSO-19.2 also provides a number of extras, including the 8-bit logic analyser with 100MHz bandwidth, SPI and I2C decoders, an 8-bit pattern generator and a pulse-type TDR. The latter again seems to be based on the internal probe compensation pulse generator, as its output emerges from the same BNC output connector. So all you need for pulse-type TDR measurements is a short BNC-BNC cable, a BNC T-adaptor and possibly a coaxial series adaptor or two (for when you want to check cables fitted with connectors other than BNC). Note that when used as a TDR, the MSO-19.2 by itself can only be used to check 50Ω cables. On the plus side, it can convert delay times into distances along the cable providing you select the cable VOP (velocity of propagation). TDR comparisons While we’re on the subject of TDR, we did try out each of the three scopes with our own Step-type TDR Dongle as described in the December 2014 issue of SILICON CHIP. The results were interesting. The DSO2250 could display the Step-type TDR waveforms quite nicely but proved to be somewhat counterintuitive when it came to using its vertical cursors to measure the delay time between the start of the step and any reflection of interest. Since there is no real user manual and only a very sketchy online help file, we had to work out how to do it for ourselves. But once we had done so it did give quite useful results. With the Virtins DSO-2820R, there siliconchip.com.au Useful Links www.hantek.com/en/ www.hantek.in/en/ http://geoffg.net www.virtins.com www.multi-instrument.com www.linkinstruments.com http://shop1.usbdso.com is no facility for moving the trigger point in from the lefthand side of the display (ie, no pre-trigger display). This makes it difficult to be sure that you are measuring from the start of the TDR step. That aside, it proved reasonably easy to make most TDR timing measurements. Although the MSO-19.2 does have its own pulse TDR generator built in, we found that it too would work with our Step TDR Dongle. Not only that, it would still convert reflection delay times into distances along the cable – providing you set the software into its TDR mode and select the appropriate VOP. However, the MSO-19.2 input has a maximum full-scale vertical range of 4V (±2V), so it can’t display the full step waveform output of the TDR Dongle when there’s either no cable connected or the cable has an opencircuit somewhere. The trace simply flies up to the top of the display and stays there. Fig.8: the FFT display when the Link MSO-19.2 was being used to examine a 48MHz 0dBm sinewave signal with sampling at 200MSa/s (real time sampling). Fig.9: the FFT spectrum displayed by the Virtins 2820R (with the MI3.4 software) when checking a 20MHz +13dBm sinewave signal. Note the relatively high harmonic peaks at 40, 60 and 80MHz (possibly due to front-end overload) and the spurs at 10MHz, 30MHz and so on – probably caused by aliasing. And the winner is? That’s not easy to answer because all three devices have their strengths and weaknesses. If you mainly want a 2-channel scope with the highest possible bandwidth, the Virtins DSO2820R would probably be the winner. If you want the highest possible bandwidth but only need a single scope channel, the Link MSO-19.2 would be your best bet. Things get a bit more confusing if you’re really looking for the most versatile FFT/Spectrum Analyser function. Here you’d probably want to go with the Virtins DSO-2820R and its MI software with nine bin sizes and choice of 50 window functions. But the Hantek and Link devices and their software are really not all that far behind when it comes to many practical applications. Finally, if you only need a single siliconchip.com.au Fig.10: here the MSO-19.2 was being used with our Step-TDR Dongle, to examine an 18m-long cable terminated in 25 ohms. In its TDR mode, the MSO-19.2 can even work out the cable distance corresponding to a reflection delay time. channel scope but would also like the added features of an 8-bit 200MSa/s logic analyser, a 1023x8-bit 100MSa/s pattern generator and a pulse-type TDR, then go for the Link Instruments SC MSO-19.2. February 2015 79