1
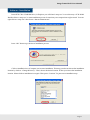
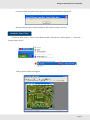
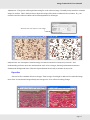
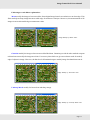
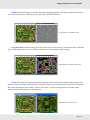
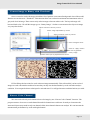
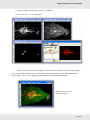
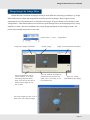
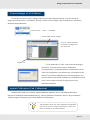
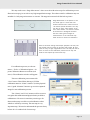
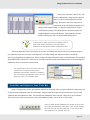
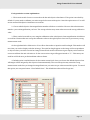
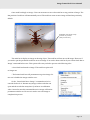
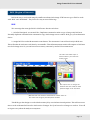
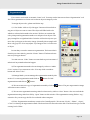
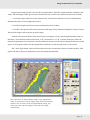
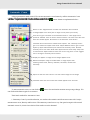
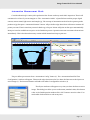
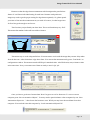
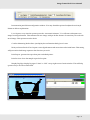
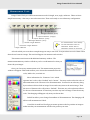
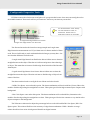
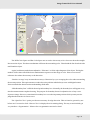
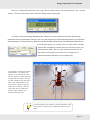
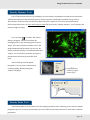
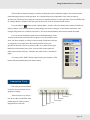
Image Frame Work User Manual Contents Software Installation........................................................................................ 3 Analysis Start Now .......................................................................................... 4 Walkthrough the Image Frame Work............................................................... 5 Obtain Image to IFW ....................................................................................... 9 Image Enhance ............................................................................................... 10 Convert to Gray Scale Image ........................................................................ 15 Convert Image to Binary with Threshold ....................................................... 16 Extract Color Channel .................................................................................... 16 Merge Color Channel with “Color Composite” ............................................. 17 Merge Images by Image Mixer ..................................................................... 19 Convert Images to AVI (Movie).................................................................... 20 Spatial Calibration (Unit Calibration) ........................................................... 20 Scale Bar and Objective Lens Tools Bar ....................................................... 22 Analysis Assist Tools ..................................................................................... 26 ROI (Region of Interest) ............................................................................... 27 Segmentation .................................................................................................. 29 Automatic Count ............................................................................................ 31 Measure Calculator ........................................................................................ 33 Pass/Fail Test ................................................................................................. 34 Measurement Tools ........................................................................................ 40 Configurable Properties Tools ........................................................................ 41 Manual Tag .................................................................................................... 44 Density Measure Tool .................................................................................... 45 Density Ratio Tool ......................................................................................... 45 Annotation Tools ............................................................................................ 46 Interesting Function ....................................................................................... 47 Image Print .................................................................................................... 48 Image Frame Wrok User Manual Software Installation Insert IFW CD to CD-ROM Drive, in Explorer you will found “setup.exe” in root directory of CD-ROM. Doulbe click on “setup.exe” to start installation process. In case that your computer has a right control. You can right click on “setup.exe” then choose “Run as administrator”. Press “OK” button to go the less of installation process. Click on installation icon (Computer icon) to start installation. This step you also can choose the installation location by click on “Change Directory”. Then, choose the desire location. If after you choose the installation location. Please click on installation icon again. Then press “Continue” for pass to next installation step. Page 3 Image Frame Wrok User Manual You may see below window dialog appear to inform about installation completed. These are all processes for SIA installation. The software ready to use now. Analysis Start Now To start the IFW, click on “Start” menu (Windows XP). Then choose “All Programs” -> “Tarosoft” -> “Image Frame Work”. IFW program window will appear. Page 4 Image Frame Wrok User Manual Walkthrough the Image Frame Work IFW has a easy and easy interface which design for every level skill level of user. Most of all command use mouse and toolbar to measure and analyse the images. All toolbar icon has a very good intuitive design to let the user easy to understand by only see the icon. Please see below for each button function. “File Open” command which accept BMP, JPG, TIF, PNG, GIF, AVI “Save As” button which accept BMP, JPG, TIF, PNG, GIF Image Aquisition Twain source acquisition Full screen live display which suitable for classroom or presentation. Report Print Report Print Preview Copy Object Page 5 Image Frame Wrok User Manual Paste Object to selected image “Navigation Window” which locate where we working on the zoomed image. “Magnification Window” which display higher magnification of mouse location. Assign “Region of Interest” to restrict the area you want to measure. Assign “Mask Region of Interest” to restrict the measure area by free form shape. “Color Segmentation” the tool to choose color in the image for auto measurement. Automatic Object Count “Measure Calculator” the tool for store the statistic measurement of each measured images. Then we can use this tool to do mathmatic between each result of images. Spatial Calibration tool Object Select tool Zoom tool Point to Point Measurement tool Page 6 Image Frame Wrok User Manual Rectangle Area Measurement tool Ellipse Area Measurement tool Polyline Measurement tool Polygon Measurement tool Angle Measurement tool Auto Edge Detection tool (Outter) Auto Edge Detection tool (Inner) Horizontal Vernier Vertical Vernier Manual Tag tool (Manual Object Count) Density Measurement tool Density Ratio Measurement tool Page 7 Image Frame Wrok User Manual Text Annotation tool Arrow Annotation tool Line Annotation tool Box Annotation tool Ellipse Annotation tool Multi-Line Annotation tool Polygon Annotation tool Overlay Scale Display tool Microcsope Objective Magnification Selection tool Page 8 Image Frame Wrok User Manual Obtain Image to IFW We have many way to obtain images in the IFW. 1. Open exist image file which currently store in our computer. Click on File->Open... as shown below. The open file dialog will display to let you choose the image file to analys in IFW. Following standard file extension can be use in IFW e.g. BMP, JPG, TIF, PNG, GIF, AVI We can double click on workspace background to open images as same as menu can do. 2. Image Aquisition by Digital Camera The Tarosoft Image Frame Work software support all model of The Imaging Source Digital Camera. You just only install the driver come with IFW. The camera will ready for you to capture the image from microscope or any image produce instruments. (IFW also support WDM compliant. Please contact Tarosoft for more information.) We can select the way to get the image into IFW. The alternative choice can be still image, time lapse capture or movie capture. The time lapse interval can be re-config. You also made predefine the location for captured images. While movie capture can select any codec which available on your computer. IFW also support full screen live image mode which suitable for any presentation or classroom. The capture functions also available for this mode. Image Acquisition Button Twain Source Full Screen Preview Page 9 Image Frame Wrok User Manual Image Enhance In case that the image not proper to analyze, we can enhance with many functions in IFW. Please see below for all commands. Histogram Display brightness level of each channel in chart form. Please be informed that their has no any indentity to tell us for good or bad image. Normally, the everage one could display as mountain form. However, we could only interesting and concentrate on the tone which we need to deal with. This tool design for get the information from image. No any modification to original image. Gray Scale Display RGB Chart Display R or G or B Chart Display Background Style Brightness/Contrast One of useful tool for image enhancement is Brightness/Contrast Adjustment. Brightness adjust the intensity value for all channels. While Contrast push bright level to more brighter, push dark to darker. Gamma work like Contrast but this function will try to maintain medium tone as much as it can. Dark Cut-Off will try to hide the low level of brightness which have a major meaning like noise. This function very useful when we work with fluorescence Image. T-Brightness is the brightness adjust which use the final result from others command then make it brighter. This function also work well with fluorescence image. Once we get the suitable Brightness/Contrast value. You can check the check box name “Remember Last Brightness value between -100 to 100 Contrast value between 0 to 10 Contrast value between 0 to 10 Dark Cut-Off value between 0 to 128 T-Brightness value between 0 to 255 Page 10 Image Frame Wrok User Manual Adjustment”. This option will keep the last setting for work with next image. Normally many users have a similar image for analyze. This is the best idea to adjust the image which need to enhance before measure. So, your research outcome will more stable with no bias adjustment for all images. Save the last use value for next image The adjustment purpose sometime it’s no need to get the best image looking by our eyes. In the image analysis basis. We will adjust or enhance image for easiest to measure or analyze by software. This understnading will save more time and man hour work. Above images, the image enhancement meant to eliminate the background items. Then the objects (human axon) ready to measure by any tools. Equalize This tool will re-calculate all tone in images. Then average from bright to dark tone for make the image more clear. In case that the image already has average tone. You will see not thing change. Page 11 Image Frame Wrok User Manual Invert This is will reverse all color in image to opposite brightness value. It will change from bright to dark or from dark to bright. The result will look like x-ray image. The purpose of this function for sometime we can’t see something clear while it be at the normal state. Then we invert the color in image, we see more clear detail of interesting objects. Filter In the image analysis software, filter mean the calculation method to change the image in term of enhancement or in term of convolution. This means some filters adjust the only visual of image. Some filters change the physical of objects in image. The purpose for process the image to ready to analyze at most possible. Page 12 Image Frame Wrok User Manual Following are each filters explanation:Mean modify the image to have more blur. Some digital image has a low resolution or un clear edge. This filter can help un sharp image has more stable edge for measure or analyze. Moreover, the measurement of all images in series also stable edge measurement value. Image Modify by Mean Filter Gaussian modify the image to become more blur like Mean. Gaussian provide the other method compare to Mean but can modify the image more blur. User can try that which one give more better result for modify edge of objects in image. However, the blur level of Gaussian design to modify image less than Mean can do. Image Modify by Gaussian filter Unsharp Mark modify for better clear and sharp image. Image Modify by Unsharp Mask filter Page 13 Image Frame Wrok User Manual Emboss modify the image to look like 3D image with highlite-shadow. This filter will replace all normal area to become gray color while change the edge to be colorful with shadow. Image Modify by Emboss filter Edge Detection modify the image by focus on only edge of each object by colorized the edge. This filter give us with a edge contour. So, we can have easiest way to work with pure edge in image. Image Modify by Edge Detect filter Erode will modify the image by increase the black portion of objects in the image while decrease white portion of objects in image at the same time. This filter good to remove small particle or dust float in the image. We can use this function with “Dilate” then we call “Open” to remove small particle in the image while maintain objects in the image to be the same size. Image Modify by Erode filter Page 14 Image Frame Wrok User Manual Dilate will modify image by increase white portion of objects in image while decrease black portion of objects in image at the same time. If we use dilate with “Erode” we call “Close”. This combination of filter will eliminate small particle or dust from image while maintain object size for measurement. Image Modify by Dilate filter Convert to Gray Scale Image For quantitative measurement, color in image not much have meaning. Most of researcher choose to work with monochrome camera to measure density on interesting area. Human eyes hard to measure the difference density level if each object has a difference color. So that we can measure density by gray scale image. We can use “Convert to Gray Scale” function for this job. Convert to Gray Scale working on only color image. This function will disable when the gray scale image activated. Page 15 Image Frame Wrok User Manual Convert Image to Binary with Threshold Once we need to work with image which has a lot of particle or un wanted background. One of the useful function we can choose is “Threshold”. This function allow use to select the minimum and maximum value of gray scale level in image. Then convert only value in range to become white color. The beyond range will become black color. We call this image type is “Binary Image”. So that we can measure the objects in image very easy then before. Adjust minimum value by mouse Whole range adjustable by mouse Adjust maximum value by mouse Tone Histogram Chart Click on “Apply” button to start to generate binary image Direct value input by keyboard also can do. IFW will keep the last value for work with next image automatically. This will useful if you have a lot of images to work with similar condition. In case that you may lost the last number by work with other analyze condition. You can put the direct value input for min and max. You will get the same condition back as you wish. Extract Color Channel We can work with only each channel from color image by use “Extract Color Channel” function. The purpose meant to let us see on each channel that which channel can work better for analyze. Sometime the interested objects may stand in only one channel while other channel obstruct our analyze. We can increase the measurement performance by work with right channel. Page 16 Image Frame Wrok User Manual To extract color channel from color image. Choose menu Image-> Extract Color Channel. Then select the channel you need to extract or choose “All Channels” for all channel. You can see the example for all channel extract from microscopy fluorescence technique. We can see that each channel of color image contain each dye from each fluorescence probe. Merge Color Channel with “Color Composite” Color Composite is the process which work opposite way compare to “Extract Color Channel”. Nowsday many microscopy fluorescence technique need higher sensitive digital camera. The result need to obtain maximum signal from specimen. Then keep the result by use monochrome digital camera. The monochrome digital camera give much more higher sensitivity compare to color digital camera (when compare with same level of specifications). To prove many experiment, researcher need to merge each channel to observe the locallization of each channel. Image Frame Work also can do this job with following step:Choose -> Tools -> Color Composite... Page 17 Image Frame Wrok User Manual 1. Open all images which need to mix (2 – 4 images) 2. Choose Tools -> Color Composite 3. When Color Composite window appear. Please follow the number on above sample image. No 1 for select the window name. No 2 for select the color channel. No 3 for add color channel to buffer image. Then No 4 for apply the buffer image to real mixed channel image. Mixed Channel fromColor Composite function Page 18 Image Frame Wrok User Manual Merge Images by Image Mixer Researcher can correlation the images which get from difference microscopy technique e.g. image taken from Phase-Contrast and image taken from Fluorescence technique. Then to approve some experment for sure. Research need to overlay these two images. IFW provide the tool to do this job call “Image Mixer”. This function allow use to select two opened images file to do the superimpose by vareity method of overlay. Also user can balance the overlay image transparent of each image by slider. The perfect mixed image can produce in a second. Choose menu -> Tools -> Image Mixer... Image from Obligue technique Preview Image Image from Fluorescence technique User can select one from 5 mixed methods. This option can change anytime before apply. So that user can have a perfect mixed image by trial one of them. User can balance the weight of transparent level by move the slider. This is very easy to use but powerful tool. Apply your setting (New Window after Apply) The mixed image still have a lot of detail from both original images. Page 19 Image Frame Wrok User Manual Convert Images to AVI (Movie) In case that you have a series of images taken by time lapse capture function. You can encode all images into one movie by “AVI Maker” function. It’s have a very simple 3 step to make movie. Please see the below image illustrated. Choose menu -> Tools -> AVI Maker... 1. Select folder contain images. 2. Press “Create AVI Now” to encode all images into one movie file. Images List 3. You must select “Codec” before encode all images into movie. You may need to choose “Full Frame (Uncompressed)” to maintain quality of each frame in movie. That is very important if you meant to use it for analyze in the future. If you want to make the movie for other purpose. You may use others codec which available on your machine. Please refer to movie player software for play the movie by difference computer. Spatial Calibration (Unit Calibration) Image Frame Work come with the spatial calibration capability. So we can calibrate all tools in software to understand world standard units e.g. micron, milimeter, centimeter, inch etc. The process start with user capture the image by use current hardware configuration. The calibration value from other difference configuration may not use with our current measurement. That’s can cause a mistake in all measurements. Page 20 Image Frame Wrok User Manual We may need to use “Stage Micrometer” when we work with microscope for calibration process. Since microscope give us with a very high magnification range. The others scale for calibration may not suitable for. Only stage micrometer we can use. The stage micrometer look like below picture. Stage Micrometer in the picture is one axis scale type. It’s come with one hundred vertical lines. Each line has a 10 microns spatial distance. You may see the on glass slide printed “0.01 mm” which means 10 microns. Please be noted that in biological research. One axis scale good enought for measurement. In the industrial may need at least 2 axises for calibration. Once we observe through microscope eyepiece. We may see the vertical lines as shown in left hand side image. By FOV (field of view) of high magnification lens. We may not see all lines its have. So the calibration process will do only the scale we can capture by current FOV only. For calibration process, we choose menu -> Tools ->Calibration Options... Or press Calibration Button on tools bar (red arrow). The calibration window will appear. The new calibration process start with “New” button. Then follow this step 1) Fill the calibration name in “Name” textbox. 2) select physical unit. 3) push “Measure” button to go to active captured image for next calibration process. The “Name” and “Unit” meant to tell everyone to recognize this calibration and physical unit you need to calibration to. However in case that you mis-typo for these textbox may not effect to real calibration value which we will do by next step. The next step is very important step. We need to understand the process cleary before do it. Let take a look for next step. Page 21 Image Frame Wrok User Manual After press “Measure” button. We will see the calibration by image window appear. Also we will see the straight line on active image. We have to move the end point of straight line to fit with the known distance on image. In the sample image, we drag the straight line to equal 5 vertical lines in image. This mean the line represent 50 microns length compare to real world distance. Then input the 50 in the textbox. Then press “OK” to end the calibration process. In case that you have more than one objective lens or zoom-able stereo microscope. You may need to calibration for each objective lens or each zoom ratio. The most important issue to be careful. Every time you change the objective lens on your microscope or you adjust the zoom ratio on stereo zooming body. You must change the calibration value to match the microscope magnification adjustment. If we not select the right calibration value for measurement. The result of all measurements will incorrect. However if you still work with current measurement resul. You can change the calibration value to correct the result as well. The measurement result must meet the world standard unit. To select the correct precalibration name before measure is needed. If you work with wrong calibration value. You may loose your time to re-measure again. Scale Bar and Objective Lens Tools Bar Some of images may need to put scale bar imprint on the image. This very good idea do by draw some line to represent the calibration value for each image. Image Frame Work provide the convenience way to work with scale bar and calibration value. You can map the calibration value with the “Objective Lens Tools Bar”. Then you can just click on tools bar for select the calibration value. Let see how we can do that. Thank to Scale Bar and Objective Lens button to let the user can select the calibration value easier. Also you can display the scale bar with one click. Moreover, it also easy to look what calibration you currently use now. Page 22 Image Frame Wrok User Manual Each particular section explaination:1. This is main switch for use or not use the scale bar and objective lens button. This option is un-check by default. You may need to calibrate your microscope before turn on this option. Once this option turn on. You will see the scal bar and objective lens button on tools bar. 2. Choose which objective lens magnification number will show on tools bar. However this selection must match to your real magnification you have. The wrong selection may cause other user use the wrong calibration value. 3. These combo boxes allow you to map the calibration value with objective lens magnification which show on tools bar. Please make sure to map the calibration value to the right objective lens icon to prevent any wrong measurement result. On the right hand side of this section. You will see the textbox to input the scale bar lenght. This number will use when you need to display scale bar in image. The scale bar length appear on the image will correspondance to objective lens you select on tools bar. Image Frame Work use the real micron sign to display on the scale bar once user calibrate the unit with micron. So the correct micron sign will appear instead of “U”. This mean your scale bar will look more professional than others software. 4. Default option is useful function for the routine research job. Once you choose the default objective lens. All images will be assigned by this objective lens automatically. However this option may cause the wrong measurement result after you change the magnification at your microscope without cancel this option. To cancel this option, user can press button “Clear Default Lens”. The default lens value will no longer use. Page 23 Image Frame Wrok User Manual After you already assigned the value for all objective lens. The value will save into Windows Registry automatically when you close the software. Please be infomed that all calibration value you done on current computer not suitable to work with others microscope configuration. 1) You can assign the scale bar with or without background. The default is “No Background”. This option depend on your image main tone. If you need to separate your scale bar to display clearly. The “With Background” also good choice to work on. 2) This part allow you to assign the color of scale bar. Also the background color in case of “With Background” option choosen. The Line Thickness may need to adjust to more thicker in case that the image have a bigger size. 3) You can set the properties of font to display the length of scale under scale bar. The “Scale Bar Options” need to press “OK” the save the new setting value. If you close this window by close box. The previous value will be used. All assiged value will not use immediately after complete setting. User need to select any calibration value within this window or choose the objective lens button and press the “Show/Hide Scale bar” at the same time. The reason is scale bar need to know the calibration value to draw the bar on image. However once the calibration value choosen. User can show/hide the scale bar at anytime by press scale bar icon button. Show/Hide Scale Bar Objective Lens Selection button Page 24 Image Frame Wrok User Manual Once scale bar disply on image. User can use mouse to move the scale bar to any position of image. The last position of scale bar will automatically saved. The scale bar create on new image will use last position by default. Scale Bar can move to any position by mouse (Only on the bar) The scale bar is display on image as drawing object. The scale bar will not save with image. However if you need to put the permanent scale bar on saved image. You need to burn scale bar by use “Burn Scale Bar to Image” command before save. This option will warn you before process with following info:- Once Scale bar burned to image. This scale bar option will no longer use. - The burned scale bar will permanent merge into image. So user can’t disable the image scale bar ever. So the “Burn Scale Bar to Image” command need to be consider before do it. Because any image with no scale bar can open and show scale bar at anytime if you know its calibration value. Once after use this command the active image will has the permanent scale bar on. However it need to save the image to complete this process. Page 25 Image Frame Wrok User Manual Analysis Assist Tools Image Navigator The tool for display whole image and red rectangle to inform us about the real zoom image displaying on active window. Sometimes you may need to work with high zoom ratio. Then it hard to find other interesting positon. The Image Navigator will help you to locate next interesting position by drag mouse on red rectangle of navigator window instead. The red rectangle show in navigator window mean the current area of active image window. This red frame will change it’s size correspondance to active window zoom area. Magnification Window This tool will work opposite function compare to Image Navigator by give us with more higher zoom ratio. This tool will help you to locate your object boundary in the image more accuracy. You also can adjust the zoom magnification ratio by slider which locate underneath the Magnification window. Mouse Guide Window This tool design for new user who need to not waste their time and memory. Once you work with new software, of-course you need to learn many things. Thank to “Mouse Guide” window for help you more easier to use this software. It’s will tell you tool by tool how to use the mouse to work with them. So you no need to remember how to use it anymore. You will familiar to use this software by no force. Page 26 Image Frame Wrok User Manual ROI (Region of Interest) ROI is the way to work with image by smaller area than whole image. IFW has two type of ROI to work with “ROI” and “ROI Mask”. They have own way to use as following:- ROI We can assign the rectacgle ROI for 2 difference function as below:1. After ROI assigned, we can use Edit->Duplicate command to make a copy of image only ROI area. Normally duplicate command is the command to copy whole image to new window. ROI give you an alternative choice. 2. Assign ROI for work with automatic count feature. The Automatic Count will work only in ROI area. This will make the software work faster by area smaller. Then all measurement result will compare to ROI area not whole image area. So you can have more accuracy outcome by use ROI for measurement. The value can direct input in these textbox if you know the exactly value. This option will re-assign the location and size of ROI on each opened image to be the same. ROI also can use mouse to resize and re-locate. Color of the frame can assign by ROI Properties window. This ROI type also design to work with the routine job by save the last size and position. This will save more time to work with same ROI area for whole series of images. So if you have a lot of images to work on. You will no logner worry about the analyze are anymore. Page 27 Image Frame Wrok User Manual ROI Mask Once you need to work with free shape area to analyze. ROI Mask is one of the useful tool. ROI Mark start with a very simple drawing tool. Our drawing will base on separate layer which be on top of image. It’s will not modify any part of our image. Tool to draw ROI Area Tool to remove ROI Area Mask display method Use or Hide ROI Mask Assign brush size. This brush use for draw and erase tools. Assign the transparent level for “Display Mode” 3rd button Assign line thickness of brush Choose ROI Mask color Once we use ROI Mask to work with “Segmentation” or “Automatic Count” tools. By above image sample. Those tools will work only in green drawing area. Page 28 Image Frame Wrok User Manual Segmentation If we want to work with “Automatic Count” tool. You may need to learn more about “Segmentation” tool first. The segmentation tool is the tool to choose object in image by color. To assign objects color, please read below step 1) Color Picker: click on “Eye Dropper” button tool then click on any part of object we want to count. The object will filled with color which we selected at the mask color section. We have to continue the color pickup until segmentation mask cover all part of our objects. The gray rectangle be on right hand side of window will work only once you move the eye dropper on the active image. Normally this rectangle will show only gray box. You may adjust “Eye Dropper Size” to fit the area of object. In case that you need to start new segmentation. The better idea is clear the previous value by press the “Eraser” button. The button locate next to eye dropper button. You also can use “Undo” button to return back to previous status of selection if any mistake selection happen. 2) The segmentation mask color can change by select on “Mask Color” section. If you want more color. You may click on rainbow button call “More Color”. 3) Manage Mask: you can manage the segmentation mask by this section. To create segmentation mask click on button. To hide segmentation mask click on button. 4) We can create new copy of segmentation mask by click on will create as new window. button. The pure segmentation image 5) We can save segmentation setting value for future use by click on “Save” button. Also we can load the segmentation setting value from file by “Open” button on this window. The segmentation setting file has “.seg” extension. So you can copy the file for work with others computer. 6) Filter: Segmentation mask may contain a lot of small particle. We can use “Erode”, “Dilate”, “Open”, “Close” to clean up the segmentation mask. The kernel size for filter also select able. The kernel size give us like a strong level of filter. Page 29 Image Frame Wrok User Manual Image Frame Work use HSV color model for segmentation. The HSV contain with Hue, Saturation and Value. The advantage of HSV give us more convenience way to select color. Please see below for its detail:1. Use H: this option will bese on color selection only. The function will focus on color while blind how saturation they have or how brightness they have. 2. Use HS: this option will focus on color and saturation level of object. 3. Use HSV: this option will focus the selection on all range of Hue, Saturate, Brightness (Value) of object. Then use this range to select objects on whole image. The Hue color space look like color wheel. It has 0-360 degree of color wheel angle adjustable. Base on this theory. Our selection can choose between “CW” (clockwise) or “CCW” (counter clockwise). That will make the segmentation color selection create the difference object color chooser by change the direction of this option. You can guess which color the segmentation will use by see the drawing circle on color wheel. The “Auto Apply Mask” option will let us save more time. In case that you have a routine research. This option will choose objects on image base on previous setting automatically. The yellow color on above sample image is the segmentation mask. In case that the rest of images have same measurement method. You no need to save the segmentation setting. This option also save the last setting for work with next image automatically. Page 30 Image Frame Wrok User Manual Automatic Count After segmentation mask created. We can use automatic count feature by call the Automatic Count window.ToopenAutomaticCountwindowwecanclickon button. Please see explanation below:- Button ot call “Segmentation” window from Automatic Count window In Range Object color mask (Out of range will not paint by this color) From left ot right: first button for do automatic count. If “Auto Apply Count” option be selected. User no need to click this button. The auto-count will start after this window appear. Next button is the hide auto-count button. Automatic Count come with 2 method count options. The “Summary Count” give us a statistic for object count while “Object Measure Count” give us with object by object measurement plus statistic like summary count. However summary count work much faster than object measure count many many time. In case that the object measure count work for too long time. It’s will suggest user to change to summary count instead. Display all objects in image and In-Range objects count Measure acception range for differentiate in-range objects with following criteria Area, Density, Diameter, Perimeter, PerArea and Circularity Option to force the auto-count to use this criteria range for next image Automatic start auto-count once this window appear at the first time To start automatic count, we can click on can click on this button again to re-measure. button. In case that the measure accept range change. We Their has 2 method for Automatic Count 1. Summary Count: by use this selection, we can have the statistic result from auto-count with 3 major measurement Area, Density and PerArea. The summary count have a very fast speed compair with normal automatic count. So, this is a best choice if the resule cover the demand. Page 31 Image Frame Wrok User Manual On above sample image, the yellow mask area are segmentation mask area. The violet boundary objects are the object which count by automatic count. You may see some objects have no boundary. This means those objects are not in-range of auto-count. All measurement result will have the pixel unit as a default. If we already done the calibration process and choose it. All the result will base on the lastest calibration unit. Only degree and percentage will not effect with the calibration value. 2. Object Measure Count: by use this selection, auto-count will measure object by object for individual following result Area, Density, Diameter, Perimeter, PerArea and Circularity. The summary window also appear for inform user for statistic of measurement. In some complicated shape object, you may face a long time measurement process. The auto-count will show the suggest dialog to let user make a decision to use “Summary Count” instead. Page 32 Image Frame Wrok User Manual Measure Calculator Once you competed for measurement for some amount of images. The idea to sent the measurements data to Excel by DDE function are quite common for general case. However, sometimes you may need to calculate the measurement result. Then use the final result instead. IFW also provide you with “Measure Calculator” to let you calculate each result from images immediately. You can click on button to call “Measure Calculator” as show the window picture below. You may start to use “Measure Calculator” by set first column to have some measurement value from any image. Then “Add Column” for new empty column. You can select combo box on top of column to see what you want to fill in the column’s row. The calculation result will ready for use now. Select the statistic measurement’s of any measured images. Constant also available. Button to edit the operator (See below topic for detail) Send all result Excel Delete last column button Add new column button Select default operator We can assign the operator for each item by select the operator by press “Edit” button which appear on top between image’s measure result. The operator edit window will appear. You may see the option for edit on top of window. The option allow you to apply the selection to the rest of items or the selection will happen only item you do. - Apply All : your edit for only this item will force all items use the same operator. - Only Selected: your edit for this item will effect only this item. Page 33 Image Frame Wrok User Manual Pass/Fail Test The Pass/Fail Test feature allow user to apply IFW to work for industrial job. This feature come with predefine measurement value. Once the measurement do by user, Pass/Fail Test will add the value to its table and calculate the accept range by pre-define value. Then give us the final result for “Pass” or “Fail”. User can click on button. The pass/fail test window will appear. They provide an alternative choice for manual test or autoation test mode. That’ has a difference way to work with this feature. User can select type of measuring by check or un-check the “Automation Mode” which locate on the bottom left of the window. Manual Test Mode Automatic Test Mode Once you need to work with manual test mode. AlMost of all measurement tools can work with this feature. However, the automation mode allow user to use only edge detection tools at this moment. However, its good enough to test many many conditions. Automation Mode is the best way to save time and man power to measure the objects. The pre-define edge detect will measure all lines in one click. Back to normal learning step. User can click on “General Config” button to display the general value setup for this feature as show on the right hand side. This window contain with many setting. The interesting point to take a look is “Restriction”. The restriction will explain more on next page. Page 34 Image Frame Wrok User Manual “Restriction” is the most important setup for pass/fail test feature. Their have 2 choices of definition. “Some Fail = Fail” means all measuring features must be in tolerance range. If even one measurement value goes beyond min or max or percentage. The overall test result will “Fail”. “Som Pass = Pass” means at least one measurement result be in tolerance range. The overall test result will judge as “Pass”. The Display Big Sign option will show the big “Pass” or “Fail” sign on the righ-top of the program window. This can help the user can check the result easier. The most important at the 2nd point which user have to be careful. At the right-top of window. You will see the option box to let the user set for “Restriction Rule” or “Last Measure”. The “Restriction Rule” will work on “Restriction”setup which you can set it at general config dialog. Select this option means the overall result will judge by restriction setup value. If user select “Last Measure” means the overall result will judge by use the last measurement result only. Not all measurement suitable for any option. So, user must select which option suitable to their work. In the middle part of dialog. You will see the “Master Range Setting”. These text box allow user to fill the pre-define standard value for each type of measurement. Also user can set the way to make a calculation for each measurement. Page 35 Image Frame Wrok User Manual At the bottom part of dialog. You will see the I/O Configuration section. The I/O option allow the IFW to trigger external devices such as warning light, horn etc. The trigger also separate between “OK” or “NG” of overall measurement. Please note that this option can’t work without I/O hardware. Please contact Tarosoft for more information. Manual Measurement Mode Now you can use pass/fail test to measure like a routine job.In manual mode, user can use most common measuring tools to work with pass/fail test feature. All tools will act like it be in normal measuring mode. The result of the test can get by two ways. User can “DDE” the result table to Excel. Or, print out as hard copy or pdf by report generator. Note: Vernier and Manual Tage not supports Pass/Fail Test feature. However, it’s still working properly while work under Pass/Fail Test environment. Page 36 Image Frame Wrok User Manual Automation Measurement Mode Consider about the QC routine job in production line. Some work may need 100% inspection. That’s will consume a lot of time if you can imagine to. The “Automation Mode” of pass/fail test need the proper digital camera, camera stand, light source and sample jig. The concept of automation mode is let the operator put the product on jig then press “Automatic Measure” button. All pre-define edge detect lines will start to measure all points you want. Then in case that you need a hard copy of report. Printer will print out the report automatically. Print preview also available as an option. After finish this process. Operation can start to measure the next item immediately. This is the fast and accuracy routine which instand result report print out. The pre-define process start from “Automation Config” button (1). The “Automation Pass/Fail Test Configuration” window will appear. Then use the edge detection tools (2) to draw the lines across the objects on active image (3). The lines information will add to the table of configuration window (4). The Object Attribute will appear every time you draw the lines on active image. This dialog box allow you to set the name, standard value, all tolerance value. After finish input the number click “OK” button to save the value. You can double click on the list to edit as any time. Page 37 Image Frame Wrok User Manual Please note that the edge detect measurement which assign under pass/fail test feature. It’s will save individual setting for each item. Because each position in image may need to get the proper setting for edge detect separately. So, please spend your time to fine tune the measurement as you wish. Of-course, it’s take longer time for first. But good enough to use forever. The first time you just finish your draw lines. The overall result may say “Fail”. This means the standard value still exceed the tolerance. The easiest way to work with pass/fail test. You must start to work with the image that you trust. May taken from the best one. After finish draw edge detect lines. You can test the measurement by press “Test Mode” on configuration window. The measure result will fill up for standard value. Also fill the min, max, tolerance value at the same time. Now your master sets of data are ready to use for QC job. Once you have a good sets of master data. Don’t forget to save it for future use. To save to current computer press “Save Automation Objects”. You may need to pass this data to other computers by use “Save Automation Objects As...” then choose the location to save. While you may have the saved data from other computer. You can load it into this computer by “Load Automation Objects File” Page 38 Image Frame Wrok User Manual In automation pass/fail test configuration window. You may found the options for adjust the work style. Please see below explaination:Live Capture: every time the operator press the “Automatic Measure”. It’s will start with capture new image from digital camera. Then measure the new image with pre-define features. In case that you work with saved image. This option no need to check. Confirm Measuring Before Start: just display the confirmation dialog box for sure. Delay xx Second before First Capture: some digital camera take some time at the initial state. This setting will prevent the dark image capture at the first time you work. Print Report: generate the report then print on default printer. Print Preview: show the sample report before print. Display Big Sign: display big sign of “Pass” or “Fail” on top-right corner of main window. This will help operator easy to see the overall result. Page 39 Image Frame Wrok User Manual Measurement Tools Image Frame Work provide the measurement tools for length, area, angle, radius etc. These tools are simple but accuracy. Also easy to use at the same time. These tools ready to use without any configuration. Radius Measure Angle Measure Polygon Measure (Area) Polyline Measure (Length) Ellipse Measure (Area) Rectangle Measure (Area) All measurements result always Vertical Length Measure use the calibration value for Horizontal Length Measure calculation. Please refer to Length Measure calibration section for the detail. All tools which you see on above sample image are easy to use tools. You just select one tool of them. Then draw the tool on active image. The result will appear via measure result window. The measure result come with additional summary window. The measurement summary window will show you for overall statistic for what you done with your images. Once you choose any measurement tools. The measurement properties window will appear. This window allow you to choose the measurement tools’s color, label color, cross hair etc. More information for “Features Color” which separate into 2 color value “Default” and “Current”. You may need to select the color of all measurement tools. Then use it for all measurement. You need to un-select any thing by use select tool then click on image. Do not select any item on the active image. Then the arrow of features color will point to “Default”. This time, any color selection will use for the rest of measurement. In case that you select any item on image. Then choose any color. The changing will happen only item you choose then. Label Font allow you to change font attibute of all measurement. The changing will affect to all measurement’s label. Cross Hair is useful tool for align you mouse pointer to the far position on image to make sure that your measurement will fit to the position you want. Page 40 Image Frame Wrok User Manual Configurable Properties Tools IFW has some tools to let the user config the tool’s properties before use. Once user can config the tool to the suitable situation. These tools will very convenience. Also save your time as you can feel. Vertical Vernier Horizontal Vernier Length Auto Edge Detect from Center Length Auto Edge Detect from End Point All measurements result always use the calibration value for calculation. Please refer to calibration section for the detail. The first and second tools from above image sample are Length Auto Edge Detection measurement tool. If you learn more for detect method of these tools. The tool will ready to work with similar kind of images you may have. Let see what the difference for both tools. - Length Auto Edge Detect from End Point: this tool allow user to draw the straight line across the object. Then the tool will use end point to detect the edge of object. This mean the tool start to find the edge from both side of the line until found object. - Legnth Auto Edge Detect from Center: this tool allow user to draw the straight line across the object. Then the tool start to find the edge of object from center of the line. The detect method need to config befor use. Please see below detail:- RGB Color Space: once select this option. The detect machanism will work with Red, Green, Blue color model to find the edge along the straight line we draw. This option good for the high contrast object compare with background. - Hue Color Space: once select this option. The detect machnism will work with Hue, Saturation color model to fine the edge along the straight line we draw. This option good for the low contrast or very similar color objects compare to the background. The Tolerance value need to adjust the percentage before work with both RGB Color Space, HS Color Space option. This value will affect to the accuracy of edge detect machanism. While “Bicubic Average” reduce the affect from noise which general found from digital camera. Page 41 Image Frame Wrok User Manual The RGB Color Space and Hue Color Space are no need to choose any color. Once user draw the straight line across the object. The detect machanism will learn the surrounding color. Then shrink the line from both side until found the object. Again, both detect method must adjust the “Tolerance” to fit the edge sharpness of the object. The higher number of this value will tell the detect machanism accept more wider range of color. However too much tolerance also reduce the accuracy to the detection. “Bicubic Average” may increase the accuracy of detection by try to averaging the color value surrounding the current position. This option meant to reduce the noise problem which always come with digital camera. Noise can make the detection miss undersanding all the time. “Hide Boundary Box” will hide the end point boundary box. Normally, the boundary box will appear every time the measurement complete drawing. The purpose for boundary boxes for adjust the size of any vector objects on image. However, sometime the boundary box cover the important position which you may need to judge that the detection is correct or not. The “Specific Color” option provide more accuracy for edge detection. This tool need to get train by use before use. User need to click “Choose Color” to display the color training dialog. The way to use this dialog is very similar to “Segmentation”. Please refer to segmentation section for detail. Page 42 Image Frame Wrok User Manual Refer to “Configurable Properties Tools” page, the rest of the tools are “Horizontal Vernier” and “Vertical Vernier”. Once user select these tools. The below dialog window will appear. You may see the decimal digit adjustment and “DDE Now” button. Please note that the decimal digit adjustment use the round number function. Once you decrease the digit. The last decimal digit may not equal the real measurement. The button before “DDE Now” button is DDE options setting. The DDE option allow user to select the sheet name, row, column, reset. You may start to send the measure data via DDE by reset the value first. Then every time you measure and use DDE. The row value will auto-increase one row. This will prevent the data over-written. Your complete set of measurement data will transfer to Excel with no lost. The example of Horizontal Vernier measurement. The adjust line present as 2 vertical lines. User can use mouse to adjust the lines to equal with the object. You may see the number on the right hand side of the measurement. User also use the mouse to drag the middle part of vernier. That will move both lines for adjust the position while maintain the distance between lines. All measurements result always use the calibration value for calculation. Please refer to calibration section for the detail. Page 43 Image Frame Wrok User Manual Manual Tag Manual Tag is the tool to mark the objects by user. IFW provide two table type for this function. User can click on button to start the manual tag. The result table will show like below sample. The result window display the tagged result as table. You may see 3 buttons Delete Last, Clear All, DDE at the top part of window. We can choose the group or type on result window to start tag first. Then click mouse on the active image to tag. The manual tag allow user can delete tagged item from last tag only. Then delete one by one to avoid any mistake for tagged items. We can double click at row header to call the option for manual tag or click on menu->Tools->Options. The same dialog will appear. User can config the table as single type tag or multi type tag. Multi Type tag design for advance manual tag which allow user can tag up to 7 groups and 5 sub types in one time. User can rename any groups or sub types here. While mouse pointer be on active image. User can right click to select the next type on result table. However user can make a choice between row move or column move at Options dialog. Thank to “Object Percentage” which automatically calculate the percentage between tag value in row and column. This will help user more easier to use the result without re-work agian. The DDE also provide the percentage value to Excel. Page 44 Image Frame Wrok User Manual Density Measure Tool One of Fluorescence Microscopy technique we use nowadays is qualtitative measurement. Researcher will use fluorochrome to tag interesting objects. Then use specific wavelength to push the energy to those fluorochrome. Then the enery released from fluorochrome by light form. (see more information about Fluorescence Microsocpy at www.microscopyu.com) IFW provide the “Density Measure” tool to measure the amount of light on image. User can click on toolbar. The density dialog will appear. Then user can draw the rectangle probe on any interesting point on active image. The result of density measure come with image thumbnail and its statistic. By the way, the density result also display in normal measure result window. So all of density measures are a part of measurement which can process like other tools. This tool also provide the partial histogram. User can click on chart button on density dialog. Density Histogram window will appear. กดปุมนี้เพื่อแสดง ชารตของความเขม แสงของวัตถุนี้ Density Ratio Tool The Density Ratio tool is an idea to solve the sample preparation issue. Althoug you are expert in sample preparation process. You may not trust that your work of this time and next time have a 100% same condition preparation. Page 45 Image Frame Wrok User Manual The best idea to measure density, researcher will put the control within the sample. The control is same chemical thing as they use with specimen. It’s will pass all process, temperature, time, rinse as same as specimen do. Then they use control as a reference for measure density on same specimen. We can call this idea as “Density Ration” measure. IFW also provide the tool to work for specimen with control. User can click on button to call “Density Ratio” window. The new density ratio window look like an empty window. User can drag mouse on interesting point on active image to create density ratio items. The rectagle will present one of density ratio item. User can create the density ration item as much as needed. User can see the measuring result close to thumbnail image. Then we have mean density and ratio value compare to top (first) density ratio item. The first rectangle you draw on active image will be the reference of comparison. User must know the exactly position where your specimen control be. However, please see the “R” symbol on the right hand side of each density ratio item. User can click on the symbol to make it become the reference. Then the ratio value will re- calculation again. You may see the “DDE” button at the bottom part of window. This button will send whole density ratio data to Excel. Annotation Tools IFW also provide annotation tool to let use can add text, arrow, graphics on image. These tools are very easy to use. In case that you familiar with measuring tools. These tools no longer hard to work with. Text Arrow Line Polygon Polyline Ellipse Rectangle Page 46 Image Frame Wrok User Manual Interesting Function IFW also provide few interesting fucntions to let the user have more process for measurement. Merge Vector Layer This function use for merge any measuring objects or annotation into image. May some user need to get the image with measured objects paste into image for use as evident. This function will create new window with merged graphic onto. So user will have non merge and merged for any usage purpose. To use this function click on manu->Image->Merge Vector Layer to Image. Please noted that this function will active only at least one drawing object created on active image. Save Vector, Load Vector User can save all measuring objects into files, including annotations. Also user can load for redarw on any image. Please note that this command not specific the source file. You have to make sure to not load the measuring objects into image which taken by difference magnification (in case of microscope). Otherwise, the measuring result may wrong. Then cause the mistake to your result. Page 47 Image Frame Wrok User Manual Image Print Image Frame Work provide the image print out. User can select the paper size by choose manu->File>Page Setup... The page setup dialog will appear. Then choose the appropreate paper size. We have to choose the paper size that available in printer. However, IFW also retrieve the printer default setup value at the first time we need to print. Then select the paper orientation (Portrait or Landscape). Then assign margin for 4 side of paper. The page setup setting value will save for next time use. User can print out immediately in case that still use the same page setup value. User can print the image by choose menu->File->Image Print... The active image will print out from default printer immediately. User also see the outcome before print by choose menu->File->Image Print Preview... The preview window will appear. User can use “Print” button in the window to print also. Page 48 Rev. 04-2012-01