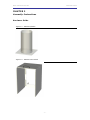
1
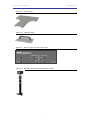
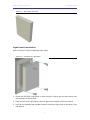
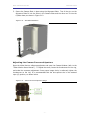
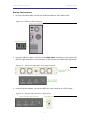
FORCED SWIM SYSTEM
USER’S MANUAL
SOF-842-3 and Forced Swim Hardware User’s Manual
DOC-216
Rev. 1.0
Copyright © 2008
All Rights Reserved
MED Associates, Inc.
P.O. Box 319
St. Albans, Vermont 05478
www.med-associates.com
MED ASSOCIATES INC.
FORCED SWIM
- ii -
MED ASSOCIATES INC.
FORCED SWIM
TABLE OF CONTENTS
Chapter 1 ........................................................................................................... 1
Introduction ..................................................................................................... 1
General Computer Environment........................................................................ 1
Chapter 2 ........................................................................................................... 2
Assembly Instructions ........................................................................................ 2
Hardware Guide ............................................................................................. 2
Light Panel Installation ................................................................................... 4
Installing the Camera Mount............................................................................ 5
Hardware Assembly ........................................................................................ 6
Adjusting the Camera Focus and Aperture ......................................................... 7
Wiring Instructions......................................................................................... 8
Chapter 3 ........................................................................................................... 9
User Interface................................................................................................... 9
Menu Bar ...................................................................................................... 9
File Menu .................................................................................................. 9
Graph Menu............................................................................................. 10
Zoom Menu ............................................................................................. 11
Component Analysis Menu ......................................................................... 11
Help Menu ............................................................................................... 12
Motion Index Graph ..................................................................................... 13
Upper and Lower Thresholds and Time Cursor .............................................. 13
Experiment Data .......................................................................................... 14
Experiment Information ................................................................................ 14
Range Cursors ............................................................................................. 15
Video Display and Playback Controls ............................................................... 16
Chapter 4 ......................................................................................................... 17
Using the Software .......................................................................................... 17
Creating a Motion Data File ........................................................................... 17
Opening a Motion Data (*.fsa) File ................................................................. 18
Zooming in on the Motion Index Graph ........................................................... 19
Analyzing Data ............................................................................................ 20
Saving a Motion Data (*.fsa) File ................................................................... 20
- iii -
MED ASSOCIATES INC.
FORCED SWIM
Chapter 5 ......................................................................................................... 21
Component Analysis......................................................................................... 21
Adding Components ..................................................................................... 21
Editing Components ..................................................................................... 22
Deleting Components ................................................................................... 22
Saving a Component Analysis ........................................................................ 22
Loading a Component Analysis ....................................................................... 22
Running a Component Analysis ...................................................................... 23
Example *.csv File ....................................................................................... 24
Appendix A ....................................................................................................... 25
Software Installation........................................................................................ 25
- iv -
MED ASSOCIATES INC.
FORCED SWIM
CHAPTER 1
Introduction
The Forced Swim Test is a standard means of testing the pharmacological effects of
antidepressants in mice and rats. Dose-dependent effects on immobility are evident using
the Forced Swim Test, and the Med Associates' software provides researchers with a
reliable method of behavioral quantification.
The MED Associates Forced Swim System includes everything needed to conduct this
behavioral assay in rodent species. The primary dependent variable is the amount of time
spent immobile during the experimental session. The software provides an index of
average motion, and data are displayed in real time.
The MED Associates Forced Swim System includes the Video Monitor Plug-In for Forced
Swim as well as the Forced Swim hardware. The Video Monitor Plug-In for Forced Swim
allows the researcher to analyze video recorded using the MED Associates Video Monitor
software.
General Computer Environment
•
•
•
•
•
3.4 GHz Processor
1 GB RAM
Windows TM 2000 SP4, XP or Vista
FireWire Card
FireWire Camera(s)
- 1 -
MED ASSOCIATES INC.
FORCED SWIM
CHAPTER 2
Assembly Instructions
Hardware Guide
Figure 2.1 - ENV-590 Cylinder
Figure 2.2 - ENV-591 Test Cubicle
- 2 -
MED ASSOCIATES INC.
FORCED SWIM
Figure 2.3 - Camera Plate
Figure 2.4 – Alignment Plate
Figure 2.5 - NIR-100 Light Controller Front Panel
Figure 2.6 - ENV-598 Camera Mount and FireWire Camera
- 3 -
MED ASSOCIATES INC.
FORCED SWIM
Figure 2.7 - NIR-100R Light Panel
Light Panel Installation
Refer to Figure 2.8 when completing these steps.
Figure 2.8 - Installing the Light Panel
1. Orient the NIR-100R Light Panel so that the light is facing into the test cubicle and
the connector is facing down.
2. Place the NIR-100R Light Panel inside the groove on the back of the test cubicle.
3. Use the four brackets and included screws to secure the light panel to the back of the
test cubicle.
- 4 -
MED ASSOCIATES INC.
FORCED SWIM
Installing the Camera Mount
Refer to Figure 2.9 when completing these steps.
Figure 2.9 - Installing the Camera Mount
1. Orient the ENV-598 Camera Mount over the pre-drilled holes in the Camera Plate.
2. Secure the ENV-598 Camera Mount in place using the included screws.
3. Thread the camera onto the Camera Mount.
- 5 -
MED ASSOCIATES INC.
FORCED SWIM
Hardware Assembly
1. Place the ENV-590 Cylinder in the desired location for the assembled system, as it is
very difficult to move once it is filled with water.
2. Fill the ENV-590 Cylinder with water.
3. Place the ENV-591 Test Cubicle around the ENV-590 Cylinder, as shown in Figure
2.10.
Figure 2.10 - Cylinder Inside the Enclosure
4. Orient the Camera Plate as shown in Figure 2.11.
Figure 2.11 - Camera Plate Aligned
- 6 -
MED ASSOCIATES INC.
FORCED SWIM
5. Secure the Camera Plate in place using the Alignment Plate. Two of the pins on the
Alignment Plate fit into the holes in the Camera Plate and the other two fit into the
Cylinder base, as shown in Figure 2.12.
Figure 2.12 - Assembled Hardware
Adjusting the Camera Focus and Aperture
Open the Video Monitor software application and open the Camera Window (refer to the
“Video Monitor Users Manual”). To adjust the zoom, loosen the thumbscrew on the ring,
and make the necessary adjustment. Once proper image clarity is achieved, tighten the
thumbscrew on the ring. It is recommended that the lens aperture be in the maximal
open (O) position, as shown below.
Figure 2.13 - Camera Zoom and Aperture Rings
- 7 -
MED ASSOCIATES INC.
FORCED SWIM
Wiring Instructions
1.
Using the FireWire cable, connect the FireWire camera to the FireWire card.
Figure 2.14 - FireWire Cable Connection
2.
Using the NIR-101 cable, connect the To Light Panel connector on the back of the
NIR-100 Light Controller to the connector on the bottom of the NIR-100R Light Panel.
Figure 2.15 - Connect the Light Panel to the Light Controller
3.
Using the power adapter, connect the NIR-100 Light Controller to a GFCI outlet.
Figure 2.16 - Connect Light Controller to GFCI Outlet
- 8 -
MED ASSOCIATES INC.
FORCED SWIM
CHAPTER 3
User Interface
This chapter describes the menus and features of the Forced Swim software application.
Open the Forced Swim software application and the main screen, shown below, will
appear.
Figure 3.1 – Main Screen Labeled
Menu Bar
File Menu
Figure 3.2 - File Menu
Menu Item
Description
For More Info
Open
Open .fsa file
Chapter 4, Opening a Motion Data
(*.fsa) File
Close
Close .fsa file
N/A
Save
Save the .fsa file using the same
File Name and Location
Chapter 4, Saving a Motion Data
(*.fsa) File
- 9 -
MED ASSOCIATES INC.
Menu Item
FORCED SWIM
Description
For More Info
Save As
Save the .fsa file using a different
File Name and/or Location
Chapter 4, Saving a Motion Data
(*.fsa) File
Create Motion Data
Create an .fsa file from a .wmv file
Chapter 4, Creating a Motion Data
Exit
Close the software application
N/A
File
Graph Menu
Figure 3.3 - Graph Menu
Menu Item
Description
For More Info
Time Cursor to
Center
Moves the Time Cursor to the center of the
Motion Index Graph
Chapter 3, Upper and Lower
Thresholds and Time Cursor
Thresholds to
Center
Moves the Threshold Cursors to the center of the
Motion Index Graph
Chapter 3, Upper and Lower
Thresholds and Time Cursor
Show Range
Cursors
Displays the Range Cursors on the Motion Index
Graph
Chapter 3, Upper and Lower
Thresholds and Time Cursor
Range Cursors
to Center
Moves the Range Cursors to the center of the
Motion Index Graph
Chapter 3, Upper and Lower
Thresholds and Time Cursor
Move Cursors
Mouse pointer will move cursors only
Chapter 3, Motion Index Graph
Pan XY
Mouse pointer will pan the motion index graph
and cursors along both the X and Y-axes.
Chapter 3, Motion Index Graph
Pan X
Mouse pointer will pan the motion index graph
and cursors along the X-axis only
Chapter 3, Motion Index Graph
Pan Y
Mouse pointer will pan the motion index graph
and cursors along the Y-axis only
Chapter 3, Motion Index Graph
- 10 -
MED ASSOCIATES INC.
FORCED SWIM
Zoom Menu
Figure 3.4 - Zoom Menu
Menu
Item
Description
Previous
Return to the previous zoom selection
Extents
Automatically zooms so that the motion data fills the graph area
X Extent
Automatically zooms so that all of the x-axis (time) data is visible in the graph area
Y Extent
Automatically zooms so that all of the y-axis (motion) data is visible in the graph
area
Rect XY
Allows the user to click and drag over the desired view area to zoom along both the
X- and Y-axes
X Axis
Only
Allows the user to click and drag over the desired view area to zoom along the X-axis
only
Y Axis
Only
Allows the user to click and drag over the desired view area to zoom along the Y-axis
only
Component Analysis Menu
Figure 3.5 - Component Analysis Menu
Menu Item
Description
Setup
Opens the Component Setup screen
Run Component Analysis
Opens the Component Summary Report screen
- 11 -
For More Info
Chapter 5,
Component
Analysis
Chapter 5, Running a
Component Analysis
MED ASSOCIATES INC.
FORCED SWIM
Help Menu
Figure 3.6 - Help Menu
Menu Item
About
Description
For More Info
Displays the software version and copyright
information
Figure 3.7 - About Screen
- 12 -
Screen shown in Figure 3.7
MED ASSOCIATES INC.
FORCED SWIM
Motion Index Graph
The subject’s behavior is quantified as an index of motion . All movement within the
forced swim chamber is registered by the software as a change in video pixel
composition over time. Therefore, robust and fast movements will be recorded as a large
relative changes in video-pixel composition, and small, refined, and slow-movements will
be registered as somewhat smaller relative changes in pixel composition. During analysis,
movement is represented as a graph (motion index vs. time) in a non-cumulative
manner.
Upper and Lower Thresholds and Time Cursor
The Motion Index Graph also contains Upper and Lower Thresholds and the Time Cursor.
The location of the Upper and Lower Thresholds is user-defined and can be adjusted by
either clicking and dragging the threshold lines to the desired location (be sure that
Move Cursors is selected on the Graph menu) or by entering the motion index values
into the Thresholds Lower and Upper fields on the main screen (Figure 3.1).
The Time Cursor is used to indicate the current place in the video and its location
corresponds to the Time (s) field under the Video Display Window (Figure 3.13). The
video can be advanced or reversed by clicking and dragging the Time Cursor to the
desired location on the Motion Index Graph.
Figure 3.8 - Thresholds and Video Location Indicator Labeled
Figure 3.9 – Time Cursor and Time (s) Correspond
- 13 -
MED ASSOCIATES INC.
FORCED SWIM
Experiment Data
The Experiment Data portion of the Main Screen, shown below, displays the data that
corresponds to the position of the Upper and Lower Thresholds. The Time (s) column
contains the amount of time, in seconds that the motion index was above the Upper
Threshold, between the Upper and Lower thresholds and below the Lower threshold.
The Samples column contains the number of frames that the motion index was above
the Upper Threshold, between the Upper and Lower Thresholds and below the Lower
Threshold. The Sum column contains the sum of the data above the Upper Threshold,
between the Upper and Lower Thresholds and below the Lower Threshold.
Figure 3.10 - Experiment Data
Experiment Information
The Experiment Information portion of the Main Screen, shown below, allows the user to
enter useful information relating to the video file that will be saved with the analysis.
Figure 3.11 - Experiment Information
- 14 -
MED ASSOCIATES INC.
FORCED SWIM
Range Cursors
To obtain data from a specified interval of time within the session, use the Range
Cursors. Enable the Range Cursors by selecting Graph | Show Range Cursors. The
blue range cursors will appear on the Motion Index Graph and the position of the cursors
as well as the time difference (Delta) between the cursors will appear above the
Experiment Data, as shown below.
Adjust the position and length
cursors to the desired position
positions in the Range Cursors 1
will alter the data shown in the
and Figure 3.10).
of the specified interval by clicking and dragging the
in the Motion Index Graph or by entering the desired
and 2 fields. Adjusting the position of the Range Cursors
Experiment Data portion of the Main Screen (Figure 3.1
The figure below shows the Range cursors. Note that when the Range Cursors are
shown, the Experiment Data reflect only the data that exist between the Range Cursors
on the Motion Index Graph.
Figure 3.12 - Range Cursors
- 15 -
MED ASSOCIATES INC.
FORCED SWIM
Video Display and Playback Controls
The Video Display and Playback Controls portion of the main screen is shown below. The
Jump to Beginning, Rewind, Fast Forward and Jump to End buttons will function only
when the video is Paused. If the video is paused, the video can be advanced or reversed
by clicking and dragging the Time Cursor to the desired location on the Motion Index
Graph (see the Upper and Lower Thresholds and Time Cursor section of this
manual).
Figure 3.13 - Video Display and Playback Controls
- 16 -
MED ASSOCIATES INC.
FORCED SWIM
CHAPTER 4
Using the Software
Creating a Motion Data File
The process of creating a motion data file is essentially extracting Motion Index data
from a video file. The motion data file will be saved as an *.fsa file and can be opened
using the Video Monitor Plug-In for Forced Swim.
To create a motion data file open the software application and the Main Screen (Figure
3.1) will appear. Select File | Create Motion Data and the Open screen shown in
Figure 4.1 will appear.
Figure 4.1 – Select *.wmv File
Next select the video (*.wmv) file to analyze and click Open. The Analyzing screen
shown in Figure 4.2 will appear. When this screen disappears an *.fsa file has been
created using the same file name and location as the *.wmv file.
Figure 4.2 – Analyzing Screen with Status Bar
- 17 -
MED ASSOCIATES INC.
FORCED SWIM
Opening a Motion Data (*.fsa) File
Once a motion data (*.fsa) file has been created, it can be opened using the Video
Monitor Plug-In for Forced Swim. From the Main Screen (Figure 3.1) select File | Open.
The screen shown in Figure 4.3 will appear. Select the file to open and click Open. The
Main Screen will appear as shown in Figure 4.4.
Figure 4.3 – Select the Motion Data (*.fsa) File to Open
Figure 4.4 - Open *.fsa File
- 18 -
MED ASSOCIATES INC.
FORCED SWIM
Zooming in on the Motion Index Graph
When a motion data (*.fsa) file is initially opened the Motion Index Graph will be
displayed so that all of the Motion Index data is contained within the Graph Display, as
shown in Figure 4.4. It may be necessary to adjust the zoom to better view the data.
There are several options on the Zoom menu that allow the user to optimize data
viewing. Please refer to Chapter 3, Zoom Menu for definitions of each menu item.
For the example, selecting Zoom | Rect XY allows the user to use the cursor to click
and drag over the area to zoom in on, as shown in Figure 4.5. This will result in the data
being zoomed in on along both the X- and Y-axes, as shown in.
Figure 4.5 – Zoom, Rect XY
Figure 4.6 - Data Zoomed Along X and Y Axes
- 19 -
MED ASSOCIATES INC.
FORCED SWIM
Analyzing Data
With the *.fsa file open and the Motion Index Graph properly zoomed in; place the Upper
and Lower Thresholds in the appropriate locations. If the Range Cursors are being used,
they should be placed in the desired locations on the Motion Index Graph. The data
contained in the Experiment Data portion of the main screen are calculated using the
Threshold and Cursor positions, and are updated each time a Threshold or Cursor is
moved.
Any relevant text may be entered in the Experiment, Subject, Group and Trial fields.
Saving a Motion Data (*.fsa) File
Saving a Motion Data (*.fsa) files will retain the current Threshold and Cursor positions
as well as any text entered in the Experiment, Subject, Group and Trial fields. To save
the Motion Data file using the same file name and location, click File | Save. To save
the Motion Data file using a different file name and/or location, click File | Save As.
- 20 -
MED ASSOCIATES INC.
FORCED SWIM
CHAPTER 5
Component Analysis
One may choose to compare data across different events within a single experimental
session. For example, one may choose to report immobility in one-minute increments
over the course of a session. This can be done using Component Analysis.
Adding Components
To begin, open an *.fsa file, and select Component Analysis | Setup.
The
Component Setup screen shown in Figure 5.1 will appear. To define each component
click on the Add button and the Component screen shown in Figure 5.2 will appear.
Figure 5.1 – Component Setup Screen
Figure 5.2 – Component Screen
Name each component, and enter the Start Time (s) and the Duration (s). The Counts
and Times Above, Between and Below the Thresholds will be calculated for each
component, and the Start Time and Duration of the component determine the parameters
for the calculation. Click OK to add the new component and close the Component
screen, or click Add New to add the new component and keep the Component screen
open. Once the Component screen is closed the Component Setup screen will display
any components that have been added.
- 21 -
MED ASSOCIATES INC.
FORCED SWIM
An example Setup Component screen with several components added is shown in Figure
5.3.
Figure 5.3 – Example Component Setup Screen
Editing Components
To edit the Name, Start Time or Duration of a component, highlight the desire
component and click Edit. The Component screen, shown in Figure 5.2, will appear.
Make the necessary changes and click OK.
Deleting Components
Highlight the desired component and click Delete and the component will be removed
from the Setup Component list.
Saving a Component Analysis
Once all of the necessary components have been added, click Save and enter a file name
and location. The component analysis will be saved as a *.cmp file.
Loading a Component Analysis
To load an existing component analysis (*.cmp) file, click Load and select the file. This
file may now be added to or edited. If any changes are made to this file, click Save to
save the *.cmp file using the same file name and location or click Save As to use a
different file name or location.
- 22 -
MED ASSOCIATES INC.
FORCED SWIM
Running a Component Analysis
To run a component analysis, click Component Analysis | Run Component Analysis.
The Component Summary Report screen, shown in Figure 5.4 will appear. Click on the …
button next to “Component File” and browse to the desired *.cmp file. The click on the
… button next to “Output File”, select the desired output location and enter an Output
File Name. Next enter the Upper and Lower Threshold that should be used to calculate
the Above, Between and Below Threshold Counts and Times. Click OK and the Select
file(s) to report on screen shown in Figure 5.5 will appear.
Figure 5.4 - Component Summary Report Screen
Select the *.fsa file(s) to run the component analysis on and click OK. The screen shown
in Figure 5.6 will appear.
Figure 5.5 – Select File(s) to Report On
- 23 -
MED ASSOCIATES INC.
FORCED SWIM
The component analysis is now complete. The output *.csv file can be viewed using
Microsoft Excel TM . An example Component Analysis *.csv file is shown in Figure 5.7.
Figure 5.6 – Component Analysis Complete
Example *.csv File
The Component Analysis file contains the Counts and Times Below the Lower, Between
and Above the Upper Thresholds for each Component. Any text that was entered in the
Experiment, Subject, Group and Trial fields on the Main Screen will appear in this file, as
well as the Name, Start Time, Duration, Start Frame and Duration Frames for each
Component.
Figure 5.7 - Example Component Analysis File
- 24 -
MED ASSOCIATES INC.
FORCED SWIM
APPENDIX A
Software Installation
Insert the Forced Swim CD into the CD-ROM drive and the screen shown in Figure A.1
will appear.
Figure A.1 - Forced Swim Main Screen
Click Install Forced Swim and the screen shown in Figure A.2 will appear.
Figure A.2 – Click Install to Begin
- 25 -
MED ASSOCIATES INC.
FORCED SWIM
The Customer Information screen, shown below will appear next. Enter the desired User
Name and Company Name as well as the Password that was issued by MED Associates
when the software was registered. Click Next to continue.
Figure A.3 – Customer Information Screen
The Choose Destination Location screen, shown below appears next.
Verify the
Destination Folder. If this folder is acceptable, click Next to continue. If it is not, click
Browse… and browse to the desired folder.
Figure A.4 – Choose Destination Location Screen
- 26 -
MED ASSOCIATES INC.
FORCED SWIM
The Ready to Install the Program screen, shown below will appear next. Click Install to
begin installation.
Figure A.5 – Ready to Install the Program Screen
The software installation is now complete. Click Finish to close this screen.
Figure A.6 – Installation Complete
- 27 -