1
3.2.1. Measurements
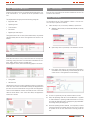
From this menu there is access to both the measurements of the
equipment and to some graphics of itself. The information is divided
in two sections, ‘Measurements’, which shows the information in
a tabular way:
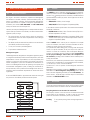
In the bottom right corner of the screen there are some buttons as
shortcuts to the screens ‘Measurements’, ‘Parameters and Management’, ‘KWh’ and ‘Time scheduler’ of the unit:
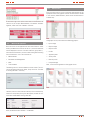
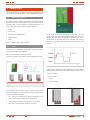
And graphic section, which shows the following graphics:
3.2.Menus of the application
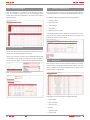
Once the access to the application of the Control Center is established, provided that the user has access to it, in the left side there
will be displayed a new set of screens under the group ‘Iluest+’,
which from this one there is access to all the setting and monitoring
forms of the Iluest+ units. Those screens are:
• Input voltage
• Output voltage
• Output current
• Cos Phi
• Apparent power
• Measurements
• Active power
• Parameters and Management
• Reactive power
• KWh
• Load percentage
• Time scheduler
Next, it is shown the appearance of the graphic forms:
The filtering area is a common element in all the screens. The consult can be done by filtering by ‘Client’, ‘Group’ and ‘Unit’. This filter
is showing the Iluest+ units only.
Likewise, there is an area with the summary of the consulted unit,
where it is shown Client, Group, Unit description, last date of communication and IP address among other data.
Next, the different menus of Iluest+ are detailed:
SALICRU
7