1
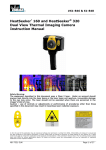
Spot Analyzer TiVi80
User Manual
User Manual 3.2
Version 3.2
October 2013
PIONEERS IN TISSUE VIABILITY IMAGING
TiVi80 Spot Analyzer
Dear Valued Customer!
Welcome to the WheelsBridge Spot Analyzer TiVi80 system designed for automatic analysis of
spatial and temporal variations in spot appearance. The Spot Analyzer TiVi80 was designed
especially for observer-independent analysis of changes spot erythema in association with
evaluation of skin care products and follow up of treatment regimes.
The Spot Analyzer TiVi80 utilizes a highly sensitive digital camera equipped with polarization
filters making it possible to suppress direct surface reflections from the skin surface. The
versatile system software – based on the MATLAB® high performance language for technical
computing – allows for rapid and easy capturing and analysis of images. Among the many
useful features of the Spot Analyzer TiVi80 software the following are particularly helpful in
the evaluation of spatial or temporal variations in spot erythema:
?
Automatic capturing of photos.
?
Zoom-in features to display details of image by clicking on the actual spot.
?
Automatic batch calculation of TiVi values from photos.
?
Automatic generation of spot intensity and extension.
?
Project window displays the overall results of a test panel trial.
?
All data can be exported to ASCII-format spread sheets.
We are convinced that the Spot Analyzer TiVi80 will be a productive tool in the assessment
and follow-up of spot appearance following treatment with skin care products.
Thank you for choosing the WheelsBridge Spot Analyzer TiVi80.
WheelsBridge AB
Spot Analyzer TiVi80 3.2
Sida 1
TiVi80 Spot Analyzer
Information in this document is subject to change without notice and does not represent a
commitment on the part of WheelsBridge AB. No part of this manual may be reproduced or
transmitted in any form or by any means, electronically or mechanically, including
photocopying and recording, for any purpose without the written permission of WheelsBridge
AB.
Any use of application of WheelsBridge products must be performed by properly trained and
qualified personnel. WheelsBridge AB takes no responsibility for action taken on the basis of
information derived from the use of the product described in this manual or from
consequential damages in connection with furnishing, performance or use of this manual.
Licensee’s limited rights are governed by the license agreement between WheelsBridge AB
and MathWorks. Licensee may not modify or remove any license agreement file
(MarthWorks or third party) that is included with the MCR Libraries (“MCR Library
License”). Licensee of this Application accepts the terms of the MCR Library License.
The Spot Analyzer is patented and/or patents are pending in several countries.
WheelsBridge is a registered trade mark.
Spot Analyzer TiVi80 3.2
Sida 2
TiVi80 Spot Analyzer
1. INTRODUCTION
Facial spots including acne appear most frequently during puberty with a varying degree of
severity. About 90% of the adolescent population is believed to be affected by this skin
disease. Numerous cosmetic products are commercially available for treatment of spots and
new and more effective products are continuously released on the market.
To evaluate the performance of these skin care products, the product candidates are generally
tested using a panel of volunteers with spots of varying severity. The result is assessed by
naked eye observation at which both the intensity and the extension of the spot erythema are
evaluated. These evaluations are generally performed by a skilful dermatologist and a severity
score from one to five may be used to quantify the findings. Because of the unavoidable userdependent element of these naked eye inspection procedures, results may vary among
observers and inter-laboratory comparison of data may be difficult to perform.
The Spot Analyzer TiVi80 - based on photos captured with a polarization spectroscopy
camera that generates colour-coded images of the red blood cell concentration in the skin –
streamlines the analysis process and delivers user-independent results regarding both spot
intensity and extension.
The intended use of the Spot Analyzer TiVi80 is to map erythema in spots in research and
laboratory applications. It is not yet approved for the diagnosis and treatment of disease.
2. OPEARATING PRINCIPLE
The Spot Analyzer TiVi80 operates in the following way:
1. A sequence of photos of the same skin site is captured at different points in time.
2. This sequence of photos is uploaded to the Spot Analyzer TiVi80 main window.
3.
Specific spot are brought into focus by clicking on them using the mouse.
4. The corresponding TiVi-images (RBC concentration maps) are displayed.
5. The intensity and extension of the erythema around the spots in focus are
automatically calculated and displayed in the Chart window.
6. Up to 20 separate spot sequences from the Chart windows can be exported to and
displayed in the Project window which displays the complete results of a test panel
trial.
In the GETTING STARTED section these features are further explained by way of an
example
Spot Analyzer TiVi80 3.2
Sida 3
TiVi80 Spot Analyzer
3. GETTING STARTED
The basic features of the Spot Analyzer TiVi80 are probably best explained by way of an
example. In the following example it is assumed that the photos Day-0001.jpg to Day0004.jpg have been captured and stored in the TiVi80demonstration folder. These photos
demonstrate the initial four days healing process of experimental wounds made by a lancet on
the volar side of the forearm. The task is to analyze the intensity and extension of the
erythema associated with these wounds in the initial wound healing phase.
1. Open the Spot Analyzer TiVi80 main window.
2. Click the Load-button, navigate to the TiVi80demonstration folder. Double-click the
Day-0001.jpg icon to load a sequence of photos. The Spot Analyzer TiVi80 main
window should now look like:
Spot Analyzer TiVi80 3.2
Sida 4
TiVi80 Spot Analyzer
3. The four photos in the sequence are now uploaded demonstrating the initial healing
process of an experimental wound.
4. Adjust the X-Scale and Y-Scale sliders until the values in the associated edit-boxes
read 10. When the mouse is moved over a photo a rectangular white box is displayed.
Move the mouse pointer to point at the center of the left wound spot in Photo 1.
Spot Analyzer TiVi80 3.2
Sida 5
TiVi80 Spot Analyzer
5. Click the left mouse button. Photo 1 will now zoom-in and display the wound at the
center of the zoomed-in photo.
Spot Analyzer TiVi80 3.2
Sida 6
TiVi80 Spot Analyzer
6. Place the mouse pointer over the same spot in Photo 2 and repeat the procedure.
Repeat this procedure for all four photos. The Spot Analyzer TiVi80 main window
should now look like:
7. To display the TiVi-images corresponding to the zoomed-in photos click the Show
TiVi button. The sequence of TiVi-images demonstrate how the erythema intensity
and extension both are reduced as the wound heals (from day one to day four).
Spot Analyzer TiVi80 3.2
Sida 7
TiVi80 Spot Analyzer
8. Click the Automatic-button to calculate the intensity and area of the four individual
TiVi-images. The TiVi80 Chart window is now displayed showing the Mean
Intensity of the Erythema.
Spot Analyzer TiVi80 3.2
Sida 8
TiVi80 Spot Analyzer
9. Select Both and check the Standard Deviation check-box to display the Erythema
stacked on the Background TiVi-values together with the associated standard
deviations.
10. Click the Area button to display the area bar sequence.
Spot Analyzer TiVi80 3.2
Sida 9
TiVi80 Spot Analyzer
11. Select Save Chart from the File pull-down menu. Navigate to the TiVidemonstration
folder and print MyFirst in the Filename edit box. Click the Save button. The TiVi80
Chart data will now be saved under the name MyFirst_SA.mat (SA stands for Spot
Analyzer TiVi80). Click the Close-button to close the TiVi80 Chart window. The
TiVi80 Chart window can be opened again by clicking the Open Chart item in the
File pull-down menu in the Spot Analyzer TiVi80 main window. The data in the
TiVi80 Chart window can also be loaded into the Project window (together with the
results from other Charts).
12. Click the New Proj item in the File pull-down menu in the Spot Analyzer TiVi80 main
window to open a new Project window.
13. Click Load Object to load a new object into Project. Navigate to the
TiVi80demonstration folder and double click the W1_SA file icon to load the first
object into Project. The TiVi80 Project window should now look like:
Spot Analyzer TiVi80 3.2
Sida 10
TiVi80 Spot Analyzer
14. To load five more objects into Project, again click the Load Object button. When the
Pick a file window opens press the key-board Ctr-button while at the same time
clicking the MyFirst_SA , W3_SA, W4_SA , WA5_SA and WA6_SA file icons. The
Pick a file window should now look like:
Spot Analyzer TiVi80 3.2
Sida 11
TiVi80 Spot Analyzer
15. Click the Open button to load the selected files.
16. Check the Standard Deviation check-box to display the Standard Deviations .
Spot Analyzer TiVi80 3.2
Sida 12
TiVi80 Spot Analyzer
17. Click the Measurement radio-button to display the results with the number of
measurements in each TiVi-image sequence along the independent axis.
18. Click the brown panel in front of the W6.mat text to permanently remove this file from
the Project. The TiVi80 Project window should now look like:
Spot Analyzer TiVi80 3.2
Sida 13
TiVi80 Spot Analyzer
19. Check the 3D radio-button to display the results in 3D mode.
20. Place the mouse pointer in the center of the diagram. The shape of the pointer now
changes to circular. Press the left mouse button and move the mouse. The view angle
of the 3D display now changes.
21. Click the Area radio-button to display areas in 3D.
Spot Analyzer TiVi80 3.2
Sida 14
TiVi80 Spot Analyzer
22. Select Export Data in the File pull-down menu to save data in an Excel file. Print the
file name in the File Name text edit box and press the Save button.
This completes the GETTING STARTED section.
Spot Analyzer TiVi80 3.2
Sida 15
TiVi80 Spot Analyzer
4. DETIALED DESCRIPTION
4.1 Spot Analyzer TiVi80 main window
When the Spot Analyzer TiVi80 is started in tool-box mode from inside the TiVi700
Analyzer, no photos are loaded.
In the Spot Analyzer TiVi80 window below the photo sequence A-0001.jpg – A-00026.jpg
has been uploaded by clicking the Load button and then double-clicking the file icon A0001.jpg in the MNA folder.
Each photo is displayed in a separate sub-photo panel. The name and capturing date as well as
the size of the actual photo/TiVi-image and whether in zoom-in (Z-In) or zoom-out (Z-Out)
mode are displayed below each photo.
1. Load – used for loading a new sequence of photos into the system. The first six
photos in a sequence are automatically uploaded.
2. Show TiVi – used for displaying the corresponding TiVi images instead of the photos
after ROIs have been drawn..
Spot Analyzer TiVi80 3.2
Sida 16
TiVi80 Spot Analyzer
3. Click the same button (now labeled Show Photos) to again display the photos.
4. Click the Reset All button to again display the original photos.
5. Place the mouse pointer over a specific photo. A white box , the dimensions of which
are determined by the Set ROI Size panel edit boxes and sliders, now appears over the
photo and follows the mouse pointer as the mouse is moved over the photos (without
pressing the mouse buttons).
6. Move the X-Scale and Y-Scale sliders until the associated edit boxes read 25 and 15
respectively. These settings determine the size of the white ROI-box (as percentage of
full scale). The settings can also be altered by printing the numbers directly in the edit
boxes. Moving the mouse over the photo in photo-panel Photo 4 should now display
like:
Spot Analyzer TiVi80 3.2
Sida 17
TiVi80 Spot Analyzer
7. When the mouse is positioned over the center of the bottom left erythema patch in
Photo 4, click the left mouse button. A zoomed-in photo is displayed with the center
corresponding to the mouse pointer position and the size corresponding to the white
box settings. At the same time the size indicators change to the size of the photo
displayed while the zoom indicator displays Z-In.
Spot Analyzer TiVi80 3.2
Sida 18
TiVi80 Spot Analyzer
8. To return to the original photo place the mouse pointer somewhere inside the actual
photo and click the left mouse button.
9. Successively point to the center of the lower left erythema patch in all photos and click
the left mouse button to place all photos in zoom-in mode. The Spot Analyzer TiVi80
main window should now look like:
Spot Analyzer TiVi80 3.2
Sida 19
TiVi80 Spot Analyzer
10. Click the Show TiVi button to display the TiVi images corresponding to the selected
regions of interest in the photos.
11. Color Span – use these settings to change the color scale of the TiVi-images
displayed. In this particular case set the Color Span to 400. The Spot Analyzer TiVi80
main window should now look like:
Spot Analyzer TiVi80 3.2
Sida 20
TiVi80 Spot Analyzer
12. Side View – click this radio-button to display the TiVi-images in 45 degree side view.
13. Top View – click this radio-button to bring the system back to top view display mode.
Spot Analyzer TiVi80 3.2
Sida 21
TiVi80 Spot Analyzer
14. If high TiVi-value areas not belonging to the reaction of interest appear in the TiViimage, these can be eliminated by placing the mouse pointer at the point in the TiViimage to be erased. Press the left mouse button and move the mouse. The erased areas
are displayed in gray colour and in the further analysis treated as background by the
system (i.e. not accounted for in the intensity and area calculations). Position the
mouse pointer on the red spot in Photo 4, press the left mouse button and move the
mouse to start erasing a selected area in the TiVi-image. The Spot Analyzer TiVi80
main window should now look like:
15. To remove the erase section, click the Reset TiVi radio-button under the actual TiViimage.
16. Erase Size – use this pull-down menu setting to determine the size of the erase area (1
= small area, 5 = large area). The actual size of the erase area is influenced also by the
size of the TiVi-image.
17. Reset All – to reset the system and again display the originally loaded photo sequence.
18. Automatic – clicking this button automatically calculates the intensity and area of the
displayed TiVi80 images with threshold values as set in the TiVi Settings window
and generates the TiVi80 Chart to display the results.
19. Manual On – clicking this button opens the Manual Steps panel with buttons that
takes the user to the different steps towards calculating the intensity and area and to
displaying the results in the TiVi80 Chart.
Spot Analyzer TiVi80 3.2
Sida 22
TiVi80 Spot Analyzer
20. Click Calculate Bg to display the areas in each TiVi-image used as background
(normal skin TiVi-value). Threshold settings from the TiVi80 Settings window.
Spot Analyzer TiVi80 3.2
Sida 23
TiVi80 Spot Analyzer
21. Click Calculate Max to display the areas in each TiVi-image representing maximal
values. Threshold settings from the TiVi80 Settings window.
22. Click Calculate Threshold to display the areas in each TiVi-image representing
values above threshold. Threshold settings from the TiVi80 Settings window.
Spot Analyzer TiVi80 3.2
Sida 24
TiVi80 Spot Analyzer
23. Click Intensity & Area to calculate the intensity and area with associated standard
deviations for each TiVi80-image.
24. Click Generate Chart to display the TiVi80 Chart with information about intensity
and area for each TiVi-image.
25. When the system displays TiVi-images the actual TiVi-value at the mouse pointer is
displayed in the upper right corner of the TiVi80 Spot Analyzer TiVi80 main window.
4.1.1 TiVi-80 Spot Analyzer TiVi80 main window pull-down menus
1. File – Open Chart – to open an existing TiVi80 Chart window.
2. File – Open Project – to open an existing TiVi80 Project window.
3. File – New Project – to open a new TiVi80 Project window.
4. File – Close – to close the Spot Analyzer TiVi80 main window.
5. Settings – displays the TiVi80 Settings window (see below).
6. Manual – the Spot Analyzer TiVi80 on-line manual.
7. About –Spot Analyzer TiVi80 About window.
Spot Analyzer TiVi80 3.2
Sida 25
TiVi80 Spot Analyzer
The TiVi80 Settings window allows the User to set several TiVi80 parameters. These
parameters are stored and saved in between sessions.
1. X-Scale slider and edit box – to set the width of the ROI box (percentage of photo
width). Also updates the corresponding controls in the Spot Analyzer TiVi80 main
page.
2. Y-Scale slider and edit box – to set the height of the ROI box (percentage of photo
height). Also updates the corresponding controls in the Spot Analyzer TiVi80 main
page.
3. Background fraction – sets the lowest fraction of the TiVi80 image as background
(normal skin TiVi-values).
4. Maximum fraction – sets the fraction over above which the TiVi-values are used to
calculate the maximum value.
5. Treshold fraction – fraction value used as threshold for calculation of area extension.
6. Intensity fraction – fraction above which values are included for calculation of the
erythema intensity.
Spot Analyzer TiVi80 3.2
Sida 26
TiVi80 Spot Analyzer
4.2 TiVi80 Chart window
The TiVi80 Chart window displays the mean or median intensity and the area of up to six
TiVi-images.
1. Mean Intensity - to display the mean intensity calculated.
2. Median Intensity – to display the median intensity calculated. To be used instead of
mean intensity if single outlier values are present.
Spot Analyzer TiVi80 3.2
Sida 27
TiVi80 Spot Analyzer
3. Area – to display the extension of the erythema area.
4. Erythema – to display the erythema superimposed on the background (normal skin
TiVi-value) alone.
5. Background – to display the background (normal skin TiVi-value) alone.
6. Both – to display the erythema value stacked on top of background (see Fig. above).
7. Standard Deviation – check to display the standard deviation bars.
8. Close – to close the TiVi80 Chart window.
4.1.2 TiVi-80 Chart window pull-down menus
1. Save Chart – to save the Chart.
2. Close – to close the TiVi80 Chart window.
3. Export Data – to export the calculated data as ASCII code to an Excel spread sheet.
The following data sets are saved: Mean Intensity, Median Intensity, Mean
Background, Median Background, Standard Deviation for Intensity, Standard
Deviation for Background and Area.
4.
4.2
TiVi80 Project window
In the TiVi80 Project window the results from up to twenty different Chart calculations are
uploaded and displayed. The TiVi80 Project window typically displays the overall result of a
full test panel session.
Spot Analyzer TiVi80 3.2
Sida 28
TiVi80 Spot Analyzer
1. Mean Intensity - to display the mean intensities calculated.
2. Median Intensity – to display the median intensities calculated. To be used instead of
mean intensity if single outlier values are present.
3. Area – to display the extension of the erythema areas.
4. Erythema – to display the erythema superimposed on the background (normal skin
TiVi-value) alone.
5. Background – to display the background (normal skin TiVi-values) alone.
6. File Number – sorts the results after file number (session) along the x-axes.
7. Measurement – sorts the result after measurement number along the x-axes.
8. 2D – Displays the result as two-dimensional bar graphs.
9. 3D - Displays the result as three-dimensional bar graphs.
10. Standard Deviation – check to display standard deviation bars.
11. Clear all – click to clear the display.
12. Load Object – to load and display a new object.
Spot Analyzer TiVi80 3.2
Sida 29
TiVi80 Spot Analyzer
13. File Number – Displays the names of the files uploaded and displayed. Clicking the
brown panel in front of the name permanently removes the associated file from the
Project.
4.3.1 TiVi80 Project window pull-down menus
1. Save Project – to save the TiVi80 Project.
2. Close – to close the TiVi80 Project window.
3. Export Data – to export the calculated data as ASCII code to an Excel spread sheet.
Two-dimensional data for files and measurement number are saved in the following
sheets: Mean Intensity, Median Intensity, Mean Background, Median Background,
Standard Deviation for Intensity, Standard Deviation for Background and Area.
Spot Analyzer TiVi80 3.2
Sida 30