1
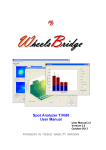
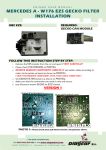
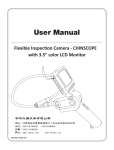
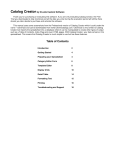
Stubble Analyzer TiVi104
User Manual
PIONEERS IN TISSUE VIABILITY IMAGING
User Manual 1.1
Version 1.1
March 2013
TiVi104 Stubble Analyzer Dear Valued Customer!
Welcome to the WheelsBridge TiVi104 Stubble Analyzer system intended for automatic and
user-independent analysis of skin irritation and stubble elements characteristics in
association with development of shaving products such as razors, electric shavers and skin
care products in general.
The WheelsBridge TiVi104 Stubble Analyzer utilizes a highly sensitive digital camera
equipped with a microscope adapter with polarization filters making it possible to suppress
surface reflections from the skin. The versatile system software – based on the MATLAB®
high performance language for technical computing – allows for rapid and easy capturing
and analysis of images. Among the many useful features of the TiVi104 Stubble Analyzer
software the following are of particular interest:
•
Automatic capturing of photos.
•
Lateral resolution approximately 5 micro-meters per pixel.
•
Parallel analysis of two photos (before –after or left-right side analysis).
•
Quantifies skin irritation by recording local erythema maps.
•
Automatically identifies small objects (by colour), by pointing on a representative
stubble element using the mouse.
•
Removal of small elements (noise) is possible.
•
Generates statistical measures of stubble element data such as area, length and
thickness.
•
All data can be exported to ASCII-format spread sheets.
•
Integrated Report Generator facilitates print out of main results.
We are convinced that the TiVi104 Stubble Analyzer will be a productive tool in the validation
process in development of razors, electric shavers and skin care products in general.
Thank you for choosing the WheelsBridge TiVi104 Stubble Analyzer.
WheelsBridge AB
TiVi104 Stubble Analyzer Sida 1 TiVi104 Stubble Analyzer Information in this document is subject to change without notice and does not represent a
commitment on the part of WheelsBridge AB. No part of this manual may be reproduced or
transmitted in any form or by any means, electronically or mechanically, including
photocopying and recording, for any purpose without the written permission of WheelsBridge
AB.
Any use of application of WheelsBridge products must be performed by properly trained and
qualified personnel. WheelsBridge AB takes no responsibility for action taken on the basis of
information derived from the use of the product described in this manual or from
consequential damages in connection with furnishing, performance or use of this manual.
Licensee’s limited rights are governed by the license agreement between WheelsBridge AB
and MathWorks. Licensee may not modify or remove any license agreement file
(MarthWorks or third party) that is included with the MCR Libraries (“MCR Library
License”). Licensee of this Application accepts the terms of the MCR Library License.
WheelsBridge is a registered trade mark.
TiVi104 Stubble Analyzer Sida 2 TiVi104 Stubble Analyzer 1. INTRODUCTION
In the development of skin care products including razors and electric shavers, product testing
needs to be done with respect to effectiveness and safety. This testing procedure is best done
in human skin using user-independent and non-invasive techniques. The TiVi104 Stubble
Analyzer makes it possible to automatically record stubble element characteristics such as
area, length and thickness and to quantify local skin irritation by use of erythema maps. High
resolution photos are captured by use of a TiVi-camera equipped with the TiVi microscope
adapter including zoom-in magnifying lenses, a ring of light emitting diodes for illumination
of the skin surface and polarization filters operating in cross- or co-polarization mode. Two
photos (representing before and after photos or active and control side photos) can
simultaneously be analyzed in the TiVi104 Stubble Analyzer toolbox. The analysis delivers
statistical measures of small object (stubble elements) area, length and thickness as well as
erythema maps of the actual skin sites revealing possible skin irritation. All results can be
exported to an Excel spread-sheet for further analysis or be directly transferred to a printable
Report.
The intended use of the TiVi104 Stubble Analyzer is to analyse stubble and other small
elements of different shapes and colour in experimental and research applications as well as
potential skin irritation caused by different procedures and skin care products. It is not yet
approved for the diagnosis and treatment of disease.
2. OPERATING PRINCIPLE
After uploading one or two photos to the TiVi104 Stubble Analyzer toolbox the user can zoom
in on a skin area of interest. By clicking on a stubble element with the mouse pointer, the
Principal Colour of the stubble element is automatically recorded and all objects of the same
colour or adjacent colours are displayed. The colour space (comprised of various colours
adjacent to the Principal Colour) can be expanded or diminished, and objects too small to be
of interest can be removed from the object map created. The different objects of this map
represent the different stubble elements and their areas, lengths, thicknesses and perimeters
are automatically determined by the toolbox software. Using the object map to block out areas
in the TiVi-image, a map of the red blood cell concentration of the skin surrounding the
stubble elements can be generated and displayed demonstrating possible skin irritation. The
parameter setting of one photo/image (Principal Colour of objects of interest, colour space
and threshold size for removal of small objects) can be applied to the other photo/image
displayed, thereby making possible the comparison of stubble characteristics and skin
irritation under identical conditions in the two photos /images.
After transferring the basic data to the TiVi 104 Chart window, statistical distributions for
stubble area, length, thickness as well as for the red blood cell concentration can be displayed
from which average values of these parameters are calculated. Eventually the derived
parameters can be exported to an Excel document or printed out from a Report generated in
the TiVi104 Stubble Analyzer toolbox.
TiVi104 Stubble Analyzer Sida 3 TiVi104 Stubble Analyzer 3. GETTING STARTED
The basic features of the TiVi104 Stubble Analyzer are probably best explained by way of an
example. In the following example it is assumed that the photos D2no_shave-0001.jpg and
D2after_shave-0001.jpg have been captured by a TiVi camera system and stored in the
TiVi104 demonstration folder. These photos display a recently shaved cheek and a cheek not
shaved for 48 hours.
1. Open the TiVi104 Stubble Analyzer toolbox from the Toolbox pull-down menu in the
TiVi700 Analyzer window.
2. Click the Load Photo button in the Control 1 panel and navigate to the TiVi104
demonstration folder and select the D2no_shave-0001.jpg.
TiVi104 Stubble Analyzer Sida 4 TiVi104 Stubble Analyzer 3. Click the Load Photo button in the Control 2 panel and navigate to the TiVi104
demonstration folder and select the D2after_shave-0001.jpg.
4. Move the Zoom In 1 slider upwards until the associated edit box reads 75.
TiVi104 Stubble Analyzer Sida 5 TiVi104 Stubble Analyzer 5. Place the mouse pointer inside photo 1, press the left mouse button and drag the mouse
to a new position to move the zoomed -in photo1 until some representative stubble
elements are displayed. The position of the zoomed in area in photo 1 is indicated by
the blue frame in the small version of the entire photo1 in the upper right corner of the
Photo1 panel.
6. Use the mouse to click in the centre of the darkest stubble element to record its
Principal Colour.
TiVi104 Stubble Analyzer Sida 6 TiVi104 Stubble Analyzer 7. Stubble elements with colours within the selected colour space are now displayed in
colour superimposed on a grayscale version of the photo. Print “25” in the Zoom In 1
edit box to zoom out the actual photo displayed in the Photo1 panel.
8. Click the Mask radio-button in the Control 1 panel to display the mask generated.
TiVi104 Stubble Analyzer Sida 7 TiVi104 Stubble Analyzer 9. The Mask is now displayed in the Photo 1 panel photo container. Obviously some of
the objects are not entirely filled out because the colour space (number of adjacent
colours around the principal colour) is too small. Expand the colour space by moving
the Expand Colour slider until the associated edit box reads 30 (or just insert “30” in
the edit box).
TiVi104 Stubble Analyzer Sida 8 TiVi104 Stubble Analyzer 10. Remove objects too small to be stubble elements by dragging the Remove Small
Objects slider until the associated edit box reads 500.
11. Setting the sliders Remove Small Objects and Expand Colour (or printing numbers
in the associated edit boxes) is an iterative process and different values may be tested
until the object mask is distinct and the small non-stubble objects deleted. Further,
picking the most representative Principal Colour by pointing with the mouse at a
representative point in a stubble element may also be subject to iterative selections.
12. Click the Mixed radio-button to display the selected objects against a gray-scale
representation of the photo.
TiVi104 Stubble Analyzer Sida 9 TiVi104 Stubble Analyzer 13. Click the TiVi-Image radio-button to display the erythema map of the actual skin
region.
14. Set the Color Span pull-down menu to 300 to attain a better colour representation of
the erythema map. Note that the objects defined by the mask are blocked in The TiVi
Image.
TiVi104 Stubble Analyzer Sida 10 TiVi104 Stubble Analyzer 15. Move the Lower Limit slider in the Photo 1 panel until the associated edit box reads
“80” (or insert “80” directly in the edit box) to display only the 20% highest TiVivalues representing areas of possible skin irritation.
16. Again click the Mixed radio-button in the Control 1 panel to display the mixed photo.
TiVi104 Stubble Analyzer Sida 11 TiVi104 Stubble Analyzer 17. In order to compare the stubble elements characteristics in the two photos, click the
Synch 2Æ1button. The Remove Small Objects and the Expand Colour slider in the
Control 2 panel are now both set to equal the corresponding values in Control 1 panel,
while at the same time the Principal Colour values are made equal. The Zoom In 1
slider and Zoom In 2 slider can now be moved to expand or reduce the size of the skin
areas investigated. Set both sliders to display 30 in the associated toolboxes. The
number of objects in each zoomed-in photo is now 24 and 7 respectively as indicated
by the Number of Objects text line.
TiVi104 Stubble Analyzer Sida 12 TiVi104 Stubble Analyzer 18. Click the TiVi Image radio-buttons and set the Color Spans to 300 to make a
comparison of the 20% highest TiVi-values (erythema level) in the two images. Note
that the erythema level is considerably higher in the photo captured immediately after
shave as compared to the no-shave image.
19. Click the Show Diagram button to open the TiVi104 Diagram window showing the
statistical distributions for stubble area, length, width and perimeter as well as the
distribution for the TiVi-values.
TiVi104 Stubble Analyzer Sida 13 TiVi104 Stubble Analyzer 20. In the Control 1 and Control 2 panels the average values of the parameters with
standard deviations are displayed. Note for instance that the average length of the
stubble elements are 137 (pixels) in the D2no_shave-0001 photo as compared to 62 in
the D2after_shave-0001 photo, while the average TiVi-values are 190 and 217 TiVi
units respectively.
21. In the Histogram 2 panel select TiVi-values in the Histogram Type pull-down menu
and set the number of bins to 100. The lower limit threshold setting of 80 implies that
no values below 200 TiVi-units are displayed.
22. Click the Report button to generate a printable Report.
TiVi104 Stubble Analyzer Sida 14 TiVi104 Stubble Analyzer 23. Click Print to open the Print preview Page.
TiVi104 Stubble Analyzer Sida 15 TiVi104 Stubble Analyzer 24. Click the Auto radio-button to place the content in the centre of the page. Click the
Line/Text page and insert “My First Report” in the Header Text edit box then select
dd-mmm-yyy HH:MM:SS from the Date Style pull-down menu. Finally click the
Print button to print out the report.
TiVi104 Stubble Analyzer Sida 16 TiVi104 Stubble Analyzer 25. This completes the GETTING STARTED section.
TiVi104 Stubble Analyzer Sida 17 TiVi104 Stubble Analyzer 4. DETAILED DESCRIPTION
The TiVi104 Stubble Analyzer main window
Photo Panels
1. The display area hosts the photo, mixed photo, mask or TiVi-Image depending on the
setting of the radio-buttons.
2. The Principal Colour is displayed in the upper right corner of the Photo panel.
3. Clicking at a point in the photo, absorbes and accepts the colour at this point as the
Principle colour. Colours adjacent to the Principal Colour form the colour space on
which the mask is built.
4. Moving the mouse pointer – with the mouse buttom pressed – while pointing
somewhere in the photo, moves the zoomed-in photo over the original photo surface.
The position of the zoomed-in photo in the original photo is indicated by the blue
frame in the original photo displayed in the upper right corner of the Photo panel.
5. When the TiVi-image radion-button is checked, the TiVi Colour Scale is displayed
in the photo panel. The average TiVi-value of the zoomed-in photo is displayed just
below the original photo, while the local TiVi-value at the point at which the mouse
pointer is pointing to is displayed just above the TiVi Colour Scale.
TiVi104 Stubble Analyzer Sida 18 TiVi104 Stubble Analyzer 6. When any of the Photo, Mixed or Mask radio-button is checked, the Zoom In slider
and its associated toolbox are displayed.
7. Zoom In slider – to zoom in or zoom out the actual photo.
8. Zoom In edit box -– to zoom in or zoom out the actual photo.
9. The filename of the photo is displayed in the Photo panel lower left corner.
10. The size of the zoomed-in photo is displayed to the right of the filename.
Control Panels
1. Remove Small Objects slider and edit box – to remove small objects from the actual
mask.
2. Expand Colour slider and edit box – to expand or diminish the colour space around
the Principal Colour.
3. Load Photo button – to reset the system and load a new photo.
4. Colour Span menu - to set the colour span for the TiVi-image.
5. Number of Objects text-string displays the number of objects in the zoomed-in photo.
6. Photo radio-button - to display the zoomed-in photo.
7. TiVi Image radio-button - to disply the zoomed-in TiVi image.
8. Mask radio-button – to display the mask.
9. Mixed radio-button – to display the mixed photo.
10. Upper Limit slider and edit box – to set and display the upper limit threshold for
TiVi-image displayed.
11. Lower Limit slider and edit box – to set and display the lower limit threshold limit for
the TiVi-image displayed.
Lower Panel
1. Clear All button - to clear all displays and edit boxes and reset the system.
2. Load Parameters – to load system parameters saved to file.
TiVi104 Stubble Analyzer Sida 19 TiVi104 Stubble Analyzer 3. Save Parameters – to save system parameters to file.
4. Synch 1Æ2 – to set the system parameters of Photo 1 identical to those of Photo 2.
5. Synch 2Æ1 – to set the system parameters of Photo 2 identical to those of Photo 1.
6. Show Diagram – to open the TiVi104 Diagram window.
7. Close – to close the TiVi 104 Stubble Analyzer window.
Menus
1. TiVi Pre-Processor pull-down menu – to open the TiVi Pre-Processor window.
2. Manual pull-down menu – to display the on-line TiVi104 Stubble Analyzer manual.
3. About pull-down menu – about TiVi104 Stubble Analyzer.
4. Demo Assistant pull-down menu – interactive demo assistant for the TiVi104 Stubble
Analyzer.
The TiVi104 Diagram window
TiVi104 Stubble Analyzer Sida 20 TiVi104 Stubble Analyzer Histogram Panels
1. The display area shows a histogram of object area, width, length, perimeter or TiVivalue depending on the selection made in the Histogram Type menu.
2. The Principal Colour is displayed in the upper right corner of the Histogram panel.
3. The filename is displayed in the lower left corner of the Histogram panel.
4. Histogram Type menu – to select the type of histogram to be displayed.
5. No of Bins edit box – to set the number of bins in the histogram displayed.
Control Panels
Settings Panels
Displays paremeter settings including size of original photo, size of actual (zoomed-in)
photo, Upper limit value, Lower limit value, Expand Colour value and Remove Small
Objects value.
Results Panels
Displays average values with standard deviations of number of objects, object area, TiVivalue, object length, object width and object perimeter.
Lower Panel
1. Export Data button – to export results to an Excel spread-sheet.
2. Report button - to open a printable Report.
3. Close button - to close the TiVi104 Diagram window.
TiVi104 Stubble Analyzer Sida 21 TiVi104 Stubble Analyzer The TiVi104 Report window
Settings Panels
Displays parameter settings including size of original photo, size of actual (zoomed-in)
photo, Upper limit value, Lower limit value, Expand Colour value and Remove Small
Objects value.
Results Panels
Displays average values with standard deviations of number of objects, object area, TiVivalue, object length, object width and object perimeter.
Print
Opens the Print Preview window in which the text can be centred on the page (Auto
radio- button), Headings and Date added (Line/Text page) and the Report printed out
(Print).
TiVi104 Stubble Analyzer Sida 22