1
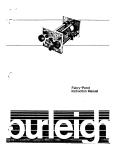
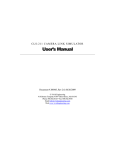
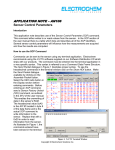
Scanning Tunneling Microscope
Background
Get a general book on the operation of the STM. There is tons of stuff available on the
web also. Review the user manual for the Burleigh STM.
Suggested experiments
1. Prepare a fresh graphite surface by the tape peel method. Bring the STM tip into
contact with the surface of the graphite as discussed in the Burleigh reference
manual. Before you take an image, try to determine the relationship between
tunneling current and piezo voltage, or displacement. We assume that zdisplacement is proportional to the piezo voltage to first order. Measure the
change in piezo voltage due to a step change in the tunneling current. You may
find it convenient to use Labview to measure this accurately. Note the large drift
in piezo voltage for long times (>1s). Do you see the expected dependence based
on quantum mechanical tunneling? How do you think the data acquisition
software copes with this large drift when acquiring an image?
2. Look at the graphite surface and measure the various atomic spacings. Determine
the crystal structure. Compare “constant height” versus current modes. Try
different bias voltages. Does the STM image all of the expected atoms? Why or
why not? Is the STM calibrate in the x and y directions based on the known
lattice constants of graphite? If not, try to determine calibration factors.
3. Using the calibration factors determined in the previous experiments, determine
the lattice constant and crystal structure of MoS2.
4. Look at a sample of freshly deposited gold or a freshly etched semiconductor.
(optional)
Analysis:
Use the following open source program to analyze your data: Gwyddion
(Avialable at http://gwyddion.net/ )
Using Gwyddion you can generate spatial Fourier transforms of your STM image files.
Explain which FFT features relate to actual features on the surface and which represent
artifacts.
Are the extra atoms of MoS2 observable in the FFTs? Can you extract the lattice
parameter(s) better from the FFT?
Can you explain all of the FFT components, including the origin of the spurious
components?
Questions:
It is tempting to think that constant height mode works by keeping the piezovoltage
constant and monitoring the current. This is not how it works in practice. How does it
actually work?
References (available at www.sfu.ca/simonw/p431)
Curson et al Eur. J. Phys 1999
Hembacher et al PNAS 2003
Physics 431 2008-1 Watkins
Park et al. J. Phys. Chem
Wiemer et al Phys. Rev. B 1988
Appendix :
STM analysis software
The Burleigh STM stores data in special “.img” file format.
This can now be read by several freeware analysis programs.
One example is a product called “gwyddion”
(http://gwyddion.net/features.php)
This program enables the user to view STM files, perform linescans and other analysis, as
well as quantitative 2-d Fourier transforms of STM images. Examples are shown below:
Below: STM image for graphite obtained by PHYS431 student:
Physics 431 2008-1 Watkins
Below: Linescan taken from the above image:
Physics 431 2008-1 Watkins
Below: 2-d Fourier transform of the above STM image. The dots show the expected
peaks for a triangular lattice. The vertical lines are due to scanning artifacts inherent in
any scanning probe measurement.
Physics 431 2008-1 Watkins