1
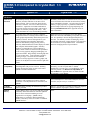
@RISK 5.0 Compared to Crystal Ball® 7.3
Overview
@RISK 5.0
Crystal Ball® 7.3
All @RISK probability distribution functions, statistics
functions, and other functions are in native Excel
function format. They are treated by Excel like any
other Excel function. You can see them in the Excel
formula bar. Arguments can include mathematical
expressions and cell references/ranges, which can be
typed in or entered by clicking in the cell(s). This
means maximum ease of use and modeling flexibility.
Probability distributions are external to Excel, may not be
viewed in formula bar with other Excel functions, and may
not be embedded in formulas. Cell referencing is limited,
and they require proprietary Crystal Ball commands to
perform simple tasks such as copying and pasting cells.
Interface
Up-to-date Office 2007-style interface completely
integrated with Excel. Floating callout windows with
results graphs and probability distributions point to the
cells they reference. Browse through cells in your
model containing input probability distribution
functions and results by simply pressing Tab key.
Summary Model and Results windows display all model
data complete with thumbnail graphs. Summary
windows are linked directly to the spreadsheet so
changes made in them are reflected in the spreadsheet.
Create overlay graphs by dragging and dropping one
graph onto another. Drag and drop Tornado graph bars
to create Scatter Plots. Create Summary graphs by
pointing to ranges. Off-sheet and off-workbook
references are fully supported. Features, graphs, and
options can be adjusted via context-sensitive right-click
menus.
Numerous nested or overlapping out-of-date dialogs.
Difficult to determine which dialog corresponds with which
cell. No capability to browse through assumptions or
forecasts. No summary windows for managing various
Crystal Ball components. Right-clicking is only supported
in CB windows, not in spreadsheet itself. No Windows
menu for managing dozens of open windows.
Backward
Compatibility
Models developed with current version are
interchangeable with previous versions. Similarly,
models developed in earlier versions can be run in
@RISK 5.0 without modification.
Previous versions of Crystal Ball may not run properly,
accurately, or at all in Crystal Ball 7.3 without
modification. In some cases, even modification will not
solve the problem. See Backward Compatibility in
Crystal Ball in the Appendix Notes for details from the
Crystal Ball 7.3 User Manual.
Capacity
Models with 100,000 or more distributions can be
simulated. Fully supports Excel 2007’s enlarged
worksheets. The only limitations are from Excel, not
@RISK.
From Crystal Ball 7.3 User Manual, pp. 21, 61, and 63:
“You should define less than 1000 assumptions, decision
variables, and forecasts per worksheet.”
Available
Distributions
39 distributions, including all distributions provided
with Crystal Ball.
Only 21 – for example Crystal Ball is lacking Chi-Squared,
Inverse Gaussian, LogLogistic, Pearson V and VI.
@RISK
Library
A SQL database where you can store and share custom
probability distribution functions with other @RISK
users to ensure consistent modeling across an
organization or workgroup. @RISK Library
distributions are available in Define Distribution
window, and Library itself is accessible via standard
@RISK interface.
None.
GENERAL
Native Excel
Functions
See Crystal Ball Functions in the Appendix Notes for
more information.
MODELING
Palisade Corporation
Americas: +1 607 277 8000 • Europe: +44 1895 425050 • Asia-Pacific: +61 2 9929 9799
www.palisade.com
[email protected]
@RISK 5.0 Compared to Crystal Ball® 7.3
Overview
Crystal Ball® 7.3
@RISK 5.0
Copying and
Pasting
Uses standard Excel copy/paste as all @RISK
distributions are true Excel formulas. Excel’s Fill Down
command is fully supported.
Excel copy/paste not supported. Limited proprietary
Crystal Ball copy/paste commands are required to
copy/paste Crystal Ball distributions and data. Although
Excel copy/paste is not supported, it appears to work and
no error message is given. No support for Fill Down
command. See Copy/Paste in Crystal Ball in the
Appendix Notes for details from the Crystal Ball 7.3 User
Manual.
Support for
Formulas
Distributions are true Excel functions and can be placed
anywhere. Distributions can be embedded in formulas
and there is no limit to the number of distributions per
cell. Expected value automatically updates when
distribution changes.
Limit to one distribution per cell and assumptions cannot be
defined in cells with formulas. Expected value in cell not
updated if distribution is changed. See Formulas in
Crystal Ball in the Appendix Notes for details from the
Crystal Ball 7.3 User Manual.
Distribution
Fitting
Fits continuous and discrete distributions to sample,
cumulative, and density data. Comparison, Difference,
P-P, and Q-Q graphs with results from multiple
goodness-of-fit tests. Custom chi-square binning.
Multiple data sets can be fit and reviewed. Fitted
distributions in model can be automatically updated
when data and fit changes. Overlay different fitted
distributions for comparison. Automatically fit
unlimited simulation results data with a single click.
Only fits sample data for a single test at a time. Input
distributions are not updated when fitted data changes. Fit
cannot be reviewed later after fit is run and distribution is
entered. No overlays of multiple fitted distributions. No
fitting of discrete distributions. See Distribution Fitting in
Crystal Ball in the Appendix Notes for details from the
Crystal Ball 7.3 User Manual.
Compound
Function
RiskCompound function combines frequency and
severity distributions into a single function, saving
thousands of separate distributions in insurance and
other models. RiskCompound also supports cell
references and formulas for more complex modeling.
None.
Model
Summary
window
All input distributions, outputs, and correlations are
listed in a tabbed table with thumbnail graphs and
summary statistics of each component. Model window
is linked to spreadsheet, so changes made in window
carry into model itself. Drag and drop thumbnail graphs
onto spreadsheet to enlarge.
No model summary window to display assumptions,
decision variables, correlations, or forecasts in model.
Management of Crystal Ball components requires
individually opening each cell at a time in its own Crystal
Ball window to view or edit it.
@RISK simulations are calculated 100% within Excel,
supported by Palisade sampling and statistics proven in
over twenty years of use. Palisade does not attempt to
rewrite Excel in an external recalculator to gain speed.
A single recalculation from an unsupported or poorly
reproduced macro or function can dramatically change
your results.
All calculations are performed external to Excel. Crystal
Ball Extreme Speed feature was developed by a third party
and as a result is not as tightly integrated with Crystal Ball
as the @RISK engine is in @RISK. Extreme Speed can
produce different results than normal speed, and has
significant limitations such as lack of compatibility with
user-defined macros, full cell referencing, all cell ranges,
and the full Excel function set, all of which give it limited
applicability to real-world models. See Crystal Ball
Extreme Speed in the Appendix Notes for details from the
Crystal Ball 7.3 User Manual.
SIMULATION
Simulation
Speed and
Accuracy
@RISK uses an optimized simulation engine, multiple
CPUs and multi-core processors to give you the fastest
calculations. @RISKAccelerator is also available
separately to speed up simulations by using available
CPUs over a network.
Palisade Corporation
Americas: +1 607 277 8000 • Europe: +44 1895 425050 • Asia-Pacific: +61 2 9929 9799
www.palisade.com
[email protected]
Page 2 of 8
@RISK 5.0 Compared to Crystal Ball® 7.3
Overview
Crystal Ball® 7.3
@RISK 5.0
Stress Analysis
User can specify any portion(s) of a distribution to be
sampled during a simulation in lieu of sampling from
the entire distribution. This lets you simulate more
specific situations with ease.
None.
Advanced
Sensitivity
Analysis
Advanced Sensitivity Analysis allows you to select a
number of @RISK distributions, or any other worksheet
cells, and run trial simulations while varying these
inputs across a range.
None.
Goal Seek
Finds starting conditions for desired simulation
outcome.
None.
Graphs and
Charts
Fully resizable and customizable Windows-standard
graphs and charts that can be fully customized. Graphs
appear in callout windows pointing to cells they
reference. Wide variety of graph types including
histograms, cumulative curves, scatter plots, box plots,
summary graphs, and tornado graphs. Overlay graphs
may be created by dragging and dropping or by pointing
and clicking. Graphs can be copied and pasted in Excel,
Word, or PowerPoint, and exported to Excel in native
Excel format. Browse through cells with results graphs
by pressing Tab key.
No box plots. More limited customization options. Ability
to set up user-defined defaults is limited and/or does not
work as documented. Cannot drag and drop overlays. No
browsing through forecast charts.
Sensitivity
Analysis
Automatic sensitivity analysis available after all
simulations using two methods – Rank-Order
Correlation and Multivariate Stepwise Regression.
@RISK sensitivity analysis pre-screens inputs based on
their precedence in formulas to outputs in your model.
Inputs that have no link to an output are removed from
the sensitivity analysis, thus avoiding erroneous results.
Partial - not available for any distribution entered as a
function. Must specify sensitivity analysis in Run
Preferences before simulation. Only one calculation method
available - Rank-Order Correlation. No pre-screening of
inputs for relevance.
Results
Summary
Window
The @RISK Results Summary window summarizes the
results of your model and displays thumbnail graphs and
summary statistics for your simulated output cell and input
distributions. Drag and drop thumbnail graphs onto
spreadsheet to enlarge and create overlays.
No results summary window to display forecast cells, data,
or statistics. Must generate inflexible static reports in
Excel. Forecast graphs may only be viewed by opening
each forecast cell one at a time in its own Crystal Ball
window to view or edit it.
Reporting in
Excel
Custom templates in Excel allow user-defined reports with
custom formatting and desired statistics and graphs.
Reports and graphs may be generated automatically in
Excel after simulation using reporting functions, or may be
sent to Excel from an @RISK window at any time with a
single click. Excel-formatted @RISK charts can use all
Excel graph formatting options.
Charts may be copied and pasted into Excel as pictures, not
native Excel format charts. Limited report customization
allows for no formatting and selection of content categories
only.
Save
Simulations in
Workbook
@RISK
Library
@RISK simulation results may be stored directly in
your workbook. This makes it easier to share models
with others.
No.
A SQL database where you can store and share @RISK
simulation results (graphs, data, reports, etc) with other
@RISK users. The makes auditing and comparison
with other simulations easy.
None.
RESULTS
Palisade Corporation
Americas: +1 607 277 8000 • Europe: +44 1895 425050 • Asia-Pacific: +61 2 9929 9799
www.palisade.com
[email protected]
Page 3 of 8
Appendix: Further Information and Notes
@RISK 5.0 Compared to Crystal Ball® 7.3
Crystal Ball® 7.3
@RISK 5.0
GENERAL
Application Settings lets you control customizable
defaults such a graph settings, simulation settings,
reports, and more in one convenient window. Settings
automatically apply to all future models, and may be
exported for sharing with other @RISK users for
consistency across a group.
Limited setting of defaults by individual dialog boxes in
separate parts of the software.
Distributions can be entered graphically through the
Define Distribution window, or typed directly into the
spreadsheet as standard Excel functions. Define
Distribution window is floating callout that points the
cell it references. It displays a palette of all available
distributions grouped by type, and displays customdefined distributions in the @RISK Library. Browse
through all cells with input distributions by pressing
Tab key. Overlay distributions for comparison by
pointing and clicking. Preview multiple distributions
in a single cell formula. Distribution statistics are
displayed with the graph. Excel formula bar shows
distributions entered. Arguments can include
mathematical expressions and cell references/ranges,
which can be typed in or entered by clicking in the
cell(s).
Distributions are defined external to Excel in dialog boxes
and are not shown in cell contents. Assumptions or inputs
cannot be typed into formula bar as an Excel function; must
use Distribution Gallery.
Excel References
Fully supports Excel’s capability and rules for absolute
and relative cell referencing. (i.e. =$C$5). Allows offworksheet and off-workbook cell referencing like all
Excel functions do.
Inconsistent handling of absolute and relative references.
Cell references off the active workbook are not supported.
See Excel References in Crystal Ball in the Appendix
Notes for details from the Crystal Ball 7.3 User Manual.
Correlation of
Distributions
Supports multiple named matrices. Enter correlations
via graphical matrix or functions in Excel. Define
coefficients by typing in or by using convenient slider
bar that updates correlation Scatter Plots in real-time.
Allows correlation instances, where the same matrix
can be used to correlate different groups of inputs for
quick model setup. No limitation on number of
correlated cells. After simulation, you can see Scatter
Plots and coefficients of actual correlations simulated.
You can also correlate a time series that has a similar
set of distributions in each time period.
No support for correlation instances. From the Crystal Ball
7.3 User Manual, p. 345:
“There is a practical limit of about 250 fully correlated
assumptions (assumptions that are correlated to every
other assumption) and up to about 1,000 serially correlated
assumptions (assumptions that are correlated to one or two
other assumptions) for each workbook.”
RiskMakeInput
Function
The RiskMakeInput function turns any Excel formula
into an @RISK input. Use this to get @RISK to treat
your proprietary calculations just as it does its own
distributions when calculating results. RiskMakeInput
can also summarize many individual distributions into
a single input, simplifying your Tornado graphs.
None.
Application
Settings
MODELING
Distribution
Entry
Can graph only a single distribution at a time with limited
statistics. Cannot overlay distributions for comparison.
Can only view either assumption graph or statistics; no
option to view both simultaneously.
Palisade Corporation
Americas: +1 607 277 8000 • Europe: +44 1895 425050 • Asia-Pacific: +61 2 9929 9799
www.palisade.com
[email protected]
Page 4 of 8
Appendix: Further Information and Notes
@RISK 5.0 Compared to Crystal Ball® 7.3
@RISK 5.0
Crystal Ball® 7.3
Simulation
Settings
Access the most common simulation settings such as
number of iterations and simulation to run from
convenient Simulation Settings toolbar. Unique, user
defined settings may be saved for each model. Userdefined defaults also available and may be transferred
to other @RISK users.
Must pull up full Run Preferences dialog to change simplest
settings. Must reset each simulation before changing Run
Preferences. Run Preferences are saved globally and apply
to all models. Not possible to save specific settings for
individual models.
Pause on Error
Pauses on simulation errors and gives locations of all
“error-causing” cells at once for easy diagnosis. Lets
you review the formulas and values for cells which are
precedents to the error-causing cell. This allows you to
examine values which feed into the problem formula.
Pauses, but only locates and identifies one of the errors
each time.
From p. 356 of the Crystal Ball 7.3 User Manual:
SIMULATION
Run multiple
simulations
back-to-back
Any number of spreadsheet values and functions may
be changed from simulation to simulation via native
SimTable function. Results from all simulations can
displayed together using all @RISK reporting
capabilities.
“Because of bursting, Crystal Ball [Extreme Speed] cannot check
cell errors after every trial as it does in Normal speed, only at the
end of a burst.”
Limited to changing only one or two spreadsheet values by
simulation. Must use limited external Decision Table tool.
Decision Table tool has limited output statistics and
graphics.
ADDITIONAL TOOLS
Optimization
@RISK Industrial edition includes RISKOptimizer for
advanced optimization combined with Monte Carlo
simulation for uncertainty analysis. RISKOptimizer was
developed on the same platform and by the same
development team as @RISK, ensuring seamless
integration and full compatibility with @RISK functions.
OptQuest optimization component is from a third party
developer and not as tightly integrated with Crystal Ball.
Parallel
processing
@RISK Industrial edition includes integrated
@RISKAccelerator for parallel processing of simulations
using all available CPUs or cores on multi-CPU or multicore processor machines. For every additional CPU or
core, simulation speed increases almost linearly.
None.
DecisionTools
Suite
Available by itself or with DecisionTools Suite.
DecisionTools Suite adds PrecisionTree for decision tree
analysis; TopRank for automated “what-if” sensitivity
analysis; RISKOptimizer for optimization under
uncertainty; Evolver for genetic algorithm optimization;
NeuralTools for predictive analysis with neural networks;
and StatTools for time-series forecasting and advanced
statistical analysis. @RISK functions work directly in
other Suite products just like they do in @RISK. All
products were developed from common platform by
same software development team.
Fewer companion tools available: only OptQuest for
optimization and CB Predictor for time-series forecasting.
OptQuest was created by a third party vendor, resulting in
clumsy integration.
Decision Trees
Available with companion tool PrecisionTree in the
DecisionTools Suite. PrecisionTree allows users to
model decisions in tree or influence diagram format in
Excel. In addition, it is designed to work with @RISK
and Monte Carlo simulations can be run on trees.
None.
Palisade Corporation
Americas: +1 607 277 8000 • Europe: +44 1895 425050 • Asia-Pacific: +61 2 9929 9799
www.palisade.com
[email protected]
Page 5 of 8
Appendix: Further Information and Notes
@RISK 5.0 Compared to Crystal Ball® 7.3
@RISK 5.0
Forecasting
and Statistics
Available with companion tool StatTools for Excel in the
DecisionTools Suite. StatTools allows users to utilize
over 30 wide-ranging statistical procedures (plus many
built-in data utilities) include time-series forecasting,
descriptive statistics, normality tests, group comparisons,
correlation, regression analysis, logistic regression,
pareto charts, quality control, nonparametric tests, and
more. StatTools functions are true Excel functions.
Allows users to define own custom statistics functions
that appear on StatTools menu.
Crystal Ball® 7.3
Companion product CB Predictor offers time-series
forecasting but lacks wide range of statistical procedures,
lacks ability to create custom procedures, and lacks true
Excel functionality.
NOTES
Crystal Ball Functions
Crystal Ball does offer probability distribution functions that can be placed in spreadsheet formulas as are @RISK distribution functions. The limitations
associated with these functions make them generally unusable for risk modeling. These functions are essentially external to Crystal Ball and the program
does not treat them in the same way it handles Assumption cells. They cannot be graphically displayed, correlated, sampled using Latin Hypercube
techniques, or used when a random number seed is set. Data cannot be extracted from them and they cannot be included in any reports. In addition, they are
not included in Crystal Ball's sensitivity analysis, thus use of them causes sensitivity information on standard Assumption cells to be misleading. Use of
these distribution functions is not encouraged in the Crystal Ball documentation or tutorials.
From p. 337 of the Crystal Ball 7.3 User Manual:
“Distributions defined with probability functions differ from those entered with the Define Assumption command in these ways:
• You can’t correlate them.
• You can’t view charts or statistics on them.
• You can’t extract data from them or include them in reports.
• They are not included in sensitivity analyses or charts.”
Backward Compatibility in Crystal Ball
From p. 20 of the Crystal Ball 7.3 User Manual:
“Crystal Ball 7 no longer supports two types of cell definition in the same cell. If an assumption or a decision variable is defined in the same cell as a
forecast in a Crystal Ball 4.x or 5.x (2000.x) workbook, the forecast will be deleted when the workbook is converted to Crystal Ball 7 format.”
From p. 26 of the Crystal Ball 7.3 User Manual:
“In previous versions of Crystal Ball, you could choose whether to use static or dynamic cell referencing in parameters. … If you open a model from a
previous version, any static references are converted into dynamic references. If you don’t want parameter values to change when a simulation is running, be
sure cell references in parameters do not reference Crystal Ball data cells (assumptions, decision variables, and forecasts) directly or indirectly through
formulas.”
From p. 310 of the Crystal Ball 7.3 User Manual:
“If you used [the Hypergeometric] distribution in a model created in Crystal Ball 2000.x, you might notice slight data changes when running that model in
the current version of Crystal Ball. This is because some rounding might occur when converting the probability parameter used in previous releases to the
success parameter used in this version of Crystal Ball.”
From p. 332 of the Crystal Ball 7.3 User Manual:
“In previous versions of Crystal Ball, discrete values with the same probability could be entered in ranges with five columns or more. Now, they cannot be
entered in ranges with five columns but can only be entered in single columns or ranges with six or more columns (to distinguish them from sloping ranges).
In previous versions of Crystal Ball, continuous uniform ranges with cumulative probabilities could be entered in a two-column format. Now a three-column
format is required… The three-column sloping range format used in previous versions of Crystal Ball has been replaced by a five-column format…”
From p. 336 of the Crystal Ball 7.3 User Manual:
“The beta distribution changed from previous versions to Crystal Ball 7.”
Palisade Corporation
Americas: +1 607 277 8000 • Europe: +44 1895 425050 • Asia-Pacific: +61 2 9929 9799
www.palisade.com
[email protected]
Page 6 of 8
Appendix: Further Information and Notes
@RISK 5.0 Compared to Crystal Ball® 7.3
@RISK 5.0
Crystal Ball® 7.3
Copy/Paste in Crystal Ball
From p.72 of the Crystal Ball 7.3 User Manual:
“The Excel commands do not copy the Crystal Ball data, even though they might appear to since the cell colors are copied. To copy Excel data and Crystal
Ball data, you must use the Excel edit commands and then use the Crystal Ball edit commands to copy the Crystal Ball data.”
From p. 218 of the Crystal Ball 7.3 User Manual:
“Because Crystal Ball cannot define assumptions in formula cells, you need to convert formulas to values before pasting the assumption cells.”
Formulas in Crystal Ball
From p. 21 of the Crystal Ball 7.3 User Manual: “Assumptions cannot be defined for formula or non-numeric cells.”
From p. 218 of the Crystal Ball 7.3 User Manual: “Because Crystal Ball cannot define assumptions in formula cells, you need to convert formulas to values
before pasting the assumption cells.”
Excel References in Crystal Ball
From p. 26 of the Crystal Ball 7.3 User Manual:
“All cell references in [assumption] parameters are treated like absolute references when cutting and pasting Crystal Ball data. Crystal Ball always stores
the cell reference in A1 format even if the Excel preference is set to R1C1format. The global R1C1 format preference is not affected by running Crystal Ball,
but the name ranges are, in fact, changed to A1 format since that is the way Crystal Ball stores them.
“In previous versions of Crystal Ball, you could choose whether to use static or dynamic cell referencing in [assumption] parameters. With static
referencing, all cell references are resolved at the start of a simulation and then frozen while a simulation is running. If you open a model from a previous
version, any static references are converted into dynamic references. If you don’t want parameter values to change when a simulation is running, be sure cell
references in parameters do not reference Crystal Ball data cells (assumptions, decision variables, and forecasts) directly or indirectly through formulas.”
Distribution Fitting in Crystal Ball
From p. 29 of the Crystal Ball 7.3 User Manual:
“Only continuous distributions are considered for distribution fitting.”
Simulation results (forecast) data can be fit, but only up to 1000 iterations. From p. 30 of the Crystal Ball 7.3 User Manual:
“Difficulties can occur when distribution fitting is selected for one or more forecasts with large numbers of trials. This is true for Normal as well as Extreme
speed. To avoid these difficulties, fitting is disabled for all run modes after 1,000 trials have been run.”
Crystal Ball Extreme Speed
From p. 358 of the Crystal Ball 7.3 User Manual:
“Ordinarily, there may be slight numerical differences in simulation results between Extreme and Normal speed modes. These differences are primarily
due to roundoff errors… In certain circumstances… these slight differences can compound and grow in magnitude.”
From pp. 348-360 of the Crystal Ball 7.3 User Manual:
“By default, Crystal Ball is set to use Extreme speed when initially loaded. … Because the Extreme Speed feature uses the Polymorphic Spreadsheet
Interpreter, certain Extreme Speed functions may return slightly different results than the corresponding Excel function for extreme values of any input
arguments. For example, this can occur with statistical and inverse distribution functions.
“…not all models are compatible with Extreme speed.
“Small differences in the last few decimal places of certain built-in function values should be expected, due to minor algorithmic differences in the way
formulas might be computed.
“References to cells in other open workbooks are dynamically updated if those cells depend on one or more assumptions. If the external reference is part of a
formula (not a simple external reference), this is not compatible with Extreme speed.
Palisade Corporation
Americas: +1 607 277 8000 • Europe: +44 1895 425050 • Asia-Pacific: +61 2 9929 9799
www.palisade.com
[email protected]
Page 7 of 8
Appendix: Further Information and Notes
@RISK 5.0 Compared to Crystal Ball® 7.3
@RISK 5.0
Crystal Ball® 7.3
“In Extreme speed, circular references with short Iteration setting may not match Excel’s values because of differences in calculation algorithms. For most
consistent results, set Iteration to at least 1,000. However, if a circular reference is non-converging, its results can differ greatly when run at both Extreme
and Normal speed, regardless of the Iteration setting.
“These functions are not supported in Extreme speed during a simulation:
CB.GetForeStatFN
CB.GetForePercentFN
CB.GetRunPrefsFN
CB.GetAssumPercentFN
CB.GetCertaintyFN
“To be compatible with Extreme Speed, user-defined functions must be ‘pure.’ A ‘pure function’ is one that computes its value solely on the basis of values
passed to it as arguments. A function that is not ‘pure’ might reference global data not passed as an argument. For example, it might get the value of a
worksheet cell or a defined name and use this as an input to compute the function value. If the global data depends on the assumptions — if, for example, it is
a worksheet cell with a formula computed from the assumptions
— it will have a distribution of values in Normal Speed, but it will appear deterministic (have a single value) in Extreme Speed. This is because the worksheet
cells change on every trial in Normal Speed, but they don't change in Extreme Speed.
“Range arguments in user-defined functions are only compatible with Extreme Speed when they are handled as Variant types.
“User-defined functions whose arguments are static (their values do not change during a simulation) are not called by Extreme Speed unless the Volatile
property of the function has been set...It isn’t possible to make this setting in Excel 2000, so volatile functions cannot run at Extreme Speed in that version of
Excel.
“In Extreme speed, it is not possible to run user-defined macros — such as CBBeforeTrial, CBAfterTrial, and CBAfterRecalc — during a simulation.
“A small group of Excel functions are not supported in Extreme speed: CALL, CELL, GETPIVOTDATA, INFO, HYPERLINK, REGISTER.ID, and the CUBE
functions added in Excel 2007 (CUBEMEMBER, CUBEVALUE, CUBESET, CUBESETCOUNT, CUBERANKEDMEMBER, CUBEMEMBERPROPERTY,
CUBEKPIMEMBER).
“Excel allows certain undocumented argument constructs for standard functions. Some of these argument constructs are still not supported in Extreme
speed.
“Extreme speed does not support dynamic ranges, where the OFFSET function is used on one or both sides of the range ":" constructor.
“Extreme speed supports defined names and their use in formulas, but not the Excel ‘Accept labels in formulas’ option which allows cell labels to be used in
formulas without defining them as names.
“Extreme speed does not support multiple-area references such as (A1:A5,B1,C1:E1) except as used in standard functions such as SUM that accept a
variable-length argument list of cell ranges.
“Extreme speed does not support 3-D references, where a cell range – used as an argument in a function call, for example – spans multiple workbooks.
“Because of bursting, Crystal Ball cannot check cell errors after every trial as it does in Normal speed, only at the end of a burst.
“Spreadsheets without Crystal Ball data always run in Normal speed even if Extreme speed is selected in the Run Preferences dialog. This could happen if
you have Crystal Ball spreadsheet functions entered in the model but have not defined assumptions, forecasts, or decision variables.
Disclaimer: All comparison information presented here is accurate to the best of our knowledge. All software was used according to vendor specifications and
versions tested were those available at the time of publication (April 2008). Any comparison errors are unintentional. We welcome corrections or suggestions.
Please submit corrections or suggestions to [email protected]. Crystal Ball is a product of Oracle, Inc.
Palisade Corporation
Americas: +1 607 277 8000 • Europe: +44 1895 425050 • Asia-Pacific: +61 2 9929 9799
www.palisade.com
[email protected]
Page 8 of 8