1
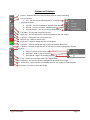
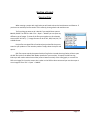
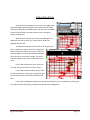
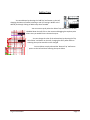
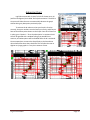
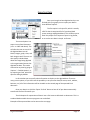
Adding Data Points
Once you have your graph set up you can start adding data
points and digitizing by selecting the ‘Pen’ tool button and simply
clicking into the graph to add data points. For more of a breakdown
of these features please read the previous section coving the
buttons and features.
With the ‘Pen’ selected you can now start adding points.
Add them from the 0,0 point. Or, in other words, where the
digitized data will start.
To add points click with the Left Click on the Graph where
point is needed. For easier ‘Auto Click’ simply hold
down the Left Click and run your mouse of the line
you want digitized. This will automatically add data
points for you as you trace the image. This works
well with tablets as well if you would prefer to use
a pen.
If you need to delete one point, select the
‘Pen Sub’ and then Left Click to remove a point.
If you need to delete multiple points, select
the ‘Pen Sub Selector’, select the starting point with
the Left Click and then the End Point with the Left
Click.
If you need to add points between two already specified points you can add them by clicking the
‘Pen Add’ and then Left Clicking to add points between two existing points.
Log Evolve Manual
Page 18