1
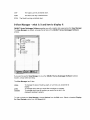
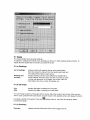
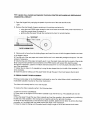
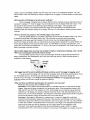
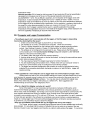
OM-MLT Series Datalogger Software.
User Manual.
M-404910304
1 Quick Start guide
2 File menu commands
2.1 Open command (File menu)
2.2 Close command (File menu)
2.3 Save command (File menu)
2.4 Save As command (File menu)
2.5 Print command (File menu)
2.6 Print Preview command (File menu)
2.7 Print Setup command (File menu)
2.8 User command (File menu)
2.9 Send command (File menu)
2.10 Properties command (File menu)
2.11 Digitally Sign command (File menu)
2.12 1, 2, 3, 4 command (File menu)
2.13 Exit command (File menu)
3 Edit menu commands
3.1 Copy command (Edit menu)
3.2 Graph command (Edit menu)
3.3 Customise command (Edit menu)
3.4 Options command (Edit menu)
4 Action menu commands
4.1 Program and Configure command (Action menu)
4.2 Restart command (Action menu)
4.3 Download Information command (Action menu)
4.4 Show Current Readings command (Action menu)
4.5 Show Readings Trend command (Action menu)
5 Window menu commands
5.1 New Window command (Window menu)
5.2 Split command (Window menu)
5.3 Close command (Window menu)
5.4 Close All command (Window menu)
5.5 Cascade command (Window menu)
5.6 Tile Horizontal command (Window menu)
5.7 Tile Vertical command (Window menu)
5.8 Window Arrange Icons Command
5.9 1,2, . . . command (Window menu)
6 Help menu commands
6.1 Help Topics command (Help menu)
6.2 Tip of the Day command (Help menu)
6.3 Check for new version command (Help menu)
6.4 Online command (Help menu)
6.5 About OM-MLT Series Datalogger Software command (Help menu)
7 Toolbar
8 Status Bar
9 View Manager - what is it and how to display it
9.1 Views
9.2w
9.3 Analysis
10 Connecting a logger
11 How to program the logger (overview)
11 .I Alarm settings options:
11.2 Display (Liquid Crystal Display - LCD) settinos options:
11.3 Sensor configuration
11.4 Modifying Date/Time
11.5 Start and Finish conditions
11.6 Security options
12 How to download Data from the Logger
13 Scanning the Logger
14 Maintenance
14.1 Cleaning Contacts
14.2 Battery Replacement
14.3 Humidity Calibration
14.4 External Sensors
14.5 Omega Junior Batteries
14. 6 Replacing Omega Junior Longer Lids
15 How to program the ChartReader
16 Security options
17 How to download Data from the ChartReader
18 Maintenance.
18.1 POWERING & CHARGING THE CHARTREADER
18.2 POWER FAILURE
18.3 OVERVIEW OF POWER INDICATOR MODES
18.4 CHANGING PRINTER PAPER & RIBBON
19 Display list of readings
20 Supported file formats
20.1 Loooer Compact Files
20.2 CSV (Comma delimited)
20.3 Formatted Text (Space delimited)
20.4 SYLK (Symbolic Link)
20.5 Text (Tab delimited)
21 Print list of readings
22 What is FDA 21 CFR Part 11.
23 How to achieve FDA 21 CFR Part 11 compliance.
24 How to get further assistance
25 Frequently Asked Questions (FAQ)
25.1 General Questions
25.2 Computer and Logger Communication
25.3 Programming loggers
25.4 Using loggers
26 Software registration
27. Warranty
1 Quick Start guide
1 .I Connect the logger or ChartReader.
In order for the software to communicate with a logger or ChartReader you must connect the appropriate
Communication Interface to serial port of your computer. Then place the logger into the Interface or
connect the ChartReader to the Interface.
For more help on how to connect the logger see How to connect the loooer
For more help on how to connect the ChartReader see How to connect the ChartReader.
.__I To make OM-MLT Series Datalogger Software work faster and more efficiently select the
““”
product(s) with which you are currently working and appropriate communication port. To do this:
choose Options command from Edit menu;
choose Products tab from Options dialog;
select product(s) and also you can set their priorities;
choose Communications tab from Options dialog;
select communication port(s) and also you can set their priorities;
click Apply button to set selected by you options and than click OK button to
close the Options dialog.
1.2 Program the logger or ChartReader.
toolbar button or select Program and
To program the logger or the ChartReader, click on the
ger Software will open Program and
Configure from the Action menu. OM-MLT Series Dat
Configure Wizard, which allows you to input your requirements.
For more help on how to program the logger see Programmino the logger Overview.
For more help on how to program the ChartReader see How to prooram the ChartReader.
1.3 Download data from the logger or ChartReader.
toolbar button or select Download
To extract data from the logger or the ChartReader, click on the
Information from the Action menu. OM-MLT Series Datalogger Software will open Download
Readings Wizard, which allows you to retrieve and view the recorded samples from the logger or the
ChartReader.
For more help see Display list of readings.
1.4 Viewing the data.
After data has been successfully downloaded you can change its appearance by using View Manaoer’s
tools Views, Links or Analysis.
1.5 Save the data into a file.
If you would like to save downloaded data please see how to save data into a file.
For more help see supported file formats.
2 File menu commands
The File menu offers the following commands:
2.1 Open command (File menu)
Use this command to open an existing document that contains logger data in a new window.
You can open multiple documents at once. Use the Window menu to switch among the multiple
open documents. See File open dialog.
Shortcuts
Toolbar:
Keys:
CTRL+O
File Open dialoq
The following options allow you to specify which file to open:
File Name
Type or select the filename you want to open. This box lists files with the extension you
select in the List Files of Type box.
List Files of Type
Select the type of file you want to open:
Note than this application works only with Logger Compact Files.
Drives
Select the drive in which OM-MLT Series Datalogger Software stores the file that you want
to open.
Directories
Select the directory in which OM-MLT Series Datalogger Software stores the file that you
want to open.
Network...
Choose this button to connect to a network location, assigning it a new drive letter.
2.2 Close command (File menu)
Use this command to close an active document that contains logger data.
2.3 Save command (File menu)
Use this command to save an active document that contains logger data.
For help regarding supported file formats see file formats
Shortcuts
Toolbar:
Keys:
CTRL+S
2.4 Save As command (File menu)
Use this command to save an active document that contains logger data to a specified file name.
For help regarding supported file formats see file formats
2.5 Print command (File menu)
This command presents a Print dialog box,
Use this command to print an active document.
where you may specify the range of pages to be printed, the number of copies, the destination
printer, and other printer setup options.
Shortcuts
Toolbar:
Keys:
CTRL+P
Print dialog box
The following options allow you to specify how the document should be printed:
Printer
This is the active printer and printer connection. Choose the Setup option to change the
printer and printer connection.
Setup
Displays a Print Setup dialog box, so you can select a printer and printer connection.
Print Range
Specify the pages you want to print:
Prints the entire document.
All
Prints the currently selected text.
Selection
Prints the range of pages you specify in the From and To boxes.
Pages
Copies
Specify the number of copies you want to print for the above page range.
Collate Copies
Prints copies in page number order, instead of separated multiple copies of each page.
Print Quality
Select the quality of the printing. Generally, lower quality printing takes less time to produce.
Print Progress Dialog
The Printing dialog box is shown during the time that OM-MLT Series Datalogger Software is
sending output to the printer. The page number indicates the progress of the printing.
To abort printing, choose Cancel.
2.6 Print Preview command (File menu)
Use this command to display the active document as it would appear when printed. When you
choose this command, the main window will be replaced with a print preview window in which
one or two pages will be displayed in their printed format. The print preview toolbar offers you
options to view either one or two pages at a time; move back and forth through the document;
zoom in and out of pages; and initiate a print job.
Print Preview toolbar
The print preview toolbar offers you the following options:
Print
Bring up the print dialog box, to start a print job.
Next Page
Preview the next page.
Prev Page
Preview the previous page.
One Page I Two Page
Preview one or two pages at a time.
Zoom In
Take a closer look at the page.
Zoom Out
Take a larger look at the page.
Close
Return from print preview to the editing window.
2.7 Print Setup command (File menu)
Use this command to select a printer and a printer connection. This command presents a
Setup dialog box, where you specify the printer and its connection.
Print
Print Setup dialoq box
The following options allow you to select the destination printer and its connection.
Printer
Select the printer you want to use. Choose the Default Printer; or choose the Specific Printer
option and select one of the current installed printers shown in the box. You install printers
and configure ports using the Windows Control Panel.
Orientation
Choose Portrait or Landscape.
Paper Size
Select the size of paper that the document is to be printed on.
Paper Source
Some printers offer multiple trays for different paper sources. Specify the tray here.
Options
Displays a dialog box where you can make additional choices about printing, specific to the
type of printer you have selected.
Network...
Choose this button to connect to a network location, assigning it a new drive letter.
2.8 User command (File menu)
+jje;:::
‘_‘_‘.
Th’iS command only available if “User Admin Package for Title 21 CFR Part 11 compliance
” installed.
Use this command to log on to OM-MLT Series Datalogger Software, or to log off from it, or to
change your details (password).
To log on to OM-MLT Series Datalogger Softwareselect Log On from User command.
Shortcuts
Toolbar:
Keys:
F9
To log off from OM-MLT Series Datalogger Software select Log Off from User command.
Shortcuts
Toolbar:
Keys:
FIO
To change your details select Change Details from User command.
2.9 Send command (File menu)
Use this command to send the active document through electronic mail. This command presents
a mail window with the active document attached to it. You may then fill out the To: field, Subject:
field, etc., and add text to the body of the message if you wish. When you are finished you may
click the “Send” button to send the message.
2.10 Properties command (File menu)
Use this command to display the active document properties.
2.11 Diqitallv Sign command (File menu)
;;+;++el:I
‘.‘.‘.
This command only available if “User Admin Package for Title 21 CFR Part II compliance
” installed.
Use this command to add your digital signature to the active document.
Shortcuts
Toolbar:
In opened Digital Signatures dialog you can see signatures, if any were added at previous date.
to add digital signature click Add button. In opened Add a Digital Signature dialog select a
meaning you wish to apply to your digital signature and click OK button. New digital signature will
be added to the current document and will include your username, meaning and time stamp of
??
the signature.
??
to print list of the active document digital signatures click Print button.
2.12 1.2, 3,4 command (File menu)
Use the numbers and filenames listed at the bottom of the File menu to open the last four
documents you closed. Choose the number that corresponds with the document you want to
open.
2.13 Exit command (File menu)
Use this command to end your OM-MLT Series Datalogger Software session. You can also
use the Close command on the application Control menu. OM-MLT Series Datalogger Software
will prompt you to save documents if there are any unsaved changes.
Shortcuts
Mouse:
Keys:
Double-click the application
’s Control menu button.
ALT+F4
3 Edit menu commands
The Edit menu offers the following commands:
3.1 Copy command (Edit menu)
Use this command to copy selected data onto the clipboard. This command is unavailable if
there is no data currently selected.
Copying data to the clipboard replaces the contents previously stored there.
Shortcuts
Toolbar:
Keys:
CTRL+C
3.2 Graph command (Edit menu)
Use this command to customise appearance of the current graph.
Data
. This option gives you a choice to set your own title and comment to the current graph.
Sensors
. This option gives you a choice to set colour and type of the line or marker for every
sensor of the current graph;
2D Graphs
. change appearance of the graph, such as whether to include comment and title, or to
display grid lines;
. change border colours.
Zoom
. set maximum and minimum value for X and Y axis.
Legend
. change position of graph Legend;
. list items, which can be included in Legend.
Colours
. set colour for the graph, comment and Legend.
:m listed above options will change appearance of the current graph only. Should you
wish to make same changes to all your graphs, please use Options command(Edit menu).
3.3 Customise command (Edit menu)
Use this command to customise appearance of the
toolbar.
3.4 Options command (Edit menu)
Use this command to open options dialog, which allows you to customise your program settings.
General
. select temperature scale. This option gives you a choice to set temperature scale in
Celsius, Fahrenheit, or Kelvin;
display or hide Status Bar, which is displayed at the bottom of the OM-MLT Series
batalogger Software window;
. display or hide View Manager;
. display or hide Tip of the Day when OM-MLT Series Datalogger Software start.
File
. choose how many recent file entries are displayed;
. choose which default folder to store data logging files. By default it is “C:\My
Documents\My Logger Data ”.
Date
??
change date format.
Time
. change time format.
Time Zone
change Time Zone settings.
2D Graphs
. change appearance of the graph, such as whether to include comment and title, or to
display grid lines;
. change border colours.
Legend
. change position of graph Legend;
. list items, which can be included in Legend.
Products
list and set priorities for loggers and ChartReaders.
Communications
??
??
. list and set priorities for communications ports.
Languages
. set language for display and printing.
Colours
. set colour for graphs, readings and Legend.
Advanced
. choose advanced features applicable to your needs.
4 Action menu commands
The Action menu offers the following commands:
4.1 Proqram and Confiqure command (Action menu)
Use this command to program logger or ChartReader.
Shortcuts
Toolbar:
For more help about programming the logger see Programming the logger Overview.
For more help about programming the ChartReader see How to program the ChartReader.
4.2 Restart command (Action menu)
Use this command to restart a logger.
Shortcuts
Toolbar:
4.3 Download Information command (Action menu)
Use this command to download data from logger or
ChartReader.
Shortcuts
Toolbar:
For more help see Display list of readings.
4.4 Show Current
Readinns command (Action menu)
Use this command to scan the currently connected logger.
Shortcuts
Toolbar:
For more help see Scanning the Logger.
4.5 Show Readings Trend command (Action
menu1
Use this command to show readings trend.
5 Window menu commands
The Window menu offers the following commands, which enable you to arrange multiple views of multiple
documents in the application window:
5.1 New Window command (Window menu)
Use this command to open a new window with the same contents as the active window. You can
open multiple document windows to display different parts or views of a document at the same
time. If you change the contents in one window, all other windows containing the same
document reflect those changes. When you open a new window, it becomes the active window
and is displayed on top of all other open windows.
5.2 Split command (Window menu)
Use this command to split the active window into panes. You may then use the mouse or the
keyboard arrows to move the splitter bars. When you are finished, press the mouse button or
enter to leave the splitter bars in their new location. Pressing escape keeps the splitter bars in
their original location.
5.3 Close command (Window menu)
Use this command to close the active window.
5.4 Close All command (Window menu)
Use this command to close all opened windows.
5.5 Cascade command (Window menu)
Use this command to arrange multiple opened windows in an overlapped fashion.
5.6 Tile Horizontal command (Window menu)
Use this command to vertically arrange multiple opened windows in a non-overlapped fashion.
5.7 Tile Vertical command (Window menu)
Use this command to arrange multiple opened windows side by side.
5.8 Window Arranqe Icons Command
Use this command to arrange the icons for minimized windows at the bottom of the main
window. If there is an open document window at the bottom of the main window, then some or all
of the icons may not be visible because they will be underneath this document window.
5.9 1.2, . . . command (Window menu)
OM-MLT Series Datalogger Software displays a list of currently open document windows at the
bottom of the Window menu. A check mark appears in front of the document name of the active
window. Choose a document from this list to make its window active.
6 Help menu commands
The Help menu offers the following commands, which provide you assistance with this application:
6.1 Help Topics command (Help menu)
Use this command to display the opening screen of Help. From the opening screen, you can
jump to step-by-step instructions for using OM-MLT Series Datalogger Software and various
types of reference information.
Once you open Help, you can click the Contents button whenever you want to return to the
opening screen.
6.2 Tip of the Day command (Help menu)
Use this command to display Tip of the Day dialog.
6.3 Check for new version command (Help menu)
Use this command to connect to online information for updated versions of this application.
6.4 Online command (Help menu)
Use this command to connect to online service such as:
. Visit Home Page.
Shortcuts
Toolbar:
. Support Web Page.
. Frequently Asked Questions Web Page.
6.5 About OM-MLT Series Dataloqqer Software command (Help menu)
Use this command to display the copyright notice, version number of your copy of OM-MLT
Series Datalogger Software, and distributor contact information.
7 Toolbar
The toolbar is displayed across the top of the application window, below the menu bar. The toolbar
provides quick mouse access to many tools used in OM-MLT Series Datalogger Software.
Click
To
Open an existing file. OM-MLT Series Datalogger Software displays the Open dialog box,
in which you can locate and open the desired file.
Save the active document with its current name.
Print the active document.
Log on user.
Log off user.
Insert the digital signature on an active document.
Prepare logger or ChartReader ready for use.
Program and configure loggers or
ChartReaders.
Download logger trip information from loggers or from storage within
Show the current sensor readings of the attached logger.
Copy the selection and put it on clipboard.
Zoom out the display to previous setting.
ChartReaders.
View the Internet home page for the product range supported by this software.
Display program information, version number and copyright.
Display help for clicked-on buttons, menus and windows.
8 Status Bar
The status bar is displayed at the bottom of the OM-MLT Series Datalogger Software window.
To hide or display the Status Bar, choose Options from the Edit menu and uncheck or check Display the
Status Bar option from the General tab.
The left area of the status bar displays the meaning of selected items as you navigate through the
menus. This area also interprets the toolbar buttons.
:w This area also displays date/time and value data of any indicated point on the graph.
The right areas of the status bar indicate which of the following keys are latched down:
Indicator
Description
The Caps Lock key is latched down.
CAP
NUM
The Num Lock key is latched down.
SCRL
The Scroll Lock key is latched down.
9 View Manager - what is it and how to display it
OM-MLT Series Datalogger Software supplies you with a helpful data viewing tool, the View Manager.
The View Manager, by default, occupies the left side of the OM-MLT Series Datalogger Software
window.
. :.
.
.
,:.
‘. _‘. _‘. :. _‘. :. _‘_ _‘_ :
.
.
.
.
.
.
.
.
If you want to see the View Manager in any other OM-MLT Series Datalogger Software window
location, simply select and drag.
The View Manager has 3 tabs:
Views
Links
Analysis
To manage the type of reading, graph, or summary you would like to
display.
To manage which data you would like to analyze or compare.
To manage which type of analysis you would like to add in the
displayed readings or graphs.
To hide or display the View Manager, choose Options from the Edit menu. Select or deselect Display
the View Manager option from the General tab.
.:.:.:.:.:::.:.:_:.:.:.:.:.:.:,:.:,:.:,:.:.:.:.:.:.:.:.:.:.:.:.:.:.:.:.:.:.:.:.:.:.
.~
. . . . ....................................
.................................................
:i:i:i:i:iii:i:citi~l~~:~~~~r~:~:~:~:~:~:~~:~~:~~~:~:~:~~:
.:.:.:.:.:::.:
.: . . . . . . . . . . . . . . . . . . . . . . . . . . . . . . .
.i.:.:_:.:::.:.:.:,:.:,:.:,:,:,:.:,:.:.:.:.:.:.:.:.:.:.:.:.:,:.:,:.:,:.:,:,:.:,:.:,
9.1 Views
The V iews w indow has 3
t op -l eve l head ings .
To expand or co
ll apse t he con t en t o f any head
ings j us t c li ck on
d isp l ay t he it e m doub l e - c li ck on t he it e m you wou
l d li ke t o see .
it. Each head
ing con
9.1 .(a) Readings.
List of readings
Readings and
summary
d isp l ays a t ab l e w it h separa
t e li ne f o r each r ead ing t aken .
Each li ne sho w s the date and ti
m e the reading
w as m ade and
the m easure m ent m ade by each sensor.
d isp l ays read
ing su mm a ry report follo
wed by de
t a il ed li s t o f
actual readings.
Summa ry report includes such facts as serial
nu m ber and description of the logger, trip nu
m ber, start and
finish dates, ti
m e zone, nu
m ber of readings, etc.
9.1 .(b) 2D Graph.
Line
Step
You can en
wan t t o zoo
d isp l ays
d isp l ays
t he l ogge r ’s read
t he l ogge r ’s read
ing as a
li ne g r aph .
ings as a s
t ep g r aph .
l a r ge a sec
ti on o f t he g r aph w it h t he m ouse . M ove t he m ouse t o one co
r
m , p r ess t he l e ft m ouse bu
tt on , d r ag t he m ouse t o t he oppos
it e co r ne r, a
t o en l a r ge a sec
ti on o f t he g r aph . Ptoolbar
r ess bu
t hett on o r ri gh t c li ck t he m ouse
(unzoo m ) the graph.
t o r es t o r e
9.1 .(c) Summary.
Overview
d isp l ays overv
iew in f o r m a ti on o f t he cu
rr en t l ogge r such as
Statistic
serial number, trip number, battery report, time zone, start and
finish dates, number of readings, readings interval, logger ’s
range and specification.
displays the serial number, the description, the highest and
the lowest value of readings, the average value of readings
and the Process Hygiene Index.
9. 2 Links
The Links window provides a way to analyze and/or compare data from multiple loggers, which could
have been logged over different time periods and/or different logging intervals.
In the Links window you can see all the loggers and their sensors being that OM-MLT Series
Datalogger Software has currently open and displayed. Simply select the loggers and their sensors to
include their data into the current display window. If you want to include data logged by another logger
into the current displayed graph, place a tick in the relevant sensor or logger tick box within the Links
window. The Multiple Trip Synchronisation Wizard will guide you through the process of including the
data from the other logger into the current display.
To compare log trip data gathered from multiple locations at similar periods of time, it is recommended
that you select the option Compare trip data based on actual date/time of each reading ’.
For example, this will allow data recorded from one site to be compared with data from another during the
same interval of time.
To compare log trip data gathered from multiple and/or the same location during different periods of time,
it is recommended that you select the option Compare trip data from different date/time period(s).
This is useful for comparing current log data with that of a previous week.
To customize how the log trip data from loggers is included, select the option Manually define how the
trip data is to be compared with other trip data. This will provide you with a screen that will allow you
to manually adjust the alignment offset through the
“Reading Offset ” controls.
9.3 Analvsis
The Analysis window has 2 top-level headings.
To expand or collapse the content of any headings just click on it.
9.3.(a) Calculated Values:
Mean Average
Highest reading
Lowest reading
Dewpoint information
Process Hygiene
Index(PHI)
Mean Kinetic
Temperature(MKT1
9.3.(b) User Defined:
select this option to display the average value of readings in the
graph’s Legend.
select this option to display the maximum value of the readings
in the graph’s Legend.
select this option to display the minimum value of the readings
in the graph ’s Legend.
select this option to display temperature at which air becomes
saturated with water and begins to condense - forming dew.
select this option to display the aerobic and anaerobic process
hygiene index of readings in the graph ’s Legend.
select this option to display the Mean Kinetic Temperature of
the readings in the graph ’s Legend.
Custom
select this option to display custom defined value of readings in the graph ’s Legend.
Double clicking on the Custom item opens the Calculate Value Definition dialog where you can set:
Name any name you wish. For example “Calculated fresh value of food ”.
enter the formula used to convert each sensor ’s reading into the calculated value.
Formula
Example:
the value of fresh food is given as
Fresh Value = (Measured Temperature -Target Temperature) * Time
Assume the Target Temperature is 60°C.
Set the Formula to $ - 60.
Set the Time Units to hours.
Select Greater than or equal to option and set limit to 60.
??
??
??
The mathematical operations currently supported include:
Symbol
+
_
*
I
;
)
=It-to
expo
lo90
lo9160
abs0
$
What does it mean
addition
subtraction
multiplication
division
raise to power
left bracket
right bracket
square root
exponential
natural logarithm
base 10 logarithm
absolute value
sensor value
10 Connecting a logger
In order for the software to communicate with a logger you must connect the Communication Interface
to a serial port on your computer.
Place the logger into the Interface, making sure that the two metallic contacts on the bottom of the logger
are aligned with the contact pins on the Interface and that the logger is firmly seated. The software
defaults to “auto-detect” mode, which will check all the installed serial communications ports (COM) on
your computer for a logger, ChartReader, or other known Omega products.
dr anda
t hitwaed
pp
isu
hsi ace
srf
:
etnI he
t ha
tt
hitwaed
pp
i equ
rchase
ot n
pu
ineed
pill
w
25arotyouconnec
.rert conve
sretipu
mr nico
p
you
-gr.ot If connec
n
i p25 otelam
ef
n
ip-g ela m
)wrvie
ove
re(ogg
l he
tm
raog
r otwp
Ho
11
Programming a logger is the process of configuring a logger so that it will record the data you want, when
you want it.
To program a logger, click on the
aOM-MLT
w
ftSo
re ogg
lat Da
es
riSe
menu.re
guide you through the process.
toolbar button or
regu
fiselect
Con
and
m
raog
rP
drza
i Won
will
rati
gu
fi open
Con
and
m
raog
rP
from the Action
which will
The “Next >”and “< Back ” buttons will help you to navigate through dialogs. The “Esc” key and “
Cancel” button will exit you from the programming sequence without implementing any changes currently
made. The “1~ Restart> button will return you to the first step of the dialog.
When you program a logger, the first thing the software will do is retrieve the current program information
from the logger. Once the programming information has been retrieved, you may be prompted to enter a
security code to enable re-programming of the logger
You will be able to program:
Sensor confiquration
The loqqer ’s internal time clock
The loqqer’s start and finish conditions
:son
ti11
sng
tti
op
se
m
.Iral A
Enable this option if you want the logger to raise an
r owe
l ow
le on
m
ral bse
i Raa
spec
ng
i read
alarm if the temperature is less than the
um
m
ini m
specification that has been recorded.
Enable this option if you want the logger to raise an
Raise alarm on above upper spec reading
alarm if the temperature is greater than the maximum specification that has been recorded.
This option means the logger will deactivate its
otni
son
go
iti cond
ifback
m
ral et va
ti
a Deac
spec
alarm when the sensor goes back into its set specification. If this option is not selected and the logger
alarm is activated, the logger will remain in warning mode until re-programmed.
Enabling this option will make the logger
on
tiva
ti nk
lim
ral ac
and
m
ral elbi aAud
continuously beep when an alarm event has occurred.
Enabling this option will allow you to reset
t agne
mhe
t ng
i by
m
ral eus
t va
ti
a Deac
logger’s alarm when a magnet passes over the logger label.
Determines how many consecutive out
sng
i read
on
tica
ifispec
fot ou
ve
ti consecu
for be
mNu
of specification readings can occur before an alarm is raised.
Determines the total number out of specification
sng
i read
on
tica
ifispec
fot ou
for be
mnu
lat To
readings can occur before an alarm is raised.
al siyD
lprysta
d
iq
iL(C
ual siy2p
. 11
D
ay
l sp
i he
t ng
id read
son
’r he
t wSho
senso
show current sample.
:son
tisnq
tti
op
se
)- LCD
Enable this option if you want the logger ’s display to
Enable this option if you want the logger
Indicate when the current reading is out of specification
‘s display to show a special symbol when the current sample above the maximum specification or below
the minimum specification.
Enable this option if you want to add a
Show the symbol of the sensor’s measurement units
temperature symbol to the logger ’s display.
Units of measurement of the readings on the displayAllows the temperature scale the logger
displays to be changed.
:@i& This dialog appears for loggers that have a display
11.3 Sensor confiquration
The available options include:
Minimum
any samples less than set value will be marked as out of specification.
Maximum
any samples greater than set value will be marked as out of specification.
Increment
the grouping size used for listing out of specification readings.
For example, if a cargo ’s temperature is allowed to vary 2 degrees from a nominal - 2 degrees then the
minimum would be set to - 4 and the maximum would be 0. If increment was set to 2 degrees, you would
get a summary indicating the number of readings that fell outside the allowable parameters in 2 degree
bands. That is, the number of readings between 0 and 2 degrees, between 2 and 4 degrees, etc. Out of
*” symbol when displayed in a listed report.
specification samples are marked with a “
11.4 Modifvinq Date/Time
This dialog allows you to adjust the logger ’s time clock. The logger ’s current date and time are displayed.
There are three options available:
Do not make any change to the date or time of the logger
time clock unchanged.
Select this option to leave the logger ’s
Change to the same date and time of this computer Use this option if you need to set multiple
loggers to the same date and time.
Set to Selecting this option allows you to manually input time.
11.5 Start and Finish conditions
This dialog allows you to control the start and finish points and the interval between each reading.
Start new log trip
determines when the logger is to start logging.
You can select one of the following options:
After a magnetic start the logger will start when a magnet passes over the logger label.
In after selected days, hours and minutes.
At selected date and time.
Finish log trip
determines when the logger is to stop logging. You can select one of the
following options:
after selected number of readings.
After <number> readings
After <time interval>
after selected days, hours and minutes.
At selected date and time.
logger will not stop, recording over its previous samples.
Continuous logging
To simplify the settings of the start and finish points:
You can select Duration of your trip in days and start point only. OM-MLT Series Datalogger
Software will set the finish point and the interval between each reading automatically
11.6 Securitv options
You can change the security code to safeguard your logger from unauthorised tampering. Make sure that
you keep a note of your security code and logger serial number in a safe place. If you lose or forget the
security code, the logger will have to be returned to the distributor or manufacturer to restore default
password.
For Omega Junior loggers the security code can be up to 4 digits. Loggers are shipped from the
manufacturer with a security code of
“1234 ”.
For Omega Precision loggers the security code can be up to 20 characters long (letters and numbers)
and is not case-sensitive. Loggers are shipped from the manufacturer with a security code of
“ESCORT ”
Change Password click this button to open Password Setting dialog.
Password Setting dialog has options:
Protect program settings
Protect retrieval of readings
Enable this option if you want to protect your
programming settings for the current logger.
Enable this option to disallow viewing of data from the
current logger without a password.
Fields to enter and to confirm new password.
12 How to download Data from the Logger
12.1 Connect the logger to your computer.
How to connect the logger
toolbar button or select Download Information
12.2 To download data from the logger, click on the
from the Action menu. OM-MLT Series Datalogger Softwarewill open Download Readings W izard,
which allows you to retrieve and view the recorded samples from the logger.
12.3 After the data has been successfully downloaded you can change logger
’s start conditions. You
have 4 options:
Do not upload any new
start conditions to the
logger
Select this options if you want to keep current data in the
logger ’s memory. The new data will be added to the end
of the existing list until the logger is reprogrammed or
logging is finished.
Wait [time] after a
magnetic start
Restart logger after a magnetic start. If [time] has not
been selected, logger will activate immediately after the
magnetic start.
Start in
Select this option if you want logger to start in a known
time interval. For example, in 2 hours after programming.
Start at
Select this option if you want logger to start at known
date and time. For example at 03/l 2/2002 IO:41 :55.
12.4 To view the downloaded data click Finish button.
:w
If you would like to download additional data from the Logger(s), you may do so by selecting
Download information from additional loggers and/orChartReaders option.
13 Scanning the Logger
toolbar button, will
Selecting Show Current Readings from the Action menu, or clicking the
produce a dialog box showing what the sensors of a logger are currently registering, updated in real time.
:w Scanning the logger quickly consumes battery power, so short scans are recommended.
14 Maintenance
14.1 Cleaninq Contacts
It may prove necessary from time to time to clean the metal contacts on the logger and interface in order
to ensure reliable communications. The contacts may be cleaned gently with isopropyl alcohol or
methylated spirits.
14.2 Batterv Replacement
Omega Junior loggers are designed to allow the user to replace the lithium battery when it has
expired. An Omega Precision logger ’s battery is not user replaceable and these loggers must be
returned to your distributor for battery replacement.
:m: The Omega Junior stores its data in a non-volatile memory so that even if the battery fails, the
recorded readings are retained. However, if battery power is lost for more than one minute, the Omega
Junior’s internal clock may stop and will need to be reset
To replace the battery:
13.2.1 Unscrew lid of Omega Junior. Sometimes the use of a lid unscrew tool may be required if
the lid is seized on. Contact your distributor if this is the case.
:w: If you are replacing the battery of a humidity logger, care must be taken not to damage the
humidity and temperature sensors that are exposed when the lid is removed. As a precaution, the “black
bung” these sensors are attached to can be unplugged from the logger and then re-fitted when the
battery has been replaced. If you decide to do this, make sure the “bung” is inserted into the
socket as shown in the diagram.
13.2.2 Remove the expired battery.
Check if battery contacts are dirty. In the unlikely event they are, clean the contacts with isopropyl
alcohol or methylated spirits and wipe dry.
13.2.3 Insert new battery by placing battery negative (-) end against (-) spring and compress so
that battery fits behind (+) spring. Ensure battery is inserted with correct polarity. If the Omega
Junior “chirps” then the internal clock will need to be reset.
13.2.4 Place logger in interface and access List using the software. If logger beeps and is read
correctly by the software, replace the lid.
If the logger fails to beep or communicate after the battery has been replaced, remove the new battery,
short the battery springs together with a piece of wire, like a paper clip, reinsert the new battery, and try
again.
14.3 Humidity Calibration
In order to maintain the rated accuracy of the humidity sensor, a humidity logger should have its humidity
calibration checked at least twice a year to detect and correct any ageing of the sensor element. Note
that the chemicals in some environments can cause accelerated ageing of the humidity sensor element
and in these situations the calibration should be checked more frequently. This checking and
re-calibrating, when required, can be performed either by your distributor, or with the JCAL (for Omega
Junior loggers) or CAL (for Omega Precision loggers) software and salt solutions available from your
distributor.
14.4 External Sensors
When plugging external sensors into a logger, make sure that the connector is inserted correctly. Forcing
an incorrectly aligned connector into its socket can damage the connector and/or socket.
14.5 Omeqa Junior Batteries
Please note that Omega Junior loggers use a % AA size, 3.6 volt lithium battery, commonly used in
cameras and available through respective retail stores.
14. 6 Replacinq Omeqa Junior Loqqer Lids
When replacing an Omega Junior ’s lid, the following steps are needed to ensure a watertight and
condensation-proof seal.
14.6.a Check that the o-ring and seat are clean and free of dirt and other contaminants.
14.6.b Grease the o-ring with an o-ring lubricant. We recommend Dow Corning Molykote 111
14.6.~ Ensure that the o-ring is properly fitted into its seat in the lid.
14.6.d When screwing the lid on, do not over tighten as this may damage the thread.
As Omega Engineering, Inc can not control how you replace the lid, we are unable to guarantee the lid
seal will remain watertight and condensation proof once the lid has been removed and replaced.
15 Connecting ChartReader
In order for the software to communicate with a ChartReader you must connect the Communication
Interface to a serial port on your computer.
Connect the ChartReader to the Interface. The software defaults to “auto-detect” mode, which will
check all the installed serial communications ports (COM) on your computer.
:m the Interface is shipped with a standard
g-pin connector. If your computer is equipped
with a 25-pin connector you will need to purchase a
25.pin female to g-pin male converter.
15 How to program the ChartReader
Programming ChartReader configures the chart and list printouts.
15.1 Connect the ChartReader to your computer.
toolbar button or select Program and Configure from the Action menu.
15.2 Click on the
OM-MLT Series Datalogger Software will open Program and Configuration Wizard, which will guide
you through the process.
The “Next >” and “< Back ” buttons will help you to navigate through dialogs. The “Esc” key and “
Cancel” button will exit you from the programming sequence without implementing any changes currently
made. The “1~ Restart” button will return you to the first step of dialog.
If password access for the ChartReader has been enabled, you may be prompted to enter the password
into the security access dialog.
You will be able to program:
15.2.(a) Details tab.
This dialog allows you to change general information stored in the ChartReader. A description, such as
the site name where ChartReader is located, an asset or inventory number, may be entered into the
appropriate fields. You can also enter up to 4 lines of text into the text fields of the Printable Messages
boxes. These 4 lines will appear at the beginning of every ChartReader printout.
15.2.(b) General tab.
This dialog allows setting of other operating, power and miscellaneous options for the ChartReader.
Temperature Units
The temperature units used on printed graphs can be set by selecting from the drop-down
Temperature units menu. For example, “C can be chosen as the unit of temperature by
selecting Celsius from the menu.
Date Format
Similarly, the format of the date on printouts can be chosen by selecting from the drop-down Date
Format menu. As an example of the selected date format, the current date is displayed at the
centre-bottom of the Printout Options box.
Enable internal beeper
This option will enable the beeper in the ChartReader, which indicates such things as the
ChartReader’s communication with a logger, the successful re-arming of a logger and that the
ChartReader has run out of paper.
Can re-arm a logger
If this option is enabled, the ChartReader will have the ability to re-arm loggers after downloading
their data. The ChartReader will be able to rearm a logger, with the same logging parameters,
for a magnetic start. Note that if a logger was originally programmed for a timer start, rearming
for a magnetic start will prevent the timer start.
Can store multiple downloads
If this option is enabled, the ChartReader will be able to store data from more than one logger
and/or multiple trips from the same logger(s). Each download from a logger is stored as a “Data
Block”.
Turn-off after
You can set the amount of time the ChartReader will wait, when idle, before automatically turning
Off.
15.2.(c) Options tab.
This dialog allows the setting of list and graph options for the ChartReader.
Only out of specifications readings
When this option is enabled, each list printout will include only out-of-specification readings.
Include the log cycle summary
When this option is enabled, each list printout will include a summary breakdown of the
out-of-specification readings after the actual listed readings. In this summary, the total amount of
time out-of-specification is broken down into four bands, based around the summary increment.
Two of these bands group data points above upper specification, while the other two bands
group data points below lower specification. For more information on the list printout and the log
cycle summary, refer to your ChartReader manual.
0°C (32°F) reference line
When this option is enabled, a O-degrees Celsius reference line is included on each graph
printout.
Specification lines
When this option is enabled, the ChartReader will print lines representing the maximum and
minimum specification values, as originally defined during the logger ’s programming sequence
Sensor labels on each section
When this option is enabled, each section of the printed graph will be annotated with sensor
labels identifying which sensor the data points are associated with. For example, “I”represents
an internal sensor, “E” represents an external sensor and “H” represents a humidity sensor.
These labels will be printed at the bottom of each section. These marks will not, however,
appear for loggers with a single sensor.
Y-Axis on each section
When this option is enabled, each section of the logger ’s graph printout will be individually
annotated with a labeled Y-Axis.
Log cycle summary
When this option is enabled, graph printouts will also include a summary breakdown of the
out-of-specification readings. This is the same log cycle summary as that included at the end of
ChartReader list printouts.
15.2.(d) Graphs tab.
There are two options available for defining the Y-Axis range of printed charts. The first option is
to use the sensor ’s working range as the range of the graph. Select Full range of the sensor to
choose this option. For example, if the sensor ’s range is -395°C to 39.5”C and this option is
selected, the Y-Axis range will be based on these limits.
Alternatively, chart Y-Axis ranges can be calculated from the specification and increment values,
as originally defined in a logger ’s programming sequence, by selecting the Specification range
and multiples of the increment option. For this option, the number of specification increments
to include in the chart range can be set with Number of specification increments to use. The
maximum number of increments to be used must be less than 256. For example, if the
specification limits are +I 5°C (minimum) and +25”C (maximum), the summary increment is 2”C,
and the number of specification increments to use is set at 3, the Y-Axis limits would be
15°C - (3 * 2°C) = +9”C (lower)
and 25°C + (3 * 2°C) = +31 “C (upper).
The value in the Round Y-Axis to the nearest field, controls the amount that the Y-Axis range
labels can be rounded by; Y-Axis range values are rounded to the nearest multiple of this value.
This rounding applies to the range values as set above. In the above example, if the rounding
applies to range values set to 2, the Y-Axis range would be 8°C to +32”C. The default value is 5.
Text orientation
You can choose Portrait to print text horizontally across the page. This is the default mode used
in previous versions of ChartReader. You can also choose Landscape, which prints the graph
header and axis and sensor labels vertically up the page. When this option is enabled, you can
also use the Compression feature if you wish.
Compression
Graph printout compression allows ChartReader graph printouts to be printed using a shorter
than normal section of paper. This feature can save time, paper and the printer ribbon.
Compression is only available if Landscape text orientation is selected.
You can select from the drop-down list:
None
Choose this option to print graphs out full size, with a printed dot representing each sample.
Thumbnail (40mm maximum length)
Choose this option to print graphs with a maximum length of 40 millimetres. The
ChartReader will then calculate an appropriate compression ratio for each graph printout.
Note that this is a maximum length; if a log cycle has too few logs to fill 40mm, it will be
printed normal size. Note also that because a ratio is used to compress the graph, it may
print smaller than 40mm.
Half length
Choose this option to print all graphs half size, using one printed dot for every two readings.
This is represented by a ratio of 2:l.
Custom maximum length
You can specify a maximum length for all graphs, in millimetres, with this option. Type the
length you require into the ‘mm’box beside the drop-down list.
As with the Thumbnail option, the ChartReader will calculate an appropriate compression
ratio for each graph printout. Note that this is a maximum length; if a log cycle has too few
logs to fill the specified length, it will be printed normal size. Note also that because a ratio is
used to compress the graph, it may print smaller than the specified length.
Custom ratio
You can specify your own compression ratio by selecting this option. Type the ratio into the
box beside the drop-down list. Because this ratio represents the number of readings to be
displayed on a single line, you can only enter a whole number.
15. 3 Click Finish button after the ChartReader has been programmed successfully.
$%rf&
.m
If you would like to program additional ChartReaders, you may do so by selecting Program and
configure additional loggers and/or ChartReaders option.
16 Security options
You can change the security code to safeguard your ChartReader from unauthorised tampering. Make
sure that you keep a note of your security code in safe place. If you lose or forget the security code, the
ChartReader will have to be returned to the distributor or manufacturer to retrieve your password.
When you are programming the ChartReader click Change Password button in the Details tab to open
Password Setting dialog.
The Restrict Access option allows control of password access. This password will protect access to the
configuration of the ChartReader, as well as data stored in the ChartReader. It will not protect the
operation of the ChartReader, as the keypad will still be active.
If password access is enabled, you can set the password by typing it into the Password field, and again
into the Confirmation field. The password may contain alphanumeric characters and is case sensitive.
17 How to download Data from the ChartReader
17.1 Connect the ChartReader to your computer.
How to connect the ChartReader
17.2 To download data from the ChartReader, click on the
toolbar button or select Download
Information from the Action menu. OM-MLT Series Datalogger Software will open Download
Readings Wizard, which allows you to retrieve and view the recorded samples from ChartReader.
17.3 After the data has been successfully downloaded you can free up memory capacity of
ChartReader. Select Delete all data blocks from within the ChartReader( if this option is enabled, all
the logger data currently stored in ChartReader will be deleted when the configuration settings are
uploaded. This will free up memory capacity to store data from further loggers.
17.4 To view the downloaded data click Finish button.
:w
If you would like to download additional data from the ChartReader( you may do so by
selecting Download information from additional loggers and/or
ChartReaders option.
18 Maintenance.
18.1 POWERING & CHARGING THE CHARTREADER
The ChartReader contains an internal NiCad battery which typically, when fully charged, can provide
power for about 1 hour of continuous printing.
To charge the NiCad battery, plug a 12V @ IA supply into the DC connector located at the rear of the
case. The plug needs to be a 2.lmm DC plug with negative on the inner connection.
(An adaptor of lesser current rating (i.e. say 0.7 amp) can be used but this will increase the time it takes
to fully charge the battery.) A 12V car cigarette lighter adaptor can also be used.
When connected to a suitable power supply, the ChartReader will indicate that the battery is being
charged by flashing the ON light.
The battery will normally take up to 2 hours to fully charge with 90% of the charge being attained within
the first hour. The charger can be left permanently plugged in without damage to the ChartReader or
battery.
Sometimes the battery will not take on a fast charge and the ON light will stop flashing well before 1 hour
is elapsed. In this case the ChartReader will continue to charge the battery in a “trickle charge mode ”
and may take up to 18 hours to fully charge a battery.
It is highly advised that the battery is fully exhausted before recharge to maximise life and
capacity of the battery.
Note that because the ChartReader uses an intelligent charge technique, it cannot be turned off when
external power is applied (i.e. a charger is connected). As soon as the external power supply is plugged
into an inactive ChartReader, it will automatically turn on to maintain the charging of the battery.
18.2 POWER FAILURE
The battery will typically exhaust itself during printing as this is the most energy consuming activity. When
the battery is becoming exhausted, the ON indicator will rapidly flash and a beep will be sounded. If this
occurs during printing (the most likely time) the printing will pause until either the battery voltage rises or a
charger is plugged in.
To continue using the ChartReader, plug in an external power source. As long as the printing was not
aborted it will automatically continue once a suitable external power supply is attached.
18.3 OVERVIEW OF POWER INDICATOR MODES
Action
ON Indicator slowly flashing with
charger plugged in.
ON Indicator permanently on with
charger plugged in.
ON Indicator flashing rapidly with
beeping.
ON Indicator not on
Meaning
Charge in progress.
Fast Charge completed. Battery trickle charged
Battery nearly exhausted.
ChartReader inactive (turned off).
I&: The NiCad battery is not included in the warranty.
18.4 CHANGING PRINTER PAPER & RIBBON
A. PRINTER PAPER ROLL REPLACEMENT
The ChartReader uses standard 57mm wide paper or 2 layer 57mm wide NCR type duplicating paper.
To replace the paper roll perform the following steps:
:w
:
NEVER
APER
PULL
WA
RDS
BACK
THROUGH
PINTER
MECHAN
ISMIRAS
REPARABLE
PR
DAMAGE
W
ILL RESULT!
1. Open the hinged lid by springing the plastic clip at the rear of the case and lift the lid
open.
2. Remove the short length of paper remaining in the printing mechanism by:
. using the small FEED button located on the circuit board to the left of the printer mechanism, or
using the manual wheel (if present), or
gently pulling the paper through the mechanism by hand in normal direction.
??
??
3. Remove old roll core from the holding fingers and insert the new roll with the paper direction as shown
in the diagram above.
4. Free the end of the new paper and ensure that the end is cut reasonably straight and square. Trim with
scissors if necessary.
5. Take the free end of the paper and gently push it over the plastic ramp and into the mouth of the printer.
6. By using the manual feed knob (if present) or the FEED button (with power ON), feed the paper
through the mechanism, past the ink ribbon and leave about 6mm (x inch) of paper protruding from the
top of the mechanism.
7. Tighten the ink ribbon in it ’s cassette by turning the star shaped disc (on the left of the cassette) 2 or 3
turns clockwise.
8. Close the case lid making sure the paper feeds through the gap in the lid and secure the lid catch.
B
.R
IBBON
TTE
CASSE
ACEMEN
REPL
T
Printing on plain paper in the ChartReader is achieved by use of an inked ribbon which is contained in a
replaceable cassette mounted on the printer mechanism.
The ribbon will normally last for 2 to 3 rolls of paper.
To replace the ribbon cassette, perform the following steps:
1. Open the lid of the ChartReader.
2. Press down on the right end of the ribbon cassette to pop the left end up. The cassette can now be
lifted out.
3. Pass the paper through the new ribbon cassette and load the cassette in the mechanism by positioning
the left end of the cassette in the mechanism and gently pushing the right end into place.
4. Using the star-shaped disc on the left of the ribbon cassette, tighten the ink ribbon by turning the wheel
clockwise, so it is straight and lying neatly behind the paper in the mechanism.
5. Close the case lid making sure the paper feeds through the gap in the lid and secure the lid catch.
19 Display list of readings
toolbar button or select Download Information from the
To extract data from a logger, click on the
Action menu. OM-MLT Series Datalogger Software will open Download Readings Wizard, which
allows you to retrieve and view the recorded samples from a logger.
If you are using an Omega Precision logger and the beeper is turned on, or you are using an Omega
Junior logger, you will hear several “beeps” while data is being downloaded. These beeps indicate that
the logger is sending information to your computer. Note that if the Protect Data option is enabled, you
will have to provide the logger ’s security code before being able to retrieve the readings.
List of Readings
When the data is initially extracted from a logger it may be displayed in the following form:
.
List of readings
.
Readings and summary
.
2D graph - Line
.
2D graph - Step
.
Overview
Statisti c
??
Program Summary
This includes such facts as:
Description of the log trip.
Which sensors were used.
9 Number of readings taken.
. Trip number. This number is incremented every time a logger is programmed and starts a new log.
?
?
20 Supported file formats
When you are saving the file for the first time or after selecting Save As menu, OM-MLT Series
Datalogger Software opens “File Save” dialog. This dialog allows you to specify what file format to
save the data into, what name to call the file and in what location to save the file.
I@.?& Default file name [Serial number]
- [Trip number]
[Serial number] is the serial number of the logger.
[Trip number] is the current trip number of the logger.
The supported file formats are:
20.1 Logger Compact Files
If you want to save data for later study using this software you must save it using this format. Logger
Compact File can only be read by OM-MLT Series Datalogger Software.
20.2 CSV (Comma delimited)
This is a commonly used format to permit data to be imported into a spreadsheet or database: writing the
,” to separate each field on a row. Each row, in addition to the
readings to a text file using a comma “
reading data, includes the reading number, the date and time of the reading and the elapsed time since
the log cycle began. The summary information is displayed at the top of the list. The out of specification
summary is displayed after the list of readings.
.I_ data cannot be read back into this software using this format.
““”
20.3 Formatted Text (Space delimited)
This writes the readings to a text file. Each field in a row of data is placed at a common offset, separated
by spaces. This is a commonly used format to permit the data to be imported into spreadsheet, database
or word-processor software
:w
data cannot be read back into this software using this format.
20.4 SYLK (Svmbolic Link)
This stores the readings as a SYLK file that most spreadsheet programs are capable of loading. Each
row (representing a reading) in the file includes the reading number, the date and time of the reading and
the elapsed time since the log cycle began. The summary information displayed at the top of the list view
and the out of specification summary displayed after the list of readings, are also included in the file.
:w data cannot be read back into this software using this format.
20.5 Text (Tab delimited)
This is a commonly used format to permit the data to be imported in to a spreadsheet, database or
word-processor software application. The summary information displayed at the top of the list view and
the out of specification summary displayed after the list of readings, are also included in the file. This
writes the readings to a text file with a Tab to separate each field on a row. Each row (representing a
reading) in the file includes the reading number, the date and time of the reading and the elapsed time
since the log cycle began
sr4s
.-- data canr lot be read back into this software using this format.
21 Print I ist of readings
toolbar button or select Print from the File menu. OM-MLT
To print data from a logger, click on the
Series Datalogger Software will open Print dialog where you may specify the range of pages to be
printed, the number of copies, the destination printer and other printer setup options.
22 What is FDA 21 CFR Part 11.
The Food and Drug Administration (FDA) issued regulations that provide criteria for acceptance by FDA,
under certain circumstances, of electronic records, electronic signatures, and handwritten signatures
executed to electronic records as equivalent to paper records and handwritten signatures executed on
paper. These regulations, which apply to all FDA program areas, are intended to permit the widest
possible use of electronic technology, compatible with FDA ’s responsibility to promote and protect public
health. Part 11 applies to any record governed by an existing FDA predicate rule that is created, modified,
maintained, archived, retrieved, or transmitted using computers and /or saved on durable storage media.
23 How to achieve FDA 21 CFR Part 11 compliance.
You need to install ‘User Admin Package for Title 21 CFR Part 1 I compliance”, which allows
creation of a database of electronic signatures and their individual responsibilities/abilities.
“User Admin Package for Title 21 CFR Part 11 compliance”is a software product which provides
complete FDA 21 CFR Part 1 Icompliant user login functions, and a comprehensive administrator console.
Business benefits of Part 11 compliance:
. recognizes electronic records as legally equivalent to paper records, thereby eliminating the need for
the maintaining paper based records;
ensures that critical information remains secure and private;
. automation of administrative and manual entry, tracking, audit, and validation processes;
improved ability for the firm to analyze trends, problems, etc., enhancing internal
evaluation and quality control;
reduced costs of storage space
reduced shipping costs for data transmission to FDA
more efficient FDA reviews and approvals of FDA-regulated products;
increased speed of information exchange;
enabling of more advanced searches of information, thus obviating the need for manual paper searches.
??
??
??
??
??
??
??
To get this package, please contact your local distributor.
For more information, please visit this website:
Title 21 Code of Federal Regulations (21 CFR Part 11) Electronic Records; Electronic Signatures
(http://www.fda.~ov/ora/compliance ref/partll/DefauIt.htm)
24 How to get further assistance
To get further information about products or to get further assistance, please contact your local distributor.
25 Frequently Asked Questions (FAQ)
25.1 General Questions
What causes the alarm on the logger to activate?
The alarm will activate when the temperature that the logger records is not within the specified
monitoring range, as defined in the sensor specification step of the programming process.
??
Why does the alarm, Red, LED on the logger still blink even when the logger has finished?
This feature is provided so that you are aware that the logger was in alarm mode when the logger
finished its logging. When monitoring temperature sensitive cargo, for example, this feature is extremely
??
useful to give an immediate indication that the cargo may not be in an acceptable condition. You may
stop the alarm, Red, LED flashing by swiping a magnet over the logger in a similar fashion to starting the
logger.
.Why does the LCD display incorrect sensor readings?
When the logger is programmed to display different sensor readings using an alternate scale, for
example “C instead of “F, then the logger must be instructed on how to display these new values. This
will extend the time involved in transferring program settings to the logger. If this process is not
successfully completed, for example because the logger was removed from the interface while
transferring the new program settings to the logger, then the LCD will appear to display incorrect sensor
readings.
?? There is some funny grease on my humidity logger, why is that?
The only grease deposit on a humidity bung should be around the perimeter of the o-ring, which
is located in the recess of the upper black bung. This will assist un-screwing the lid for battery
replacement in the same way that it assists on the lid o-ring. Any other grease deposit is purely
accidental. Please be careful when you handle the bung during battery replacement, as there MUST not
be any grease deposit on the actual humidity sensor, as it will affect its accuracy and calibration. The
grease we use is DowCorning Molykote 111, which is valve and o-ring lubricant. This is also used on the
battery terminals to prevent corrosion.
?? My humidity logger does not show any sensible humidity or temperature readings, only c-22.2
&
lOO%, but I can program and list OK, what is wrong?
The most likely cause is that you have at some stage removed the bung with the sensors for
battery replacement, and subsequently put it back the wrong way around. Check, that the sensor is
located as in this drawing:
..,.,
.‘
.‘
.‘
.‘
‘
.‘
:\.
.‘
.‘
‘
_‘
.‘
.‘
.
.‘
.‘
‘
.‘
_‘
.‘
.‘
.
>
,_,.
:
I.
j
., .‘
,‘
,,,t .‘
’
~.‘
.“‘
.
1
;,.yy:
;
+.+.
::::.
$’
::::
My logger has LED’s; but the activity LED does not blink, even if the logger is logging, why?
You have turned the beeper off. The LED and the beeper work off the same internal signal. If you
turn the beeper back on, the activity LED will also start blinking again. This is done during the
programming of the logger in the Program and Configuration Wizard (see Programming the logger
Overview) where you can also change the password settings.
??
??
Why are there two different specifications for resolution and accuracy?
Resolution and accuracy are two different things:
Resolution is the smallest interval measurable by a scientific instrument. In the case of Omega
loggers, these are the steps indicated by the temperature table. If two consecutive values in the
table read 5’C and 55°C the resolution is 0.5’C, as the logger can not hold any values (and the
software can not display any values) in-between these two. Even if the real temperature is 5.2OC,
either 5.0°C or 5.5”C will be displayed. The resolution of thermistor based sensors is NOT constant
across the temperature range, as thermistors are a non-linear device.
Accuracy is the degree of refinement in measurement. In case of a logger this is what the
electronics are theoretically capable of achieving, if the resolution was infinitely small. If the true
temperature value was 5.053OC and the electronics have an accuracy of 0.3OC, any value between
4.753’C and 5.353’C is considered within the accuracy of the logger. This does NOT necessarily
mean that the value can also be displayed, as this is again based on the resolution of the
instrument. If the electronics determine that the true temperature value is 5.29OC, in above
example either 5.0°C or 5.5’C will be indicated. The accuracy of the loggers is constant across the
temperature range.
Absolute accuracy (AA) is based on both accuracy (A) and resolution (R) and is (scientifically)
calculated from the square root of the sum of the squared resolution and accuracy.
AA=SQR(RESY + AA2). This is difficult to ascertain, as the resolution of the logger varies with
temperature. In above example AA=SQR(0.5 ”2+0.3 ”2)= SQR(0.25+0.09) = 0.58OC. The true
temperature value can therefore be as much as 0.58OC out from the actual temperature displayed
for the logger still to be considered within specification. As the resolution is coarser at both ends of
the range, this value becomes greater the closer you measure to the end. This is why we
recommend, that if a logger is predominantly used in a specific application the average
temperature of that application should be in the middle of the logger
’s range, where resolution and
with it the capability of displaying an accurate value will be best.
25.2 Computer and Loqqer Communication
The software says it can’t communicate with the logger, or that the logger is responding
incorrectly; what might be the cause?
1. Check to ensure that the logger is placed firmly on the interface.
2. The interface is not, firmly, connected to the computer. Check the connection.
3. There is a foreign substance on the interface and/or logger contacts preventing reliable
contact. See Cleaning Contacts in Chapter 10, Maintenance, for further information.
4. The software is not configured to the serial port in use. Please ensure that the selected
communication port in the Communication Settings dialog (see Chapter 8, User-Definable
Options) is the same as that being used.
5. The battery within the logger is flat and requires replacing.
6. Another serial device, for example an internal fax/modem, is sharing the same address space
and/or interrupt request (IRQ) line.
7. You may require a Serial Port Adapter (see below for further information).
8. You are experiencing communication errors. Please check with your computer vendor to
ensure your communication ports are configured and functioning correctly.
9. The logger has corrupted configuration data, possibly as a result of the electronics being
subjected to an excessive electrostatic discharge or exposure to high EM fields. Logger will
require servicing.
??
I have upgraded to a new computer, but my logger does not communicate any longer, why?
Please make sure that all your communication settings are correct, and also check that no other
serial devices (for example mouse, modem etc) try to access the serial port at the same time as the
OM-MLT Series Datalogger Software software. You may also require a Serial Port Adapter (see
below). Also check that your logger is still working on a different PC. More suggestions for
troubleshooting can be found in the “Diagnostics Form ”.
??
What is a Serial Port Adapter, and why do I need it?
Some of the latest PC ’s may incorporate communications hardware (COM ports), which
implement the RS232 specifications differently to the previous generations of computers (usually to
reduce costs, heat and EM fields). The Omega Junior requires certain signal levels to communicate. We
have therefore developed the Serial Port Adapter, which corrects some of the signal levels to allow
successful communication even to PC ’s with such COM ports. You may experience
“no reply ” messages,
or faulty data are reported to the software like completely wrong serial numbers, wrong temperature
ranges or a wrong logger type. If the same software/logger/interface combination operates successfully
on another PC, you most likely require a Serial Port Adapter.
. Why can the software communicate with my old loggers but not my new one(s)?
The Omega product range is continually being improved upon and new variations are continually
being created. It is very likely that the version of software that you are using is not aware of the new
features included in your new logger(s) and therefore is unable to safely access the logger. To overcome
??
this problem you will need to contact your local distributor to obtain the latest version of the software that
will communicate with the new logger(s).
25.3 Proqramminq loqqers
. I am using the logger in a light sensitive environment, how do I make sure the LED’s always
remain off?
It is possible to ensure the alarm, Red, LED is never activated during a logging period by
ensuring the “Raise alarm on above upper spec readings” and the “Raise alarm on below lower spec
readings” options are disabled. On some models of loggers, the active, Green, LED can be disabled by
disabling the “Beeper On ” option in the “Miscellaneous Settings ” window of the programming
sequence.
My password has changed, but I did not type a new one in; what is wrong?
The password prevents an unauthorised person from overwriting your data. There is no “back
door” into the logger if you forget your password, so please make sure no other person has access to
your password and changes it without your knowledge. If you are sure you have not reprogrammed your
password, you may have inadvertently changed it by entering the Password Setting dialog (see Security
Options), and hitting the “OK” button, rather than the “Cancel” button. In this case the password has
changed to a blank password, and pressing “OK” in the Security Access dialog will get you to the next
dialog box, without having to enter a password. You can then set the password in the normal way.
??
Other possible reasons include:
1. The password within the logger has been corrupted. The software will attempt to reset the
password back to the factory default.
vendor
2. You are experiencing communication errors. Please check with your computer
to ensure your communication ports are configured and functioning correctly.
3. The logger has corrupted configuration data, possibly as a result of the electronics being
subjected to an excessive electrostatic discharge or exposure to high EM fields. The logger will
require servicing.
. Why doesn’t the software recognise the logger?
1 .The current version of software being used was created prior to the version of the logger being
used. You will require the latest version of the software to use this logger.
2.You are experiencing communication errors. Please check with your computer vendor to
ensure your communication ports are configured and functioning correctly.
. The software has reported that the logger has been reprogrammed; why is this important?
1. The software has detected that the logger has been re-programmed after the last set of
readings was logged. Some of the data within the stored readings may not be correct, like the
date and time each reading was taken.
2. You are experiencing communication errors. Please check with your computer vendor to
ensure your communication ports are configured and functioning correctly.
3. The logger has corrupted configuration data, possibly as a result of the electronics being
subjected to an excessive electrostatic discharge or exposure to high EM fields. The logger will
require servicing.
25.4 Usinq loqqers
??
When should I use an external sensor instead of the internal temperature sensor?
1. When the best response time is required. An external sensor will respond to changes in
temperature slightly quicker than an internal sensor. Refer to your logger ’s published
specifications for further details.
2. When the temperature of the environment may not be within the operating temperature limits
of the logger.
3. When the logger cannot be placed within the cargo to be monitored and the temperature within
the cargo is what is to be monitored. An external temperature sensor occupies far less space
than a logger will.
4. When the environment to be monitored is in a non-transparent and/or soundproof area and it is
required to continuously view the status of the logger, like if the logger is in alarm mode. A logger
does not need to be
.
Where is the best place to place the logger and/or the external sensor?
A logger, or external temperature sensor, best functions when placed in a location where
abnormal air currents are not an issue. For example, if you want to monitor the temperature of a room, it
is advisable not to place the logger too close to the door. Otherwise, every time the door is opened the
logger will be subjected to the temperature of the neighbouring room, while the average temperature of
the room may not actually significantly change.
Why are all the readings from the external sensor that the logger took, below the temperature
range of the logger?
The logger was unable to communicate with the external sensor. The most likely reasons include:
1. The sensor was not plugged firmly into the logger, check the connection.
2. There is foreign substance on the external sensor socket or the external sensor plug,
preventing reliable contact.
3. The external sensor assembly is at fault. The external sensor will require servicing, if available
Please contact your distributor for the options.
for this model of sensor, or replacing.
I replaced the battery in the logger, but now the dates and times in my listed report are wrong.
Is there any way to fix this?
1. Program the logger without changing any settings, except make sure that:
a. The logger’s internal date and time are after the logger did, or would have, finished the
last logging cycle.
b. The start logging time is exactly when the first reading was taken.
c. The number of readings to take is the same as the number of readings taken.
Do not start the logger logging otherwise the stored readings will be lost.
2. Create a listed report from the stored readings as per normal and the dates and times of each stored
reading should be correct. You may ignore the warning message that the software will report concerning
that the logger has been re-programmed.
??
??
26 Software registration
At start up of this software you will see the
register or quit.
Registration dialog, which gives you two options
To register, click Register button. This will open for you
License Registration dialog.
License Registration dialog displays:
Program name . name of this software;
Current license - current status of your license;
Restriction - restriction of your license;
Short instruction;
Site Code - code, which should be sent to your local distributor:
Site Key. key, which should be entered to register software.
To e-mail Site Code to your local distributor:
1 .Click Copy button.
2.Create new e-mail message and paste Site Code
3.Send completed message.
into your message.
When you will receive Site Key from your local distributor:
1 .Copy Site Key from e-mail message.
2.ln License Registration dialog click Paste button or type manually
required field.
3.Click OK button.
Software will open for you
Registration dialog with confirmation. Click
You can always check status of your license by choosing
Site Key into
OK button.
License command from Help menu.
27 Warranty
The Omega loggers and ChartReaders have a 36 months warranty valid from date of purchase. In the
event of a malfunction please contact your distributor. The warranty has the following exclusions:
I. If the unit has been modified from manufacturers specifications.
2. Exposure of the logger to temperatures less than -45°C or greater than 85°C unless the
logger is designed for use in temperatures outside this range (for example the Autoclave logger).
3. Loss or damage caused by the ingress of moisture.
4. Evidence that the printed circuit board has been removed or tampered with.
5. Evidence of mistreatment or abuse.
6. Loss of unit.
Batteries are not covered by this warranty.