1
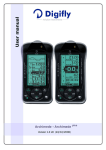
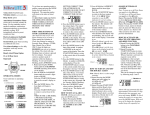
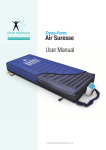
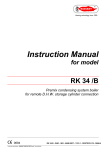
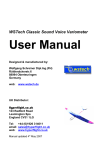
USER MANUAL
1
VL300
FIGURE 1
FIGURE 2
2
USER MANUAL
TABLE OF CONTENTS
1 VL300 GENERAL DESCRIPTION
1.0 Power on
1.1 Contrast Setting
1.2 Main Graphic Variometer
1.3 Sound Variometer
1.4 Average Variometer
1.5 Voltmeter
1.6 Watchdog
1.7 Battery Timer
1.8 Date Indicator
1.9 Screen Number Indicator
1.10 Data Entry
1.11 Polar Recorder
1.12 Maximum Efficency Speed Indicator
2 DESCRIPTION OF PROGRAMMABLE INSTRUMENTS AREA
2.0
2.1
2.2
2.3
2.4
2.5
2.6
2.7
2.8
Description of Programmable Instruments
Graphic Altimeter
Altimeter A1
Altimeters A2 / A3
Clock / Timer
Barometer / Thermometer
Anemometer
Numerical Variometer
Efficiency Indicator
3 DESCRIPTION OF FUNCTION MENU
3.0 Retrieval of Function Menu
3.1 Start
3.2 Set Altimeters
3.3 Set Barograph
3.4 Set Variometers
3.5 Set Timer
3.6 Set Screens
3.7 Moviola
3.8 Diagnostics
3.9 Agenda
3.10 Pilot Data
3.11 Printer and PC
4 TECHNICAL DATA
4.0 Serial Interface
4.1 General Technical Data
3
VL300
1
VL300 GENERAL DESCRIPTION
1.0 Power on
Turn on with the special switch. (FIG. 2 - POS. 13)
Your VL300 will execute a self-check lasting about two seconds, and will then be
ready for flight. The main instruments are displayed.
1.1 Contrast Setting
The display contrast can only be adjusted using keys
and
, if the "START"
function and average variometer (FIG. 2 - POS. K) have been selected.
1.2 Main Graphic Variometer
The main graphic variometer (FIG. 2 - POS. F) normally displays a +5m/sec to -5m/
sec scale.
Higher values can also be shown thanks to automatic change over to a 10 m/sec
scale, providing both numerical and graphic representations (bars go totally dark).
1.3 Sound Variometer
The sound variometer gives out sound signals the frequency of which changes in
accordance with main graphic variometer values. Ascent sounds are very different
from descent sounds:
during ascent, the sound is frequency-modulated with intermittent variable pulse
trains, while during descent the sound is only frequency-modulated.
The sound volume can be adjusted to three different levels using key : off, medium
and high. The volume level is indicated by a flashing circle in the display bottom line:
empty circle = off; half full circle = medium; full circle = high.
Sound ascent and descent thresholds can be set separately (see 3.4).
1.4 Average Variometer
The average variometer (FIG. 2 - POS. K) has the same technical specifications as
the main variometer, except for vertical speed reading, which is in this case an
average value, calculated on the basis of the latest readings (the number of
which
can be programmed).
It is therefore particularly useful for you to understand if you are doing better or worse.
1.5 Voltmeter
The voltmeter shows the battery voltage (FIG. 2 - POS. G).
This voltage should never be lower than 7.5 Volts: if this is the case, an alarm
message is displayed by the VL300 to prevent instruments from reading incorrect
values.
1.6 Watchdog
The watchdog is a monitoring device constantly checking VL300 built-in microcom
puter sound operation. A flashing circle (FIG. 2 POS. H) indicates that everything is
4
USER MANUAL
in order.
1.7 Battery Timer
The battery timer indicates the VL300 operating range hours left (FIG. 2 - POS. I).
WARNING! This timer should be reset whenever the battery is recharged (see 3.5).
1.8 Date Indicator
The date indicator (FIG. 2 POS. L) displays the current date using the day/month/year
format.
1.9 Screen Number Indicator
The screen number indicator shows which one of the three programmable instrument
screens is being used (FIG. 2 POS. M).
1.10 Data Entry
The data recorder is a VL300 built-in device allowing the following data to be stored:
pilot name, aircraft type, takeoff date and time, landing time, 3600 barographic points
and minimum and maximum values reached.
The 3600 barograph points are used to store altimeter A1 readings every n seconds
(1 to 30 second intervals can be selected) up to a total recording time of 30 hours.
Minimum and maximum values are those recorded by altimeter A1, by the anemom
eter, variometer and thermometer.
The data recorder is started by depressing keys
and
one after the other and
can be turned off either using key
and
or automatically - at the end of the
maximum recording time.
When the data recorder is on, the letter “R” (FIG. 2 POS. N)
WARNING! Whenever a new recording is started, the old data is erased. Important
data should therefore be printed or transferred into a personal computer.
1.11 Polar Recorder
1) Select "SET BAROGRAPH".
2) Select choise "5) POLAR".
3) Set 1=POLAR (0=NORMAL).
4) Record data flying in quite air; instead of letter "R" (FIG. 2 - POS. N) will appear
letter "P".
5) Using moviola function you can review polar data; at the bottom of display, for each
point, you can see respectively vertical speed (v), orizontal speed (o), indicated air
speed (i) and efficiency.
1.12 Maximum Efficiency Speed Indicator
To select the maximum efficiency speed indicator push the key
; instead of average
variometer it will appear the maximum efficiency indicator. (fly trying to keep the
graphic bar in the center of graphic scale).
This indicator uses a polar curve given by three parameters (KA, KB,KC); these
5
VL300
parameters must be set depending on wing type.
To set the parameters value you have to:
1) Select "SET BAROGRAPH".
2) Select choise "4 SET K POLAR".
3) Give for each parameter (KA, KB, KC) integer value and decimal value.
During the flight it is possible to set wind speed; this value is shown at the bottom of
and
maximum efficiency speed indicator and it can be changed with the keys
by steps of 5 Km/h. (NOTE: the keys
and
have this function only if it is selected
the maximum efficiency speed indicator - see 1.1).
2
DESCRIPTION OF PROGRAMMABLE INTRUMENTS AREA
2.0 Description of Programmable Instruments
The instruments described hereabove are located in a fixed screen area which
cannot be modified. Another series of instruments can be positioned at will in one of
the five special areas in the right part of the screen (with the exception of the graphic
altimeter, which needs to be positioned in the first two top right areas).
(FIG. 2 - POS. A/B/C/D/E)
By simply depressing key
, you can select one of the 3 five-instrument screens.
The instruments which can be located in each of the 3 mentioned screens are
described in detail herebelow (see 3.6).
2.1 Graphic Altimeter
It graphically displays flight progress using altimeter A1 readings. To enter values on
the X-axis (Sec) and on the Y-axis (m) see 3.3.
2.2 Altimeter A1
Altimeter A1 shows the altitude in m; it has a -300 to +9000 m range and 1 m resolution.
It can be set both in m and in mB (see 3.2).
2.3 Altimeters A2 / A3
Altimeters A2 and A3 have the same characteristics as altimeter A1, but they can also
be reset by simply pressing key
.
If used in this way, they can also be two practical indicators of altitude gain or loss.
Selection of altimeter 2 or 3 is done by depressing key
.
2.4 Clock / Timer
The double-acting clock / timer instrument can show either the current hour/minutes
or the number of minutes which have elapsed after power on. Selection of clock or
timer is done by depressing key
.
6
USER MANUAL
2.5 Barometer / Thermometer
The double-acting barometer / thermometer instrument can show either the atmos
pheric pressure (range: 1050 to 300 mB; resolution: 1 mB) or the VL300 internal
temperature (range: -40 to +90 C degrees; resolution: 0.5 C degrees). Selection
of barometer or thermometer is done by depressing key
.
2.6 Anemometer
The anemometer shows airspeed in km/h with a range from 0 to 120 km/h and a
resolution of 1 km/h.
2.7 Numerical Variometer
The numerical variometer shows vertical speed with a range from +13 m/sec to -13
m/sec and a resolution of 10 cm.
2.8 Efficiency Indicator
The Efficiency Indicator instrument shows wing's istantaneous efficiency during
flight,
calculating the informations given by anemometer, variometer and wind
speed.
The last one can be modified during flight; this value is shown at the bottom of
maximum efficiency speed indicator and it can be changed with the keys
and
by steps of 5 Km/h.(NOTE: the keys
and
have this function only if it is selected
the maximum efficiency speed indicator - see 1.1).
3
DESCRIPTION OF FUNCTION MENU
3.0 Retrieval of Function Menu
The general menu of functions can be retrieved at any time by simply depressing key
. Select by moving the cursor to the desired function using the special keys
or
, then enter your choice with key
.
A description of the available functions is given here below:
3.1 Start
By selecting function Start (1), you can control main screen instrument display.
3.2 Set Altimeters
By selecting function Set Altimeters (2), you can set one of the three VL300 altimeters
in two different ways, i.e. either in m or in mB. Setting an altimeter in meters means
to enter the current altitude value in meters, while setting an altimeter in mB means
entering the pressure of a point with respect to which you wish to find out the
difference in height (meters).
Setting altimeters in mB proves particularly useful during transfer flights and in all
other situations when several aircrafts are flying together, and it is recommendable
7
VL300
that all altimeters be set to the same pressure (ex. 1013 mB).
3.3 Set Barograph
Selection of the Set Barograph function (3) is done to carry out one of the following
operations:
1) Set Sampling, to select the number of seconds bewtween one barograph sampling
and another.
2) Set Window X, to select the number of seconds between one graphic altimeter
updating and another.
3) Set Window Y, to select the value in meters of each point on the graphic altimeter
Y-axis.
4) Set K Polar, to adjust the parameters to create the wing's polar curve.
5) Polar, to select the polar recorder.
3.4 Set Variometers
Selection of the Set Variometers function (4) is done to carry out one of the following
operations
1) Set Inertia to enter a main variometer inertia time value in accordance with current
weather conditions: if weather conditions are weak, use low inertia values to make
the most of the weakest ascent flows; if weather conditions are strong, use high inertia
values to tell true ascent flows from mere turbulence.
2) Set Ascent Threshold to enter an ascent value threshold beyond which the
sound
signal is heard.
3) Set Descent Threshold to enter a descent value threshold beyond which the
sound signal is heard.
4) Set Variometer Average to enter a delay for the calculation of average vertical
speed.
3.5 Set Timer
Selection of the Set Timer function (5) is necessary to execute one of the following
operations:
1) Set Date (to enter today’s date)
2) Set Time (to enter current time)
3) Set Battery Timer to select autonomy time of NiCd rechargeable battery.
Recharge the VL300 battery in the following way:
make sure the VL300 is off and the battery charger is not powered.
Plug the battery charger into the VL300 special outlet. Feed 220 Vac mains voltage
to the battery charger, make sure the red LED is turned on; charging should last for
about 13 hours.
Disconnect the battery charger and perform function Set Battery Timer on your
VL300.
3.6 Set Screens
The Set Screens function (6) is used to choose the instruments to display on the three
screens. Proceed as follows:
a) select a screen to modify from the screen menu
b) enter the desired instrument codes in the special areas shown by the flashing
8
USER MANUAL
D/
cursor then press key
.
Any instrument combination can be entered, except for graphic altimeter (code 01)
which must be located in the first two top right screen areas. (FIG. 2 - POS. A/B/C/
E).
3.7 Moviola
The Moviola function (7) is the VL300 most innovating function as it allows all data
concerning the latest recorded flight to be reviewed on the screen.
The above data can be displayed in two ways:
1) Graphically -If you select this mode, your VL300 will first of all present the whole
flight on its display, independently of flight length. Then you will be able to analyze
every single screen point by simply pressing keys
and
.
For each point in the graphical representation, altitude (in m) and absolute or relative
time values will be shown.
Use key
to shift from absolute to relative time and vice versa. After moving the
cursor to the graph point you wish to magnify, press key
.
When the ZOOM (magnification) is on, the following keys are also enabled:
key
moving the cursor backwards by one page, key
moving the cursor
forwards by one page, keysv
and
centering the graph in the screen, and key
allowing ZOOM amplification parameters to be changed.
There are two ZOOM amplification parameters: the range value to be displayed (in
m) and the sampling time multiplying factor.
To turn off the ZOOM depress key
once more.
To return to the previous menu, press key
.
2) Minima and Maxima - If you select this mode, your VL300 will display a table
containing data concerning the recorded flight, i.e. flight date, takeoff time, landing
time and minimum and max. values reached. Minimum and maximum values are
those recorded by altimeter A1, by the anemometer,variometer and thermometer.
To return to the previous menu, press key
.
3.8 Diagnostics
Function Diagnostics (8) contains advanced tests and a few parametrizations and
should therefore be used by DIGIFLY authorized technicians only.
3.9 Agenda
Selection of the Agenda function (9) is used to display or modify a notebook
containing six lines of maximum 18 alphanumeric characters each.
3.10 Pilot Data
Function Pilot Data (10) is selected to change the aircraft or pilot names. These two
data can contain letters, numbers and gaps up to a maximum of 10 characters each.
9
VL300
3.11 Printer and PC
The Printer and PC function (11) is used to transfer data and information from the
VL300 to peripherals in the following ways:
1) Flight Data Printing - Data concerning the latest recorded flight are sent to either
a terminal emulation PC or a serial printer through a serial gate.
2) Graph Printing - The graphic representation of data concerning the latest
recorded flight is sent to a graphic printer (type EPSON P-40 Serial) through a serial
gate.
3) PC connection - VL300 data is sent to an MS-DOS personal computer. The VL300
is supplied with a floppy disk containing instructions for use and a special data
processing program to enter in your PC. With this specially designed software,all
recorded flights can be transferred, stored on a floppy disk and rerun. An electronic
flight log book can be obtained in this way using a common diskette.
4
TECHNICAL DATA
4.0 Serial Interface
The VL300 serial gate has been set using the following parame ters in accordance
with specifications RS232C: 4800 BAUD 8 DATA BIT NO PARITY 2 STOP BIT.
NB: ALWAYS PLUG CABLES IN WHEN THE EQUIPMENT IS OFF.
10
USER MANUAL
4.1 General Technical data
ALL INSTRUMENTS HAVE BEEN BALANCED TO TEMPERATURE AND AIR DENSITY
Graphic Altimeter
Range
-300 +9000 Mt
Resolution
1 Mt
X e Y Axis
adjustable
Altimeters A1 A2 A3
Range
-300 +9000 Mt
Resolution
1 Mt
can be set in Mt or Mb
Altitude gain / loss
Range
-9000 +9000 Mt
Resolution
1 Mt
Sound Variometer
Range
-13 +13 Mt/Sec
Resolution
0,1 Mt/Sec
Inertia
adjustable
Ascent threshold adjustable
descent threshold adjustable
-40 °C +90 °C
0,5 °C
30 hours
adjustable
-300 +9000 Mt
1 Mt and 1 Sec
Efficientimeter
Numeric Variometer
Range
-13 +13 Mt/Sec
Resolution
0,1 Mt/Sec
Inertia
adjustable
Thermometer
Range
Resolution
Barograph
Max time
Frequency
Range
Resolution
Maximum Efficiency Speed Indicator
Average Variometer
Autorange
-10 +10 Mt/Sec
Resolution
0,1 Mt/Sec
Delay
adjustable
0 120 Km/h
1 Km/h
300 1050 mB
1 mB
Polar Recorder
Graphic Variometer
Autorange
-10 +10 Mt/Sec
Resolution
0,1 Mt/Sec
Inertia
adjustable
Anemometer
Range
Resolution
Barometer
Range
Resolution
Date and Time
Date Format
Hour Format
day / month / year
hours / minutes
Flight Timer
Range
Resolution
0 999 Minutes
1 Minute
Volmeter
Range
Resolution
0 15 Volts
0,1 Volt
Rechargeable Battery
Type
8,4V NiCd
Operating time
12 hours
Recharging
12 hours
Data Batteries
Type
Operating time
2 X 3V Litium
10 years
Dimensions
140 X 115 X 50 mm
Total Weight
900 gr
11
VL300
FIGURE 3
12