1
1
Getting Started
1.1 Introduction
Welcome to ENVIRONMENTALSTATS for S-PLUS! This User’s Manual provides
step-by-step guidance to using this software. ENVIRONMENTALSTATS for
S-PLUS is an S-PLUS module for environmental statistics. This chapter is an introduction to environmental statistics in general and ENVIRONMENTALSTATS for
S-PLUS in particular, and includes information on system and user requirements,
installing the software, loading and using the module, and getting technical support. The last section of the chapter is a tutorial.
1.2 What is Environmental Statistics?
Environmental statistics is simply the application of statistical methods to problems concerning the environment. Examples of activities that require the use of
environmental statistics include:
•
•
•
•
•
Monitoring air or water quality.
Monitoring groundwater quality near a hazardous or solid waste site.
Using risk assessment to determine whether a potentially contaminated
area needs to be cleaned up, and, if so, how much.
Assessing whether a previously contaminated area has been cleaned up
according to some specified criterion.
Using hydrological data to predict the occurrences of floods.
The term “environmental statistics” must also include work done in various
branches of ecology, such as animal population dynamics and general ecological
modeling, as well as other fields, such as geology, chemistry, epidemiology,
oceanography, and atmospheric modeling. This User’s Manual concentrates on
statistical methods to analyze chemical concentrations and physical parameters,
usually in the context of mandated environmental monitoring.
Environmental statistics is a special field of statistics. Probability and statistics deal with situations in which the outcome is not certain. They are built upon
the concepts of a population and a sample from the population. Probability
deals with predicting the characteristics of the sample, given that you know the
characteristics of the population (e.g., the probability of picking an ace out of a
deck of 52 well-shuffled standard playing cards). Statistics deals with inferring
2
1. Getting Started
the characteristics of the population, given information from one or more samples from the population (e.g., after 100 times of randomly choosing a card from
a deck of 20 unknown playing cards and then replacing the card in the deck, no
ace has appeared; therefore the deck probably does not contain any aces).
The field of environmental statistics is relatively young and employs several
statistical methods that have been developed in other fields of statistics, such as
sampling design, exploratory data analysis, basic estimation and hypothesis testing, quality control, multiple comparisons, survival analysis, and Monte Carlo
simulation. Nonetheless, special problems have motivated innovative research,
and both traditional and new journals now report on statistical methods that have
been developed in the context of environmental monitoring. (See the help topic
References: Environmental Statistics—General References for a list of general
text books on environmental statistics.)
In addition, environmental legislation such as the Clean Water Act, the
Clean Air Act, the Comprehensive Emergency Response, Compensation, and
Liability Act (CERCLA), and the Resource and Recovery Act (RCRA) have
spawned environmental regulations and agency guidance documents that mandate or suggest various statistical methods for environmental monitoring (see the
help topic References: Guidance Documents and Regulations).
1.3 What is ENVIRONMENTALSTATS for S-PLUS?
ENVIRONMENTALSTATS for S-PLUS, created by Dr. Steven P. Millard of Probability, Statistics & Information (PSI), is a new comprehensive software package
for environmental statistics. An add-on module to the statistical software package S-PLUS (from Insightful Corporation), it provides a set of powerful yet simple-to-use menu items and functions for performing graphical and statistical
analyses of environmental data. ENVIRONMENTALSTATS for S-PLUS brings the
major environmental statistical methods found in the literature and regulatory
guidance documents into one statistical package, along with an extensive hypertext help system that explains what these methods do, how to use these methods,
and where to find them in the environmental statistics literature. Also included
are numerous built-in data sets from regulatory guidance documents and the environmental statistics literature. ENVIRONMENTALSTATS for S-PLUS, combined
with S+SPATIALSTATS and S-PLUS for ArcView GIS, provide the environmental
scientist, statistician, researcher, and technician with all the tools needed to “get
the job done!”
Because ENVIRONMENTALSTATS for S-PLUS is an S-PLUS module, you
automatically have access to all the features and functions of S-PLUS, including
easy-to-use pull-down menus, powerful graphics, standard hypothesis tests, and
the flexibility of a programming language.
In addition, with
ENVIRONMENTALSTATS for S-PLUS you can:
1.4. Intended Audience/Users
•
•
•
•
•
•
•
•
•
•
•
•
•
•
3
Compute quantities associated with probability distributions (probability density functions, cumulative distribution functions, and quantiles),
and generate random numbers from these distributions. (Several
distributions have been added to the ones already available in S-PLUS.)
Plot probability distributions so you can see how they change with the
value of the distribution parameter(s).
Compute several different kinds of summary statistics.
Estimate distribution parameters and quantiles and compute confidence
intervals for commonly used probability distributions.
Perform and plot the results of goodness-of-fit tests.
Compute optimal Box-Cox data transformations.
Compute parametric and non-parametric prediction and tolerance intervals (including simultaneous prediction intervals).
Perform additional hypothesis tests not already part of S-PLUS, including Chen’s t-test for skewed distributions, Fisher’s one-sample randomization test for location, the quantile test to detect a shift in the tail
of one population relative to another, two-sample linear rank tests, the
von Neumann rank test for serial correlation, and Kendall’s seasonal
test for trend.
Perform power and sample size computations and create associated
plots.
Perform calibration based on a machine signal to determine decision
and detection limits, and report estimated concentrations along with
confidence intervals.
Analyze singly and multiply censored (less-than-detection-limit) data
with empirical cdf and Q-Q plots, parameter/quantile estimation and
confidence intervals, prediction and tolerance intervals, goodness-of-fit
tests, optimal Box-Cox transformations, and two-sample rank tests.
Perform probabilistic risk assessment.
Look up statistical methods in the environmental literature in a hypertext help system that explains the equations, links the equations to the
original reference, includes abstracts of selected references, and contains a glossary of statistical and environmental terms.
Reproduce specific examples in EPA guidance documents by using
built-in data sets from these documents.
1.4 Intended Audience/Users
ENVIRONMENTALSTATS for S-PLUS and this User’s Manual are intended for anyone who has to make sense of environmental data, including statisticians,
environmental scientists, hydrologists, soil scientists, atmospheric scientists,
geochemists, environmental engineers and consultants, hazardous and solid
waste site managers, and regulatory agency analysts and enforcement officers.
Some parts of ENVIRONMENTALSTATS for S-PLUS incorporate statistical meth-
4
1. Getting Started
ods that have appeared in the environmental literature but are not commonly
found in any statistical software package. Some parts are specifically aimed at
users who are required to collect and analyze environmental monitoring data in
order to comply with federal and state Superfund, RCRA, CERCLA, and Subtitle D regulations for environmental monitoring at hazardous and solid waste
sites. All of the functions in ENVIRONMENTALSTATS for S-PLUS, however, are
useful to anyone who needs to analyze environmental data.
ENVIRONMENTALSTATS for S-PLUS is an S-PLUS module. In order to use it,
you need to know how to perform basic operations in S-PLUS, such as using the
pull-down menu or Command and Script Windows, reading data into S-PLUS,
and creating basic data objects (e.g., data frames). See the S-PLUS documentation for more information on S-PLUS. In addition, you need to have a basic
knowledge of probability and statistics. The User’s Manual and the help system
are not meant to be a text book in environmental statistics. See the references
listed in References: Environmental Statistics—General References for a list of
useful books and articles on this subject.
1.5 System Requirements
Because ENVIRONMENTALSTATS for S-PLUS is an S-PLUS module, it runs under
every operating system that S-PLUS runs under, including Windows and UNIX.
Currently only a Windows version is available. Windows users must have
S-PLUS 6.0 in order to run EnvironmentalStats for S-PLUS Version 2.0. The
module requires approximately 20 MB of space on your hard disk.
1.6 Installing ENVIRONMENTALSTATS for S-PLUS
Before you install EnvironmentalStats for S-PLUS, you should make sure you
are using S-PLUS 6.0 or a later version. To determine what version of S-PLUS
you are using, start S-PLUS and either choose Help>About S-PLUS on the
menu, or type version at the S-PLUS prompt. If you are using the Professional version of S-PLUS for Windows, you should see something like the following:
> version
Professional Edition Version 6.0.2 Release 2 for
Microsoft Windows : 2001
To install ENVIRONMENTALSTATS for S-PLUS, close all Windows applications,
and then simply run the Setup program included on the ENVIRONMENTALSTATS
for S-PLUS distribution CD. To leave Setup before the setup is complete, select
Cancel from any Setup dialog box. When you do this, Setup displays an exit
dialog box that warns you that you have not completed the setup procedure.
1.7. Starting EnvironmentalStats for S-Plus
5
1.7 Starting ENVIRONMENTALSTATS FOR S-PLUS
To start ENVIRONMENTALSTATS for S-PLUS, you must have already started
S-PLUS. You can load the module either from the menu or from the Command
Window.
•
•
To load the module from the menu, on the S-PLUS menu bar make the
following selections: File>Load Module. This brings up the Load
Module dialog box. In the Module box, select envstats. For the Action buttons, select Load Module. Make sure the Attach at top of
search list box is checked. Click OK.
To load the module from the Command Window, type
module(envstats) at the S-PLUS prompt.
Loading the module adds the EnvironmentalStats menu to the S-PLUS menu
bar and also attaches the library of ENVIRONMENTALSTATS for S-PLUS functions
to the second position in your search list (S-PLUS Professional users can type
search() at the S-PLUS prompt to see the listing of directories on the search
list). S-PLUS Standard and S-PLUS Professional users can access functions via
the ENVIRONMENTALSTATS for S-PLUS pull-down menu. S-PLUS Professional
users can access any of the functions in the ENVIRONMENTALSTATS for S-PLUS
module via the command line as well.
Note: Some of the functions in ENVIRONMENTALSTATS for S-PLUS mask
built-in S-PLUS functions. The masked functions are modified versions of the
built-in functions and have been created to support the other functions in
ENVIRONMENTALSTATS for S-PLUS, but the modifications should not affect
normal use of S-PLUS. If you experience unexpected behavior of S-PLUS after
attaching ENVIRONMENTALSTATS for S-PLUS, try unloading the module (see
Unloading ENVIRONMENTALSTATS for S-PLUS below). All of the functions in
ENVIRONMENTALSTATS for S-PLUS, whether they mask built-in functions or not,
are described in the help system.
1.8 Getting Help
You may start the help system for ENVIRONMENTALSTATS for S-PLUS in one of
five ways:
1.
2.
3.
4.
On the menu bar, select Help>Available Help>EnvironmentalStats.
On the menu bar, go to the EnvironmentalStats menu and select an
item. A dialog box will be displayed. In the lower right-hand corner
click on the Help button.
At the command line, type help(module="envstats").
At the command line, use the ? operator and help function just as you
do in S-PLUS. For example, type ?pdfplot to call up the help file for
the pdfplot function.
6
1. Getting Started
5.
Outside of S-PLUS, select Start>Programs>S-PLUS 6.0 Professional>EnvironmentalStats, or in the S-PLUS program group doubleclick the ENVIRONMENTALSTATS icon.
In the Table of Contents, you will see the main help categories, including
Pull-Down Menu, Functions, Datasets, References, and Glossary. You can access the help files for functions by category or alphabetically, and you can access data sets by source or alphabetically.
The help system for ENVIRONMENTALSTATS for S-PLUS is a separate application from the help system for S-PLUS. Words that are underlined and highlighted in color (green or blue or whatever color your help system uses for
jumps) are jumps to other help windows within the ENVIRONMENTALSTATS for
S-PLUS help system. In each help file, if a word appears under the paragraph
heading SEE ALSO but is not underlined and highlighted, you must use the
S-PLUS help system to look up this word.
For example, in the help system for ENVIRONMENTALSTATS for S-PLUS, in
the Table of Contents choose Functions>Functions by Category. This will
bring up the help file EnvironmentalStats for S-PLUS Functions By Category.
Click on Plotting Probability Distributions and then click on pdfplot. Within
that help file, under the paragraph heading SEE ALSO, you will see:
.Distribution.frame, Probability Distributions and Random
Numbers, cdfplot, ecdfplot, qqplot, qqplot.gestalt,
plot, plot.default, par, title.
You can access the help files for .Distribution.frame, Probability
Distributions and Random Numbers, cdfplot, ecdfplot,
qqplot, and qqplot.gestalt directly by simply clicking on these words.
To look at the help file for the functions plot, plot.default, par, and
title, however, you must use the S-PLUS help system.
1.9 Customizing ENVIRONMENTALSTATS for S-PLUS
If you plan to use ENVIRONMENTALSTATS for S-PLUS extensively, you may
want to customize your S-PLUS startup routine to automatically attach the
ENVIRONMENTALSTATS for S-PLUS module each time you start S-PLUS. S-PLUS
Professional users can do this by adding the line module(envstats) to your
.First function. If you do not have a .First function, you can create one
by simply typing the following command:
> .First <- function() {module(envstats)}
If you want to automatically attach the ENVIRONMENTALSTATS for S-PLUS
module each time you start S-PLUS and start the ENVIRONMENTALSTATS for
S-PLUS help system, make sure your .First function includes the following
lines:
1.10. Unloading EnvironmentalStats for S-Plus
7
module(envstats)
help(module="envstats")
If you are going to use ENVIRONMENTALSTATS for S-PLUS for several different projects, it is a good idea to use separate directories for each project. See the
S-PLUS documentation for how to create separate “Chapters” and have S-PLUS
ask you which directory you want to work in when you start S-PLUS.
1.10 Unloading ENVIRONMENTALSTATS for S-PLUS
To remove the ENVIRONMENTALSTATS for S-PLUS module from your S-PLUS
session, S-PLUS Professional users can simply type the following command at
the S-PLUS prompt:
> module(envstats, unload=T)
This command removes the ENVIRONMENTALSTATS for S-PLUS menu from the
S-PLUS menu bar and the library of ENVIRONMENTALSTATS for S-PLUS functions from your search list.
1.11 A Tutorial
This section is a brief tutorial that highlights some of the major features of
ENVIRONMENTALSTATS for S-PLUS. There are several ways to use this section.
If you are fairly new to S-PLUS, you may want to briefly skim this section to get
an idea of what you can do in ENVIRONMENTALSTATS for S-PLUS, and then
come back later after you have read the other chapters of this manual. If you
have used S-PLUS for a long time and have just installed ENVIRONMENTALSTATS
for S-PLUS, you may want to follow this tutorial in depth right now to get acquainted with some of the features available in this S-PLUS module. Throughout
this section we assume you have started S-PLUS and also loaded
ENVIRONMENTALSTATS for S-PLUS.
1.11.1 The TcCB Data
The guidance document Statistical Methods for Evaluating the Attainment of
Cleanup Standards, Volume 3: Reference-Based Standards for Soils and Solid
Media (USEPA, 1994b, pp.6.22-6.25) contains measures of 1,2,3,4Tetrachlorobenzene (TcCB) concentrations (ppb) from soil samples at a Reference site and a Cleanup area. There are 47 observations from the Reference site
and 77 in the Cleanup area. These data are stored in the data frame
epa.94b.tccb.df (see the help file Datasets: USEPA (1994b)). There is
one observation coded as “ND” in this data set as presented in the guidance
document. Here, we’ll assume this observation is less than the smallest ob-
8
1. Getting Started
served value, which is 0.09 ppb. For the purposes of this tutorial, we’ll set this
one censored observation to the assumed detection limit of 0.09.
To look at the raw data, open the Object Explorer Window, click on the Find
Objects button (binoculars icon), type epa.94b.tccb.df and click OK. In the
Object Explorer Window, under the Object column, double-click on
epa.94b.tccb.df. This will bring up a data sheet. Alternatively, in the Command Window, type epa.94b.tccb.df:
> epa.94b.tccb.df
TcCB.orig
TcCB Censored
Area
1
0.22
0.22
F Reference
2
0.23
0.23
F Reference
.
124
168.64 168.64
F Cleanup
For the remainder of this tutorial, we will assume that you have attached the
data frame epa.94b.tccb.df to your search list with the following command:
> attach(epa.94b.tccb.df)
Note that if you are only going to follow the instructions for using the Menu you
do not have to execute the above command.
1.11.2 Computing Summary Statistics
The summary statistics for the TcCB data are shown below.
Cleanup Reference
Sample Size: 77
47
# Missing:
0
0
Mean:
3.915
0.5985
Median:
0.43
0.54
10% Trimmed Mean:
0.6846
0.5728
Geometric Mean:
0.5784
0.5382
Skew:
7.717
0.9019
Kurtosis: 62.67
0.132
Min:
0.09
0.22
Max: 168.6
1.33
Range: 168.6
1.11
1st Quartile:
0.23
0.39
3rd Quartile:
1.1
0.75
Standard Deviation: 20.02
0.2836
Geometric Standard Deviation:
3.898
1.597
Interquartile Range:
0.87
0.36
Median Absolute Deviation:
0.3558
0.2669
Coefficient of Variation:
5.112
0.4739
1.11. A Tutorial
9
These summary statistics indicate that the observations for the Cleanup area are
extremely skewed to the right. The medians for the two areas are about the
same, but the mean for the Cleanup area is much larger, indicating a few or
more “outlying” observations with large values. This may be indicative of residual contamination that was missed during the cleanup process.
Menu
To produce summary statistics for the original TcCB data using the
ENVIRONMENTALSTATS pull-down menu, follow these steps.
1.
2.
3.
4.
5.
Open the Object Explorer. If epa.94b.tccb.df is not visible in the Object Column, click on the Find S-PLUS Objects button (the binoculars
icon) and in the Pattern box type epa.94b.tccb.df, then click OK.
Highlight the shortcut epa.94b.tccb.df in the Object column of the Object Explorer.
On the S-PLUS menu bar, make the following menu choices:
EnvironmentalStats>EDA>Summary Statistics. This will bring up
the Full Summary Statistics dialog box.
In the Data Set box, select or type epa.94b.tccb.df is selected. In the
Variable(s) box, choose TcCB. In the Grouping Variables box, select
Area.
Click OK or Apply.
Command
To produce summary statistics for the original TcCB data using the S-PLUS
Command or Script Window, type this command:
> full.summary(split(TcCB, Area))
1.11.3 Looking at the TcCB Data with Histograms and Boxplots
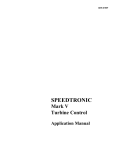
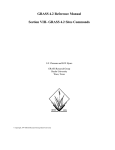
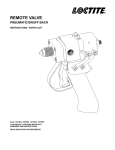
Figure 1.1 shows the histograms for the TcCB concentrations in the Reference
and Cleanup areas. Figure 1.2 shows side-by-side boxplots comparing the distribution of TcCB concentrations in the two areas. Both graphs display concentrations on the log scale. We see in these plots that most of the observations in
the Cleanup area are comparable to (or even smaller than) the observations in
the Reference area, but there are a few very large “outliers” in the Cleanup area.
Menu
To produce the histograms and boxplots for the log-transformed TcCB data using the S-PLUS pull-down menu, it will simplify things if we first make a new
data frame called new.epa.94b.tccb.df to contain the original data and
the log-transformed TcCB observations.
To create the data frame
new.epa.94b.tccb.df, follow these steps.
10
1. Getting Started
6
4
2
0
Number of Observations
8
Histogram for Reference Area
-2
0
2
4
log [ TcCB (ppb) ]
6
4
2
0
Number of Observations
8
Histogram for Cleanup Area
-2
0
2
4
log [ TcCB (ppb) ]
Figure 1.1. Histograms comparing TcCB concentrations at Reference and Cleanup
areas.
2
-2
0
log [ TcCB (ppb) ]
4
Boxplots for Log-Transformed TcCB Data
Cleanup
Reference
Area
Figure 1.2. Boxplots comparing TcCB concentrations at Reference and Cleanup areas.
1.11. A Tutorial
1.
2.
3.
4.
5.
11
Highlight the shortcut epa.94b.tccb.df in the Object column of the Object Explorer.
On the S-PLUS menu bar, make the following menu choices:
Data>Transform. This will bring up the Transform dialog box.
In the Target Column box, type log.TcCB. In the Variable box, choose
TcCB. In the Function box choose log.
Click on the Add button, then click OK. At this point, you will get a
warning message telling you that you have created a new copy of the
data frame epa.94b.tccb.df that masks the original copy. Close
the message window. Also, the modified data frame pops up in a data
window. Close the data window.
In the left-hand column of the Object Explorer, click on the Data
folder. In the right-hand column of the Object Explorer, right-click on
epa.94b.tccb.df and choose Properties. In the Name box rename this
data frame to new.epa.94b.tccb.df and click OK.
To produce the histograms shown in Figure 1.1 using the S-PLUS pull-down
menus or toolbars, follow these steps.
1.
2.
3.
4.
5.
6.
In the Object Explorer, highlight the Data folder in the left-hand column. In the right-hand (Object) column, left-double-click the shortcut
new.epa.94b.tccb.df. This will bring up a data window.
On the S-PLUS menu bar, make the following menu choices:
Graph>2D Plot. This will bring up the Insert Graph dialog box. Under the Axes Type column, Linear should be highlighted. Under the
Plot Type column, select Histogram and click OK. (Alternatively,
left-click on the 2D Plots button, then left-click on the Histogram button.)
The Histogram/Density dialog box should appear. Under the Data Columns group, in the Data Set box, select new.epa.94b.tccb.df. Under
the Data Columns group, in the x Columns box, choose log.TcCB.
Click on the Options tab. Under Histogram Specs, in the Output Type
box, select Density. For Lower Bound type −2.5. For Interval Width
type 0.5.
Click OK. A histogram of the data for both areas is displayed in a
graphsheet.
Click on the data window to bring it forward. Left click on the top of
the Area column to highlight that column, then left-click in a cell of the
column, then drag the column to the top of the graphsheet and drop it.
To produce the boxplots shown in Figure 1.2 using the S-PLUS pull-down
menus or toolbars, follow these steps.
1.
On the S-PLUS menu bar, make the following menu choices:
Graph>2D Plot. This will bring up the Insert Graph dialog box. Under the Axes Type column, Linear should be highlighted. Under the
Plot Type column, select Boxplot and click OK. (Alternatively, leftclick on the 2D Plots button, then left-click on the Box button.)
12
1. Getting Started
2.
3.
The Boxplot dialog box should appear. The Data Set box should display new.epa.94b.tccb.df. In the x Columns box, choose Area. In the
y Columns box, choose log.TcCB.
Click OK.
Command
To produce the histograms shown in Figure 1.1 using the S-PLUS Command or
Script Window, type these commands.
> par(mfrow=c(2,1))
> hist(log(TcCB[Area=="Reference"]),
xlim=range(log(TcCB)), xlab="log [ TcCB (ppb) ]",
ylab="Number of Observations",
main="Histogram for Reference Area")
> hist(log(TcCB[Area=="Cleanup"]), xlim=range(log(TcCB)),
nclass=25, xlab="log [ TcCB (ppb) ]",
ylab="Number of Observations",
main="Histogram for Cleanup Area")
To produce the boxplots shown in Figure 1.2 using the S-PLUS Command or
Script Window, type these commands:
> boxplot(split(log(TcCB), Area), xlab="Area",
ylab="log [ TcCB (ppb) ]",
main="Boxplots for Log-Transformed TcCB Data")
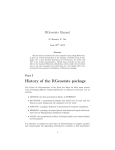
1.11.4 Quantile (Empirical CDF) Plots
Figure 1.3 shows the quantile plot, also called the empirical cumulative distribution function (cdf) plot, for the Reference area TcCB data. You can easily pick
out the median as about 0.55 ppb and the quartiles as about 0.4 ppb and 0.75 ppb
(compare these numbers to the ones listed on page 8). You can also see that the
quantile plot quickly rises, then pretty much levels off after about 0.8 ppb, which
indicates that the data are skewed to the right (see the histogram for the Reference area data in Figure 1.1).
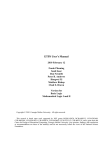
Figure 1.4 shows the quantile plot with a fitted lognormal distribution. We
see that the lognormal distribution appears to fit these data quite well. Figure
1.5 compares the empirical cdf for the Reference area with the empirical cdf for
the Cleanup area for the log-transformed TcCB data. As we saw with the histograms and boxplots, the Cleanup area has quite a few extreme values compared
to the Reference area.
1.11. A Tutorial
13
0.6
0.4
0.0
0.2
Cumulative Probability
0.8
1.0
Quantile Plot for Reference Area TcCB Data
0.2
0.4
0.6
0.8
1.0
1.2
TcCB (ppb)
Figure 1.3. Quantile plot of Reference area TcCB data.
0.6
0.4
0.0
0.2
Cumulative Probability
0.8
1.0
Empirical CDF for Reference Area TcCB (solid line)
with Fitted Lognormal CDF (dashed line)
0.2
0.4
0.6
0.8
1.0
1.2
Order Statistics for Reference Area TcCB (ppb)
Figure 1.4. Empirical cdf of Reference area TcCB data compared to a lognormal cdf.
14
1. Getting Started
0.6
0.4
0.0
0.2
Cumulative Probability
0.8
1.0
CDF for Reference Area (solid line)
with CDF for Cleanup Area (dashed line)
-2
0
2
4
Order Statistics for log [ TcCB (ppb) ]
Figure 1.5. Quantile plots comparing log-transformed TcCB data at the Reference and
Cleanup areas.
Menu
To produce the quantile plot of the Reference area TcCB data shown in Figure
1.3 using the ENVIRONMENTALSTATS for S-PLUS pull-down menu, follow these
steps.
1.
2.
3.
4.
In the Object Explorer, highlight the Data folder in the left-hand column. In the right-hand (Object) column, highlight the shortcut
new.epa.94b.tccb.df for the version of this data frame that you created
earlier.
On the S-PLUS menu bar, make the following menu choices:
EnvironmentalStats>EDA>CDF Plot>Empirical CDF. This will
bring up the Plot Empirical CDF dialog box.
The Data Set box should display new.epa.94b.tccb.df. In the Variable(s) box, choose TcCB. In the Subset Rows with box, type
Area=="Reference".
Click OK.
To produce the quantile plot shown in Figure 1.4 comparing the Reference
area TcCB data to a lognormal distribution, follow these steps.
1.
On the S-PLUS menu bar, make the following menu choices:
EnvironmentalStats>EDA>CDF Plot>Compare Two CDFs. This
will bring up the Compare Two CDFs dialog box.
1.11. A Tutorial
2.
3.
15
The Data Set box should display new.epa.94b.tccb.df. In the x Variable box, choose TcCB. In the Subset Rows with box, type
Area=="Reference". Under the Distribution Information Group,
make sure that the Estimate Parameters box is checked. In the Distribution box, select Lognormal.
Click OK or Apply.
To produce the quantile plot shown in Figure 1.5 comparing the logtransformed Reference area TcCB data to the log-transformed Cleanup area
TcCB data, follow these steps.
1.
2.
3.
On the S-PLUS menu bar, make the following menu choices:
EnvironmentalStats>EDA>CDF Plot>Compare Two CDFs. This
will bring up the Compare Two CDFs dialog box.
For the Compare Data to choice, select Other Data. The Data Set box
should display new.epa.94b.tccb.df. In the Variable 1 box, choose
log.TcCB. In the Variable 2 box, choose Area. Click on the Variable
2 is a Grouping Variable box to check it.
Click OK or Apply.
Command
To produce the quantile plot of the Reference area TcCB data shown in
Figure 1.3, type the following command.
> ecdfplot(TcCB[Area=="Reference"], xlab="TcCB (ppb)",
main="Quantile Plot for Reference Area TcCB Data")
To produce the quantile plot shown in Figure 1.4 comparing the Reference area
TcCB data to a lognormal distribution, type the following command.
> cdf.compare(TcCB[Area=="Reference"], dist="lnorm",
xlab="Order Statistics for Reference Area TcCB
(ppb)", main=paste("Empirical CDF for ",
"Reference Area TcCB (solid line)\n",
"with Fitted Lognormal CDF (dashed line)", sep=""))
To produce the quantile plot shown in Figure 1.5 comparing the log-transformed
Reference area TcCB data to the log-transformed Cleanup area TcCB data, type
the following command.
> cdf.compare(log(TcCB[Area=="Reference"]),
log(TcCB[Area=="Cleanup"]),
xlab="Order Statistics for log [ TcCB (ppb) ]",
main=paste("CDF for Reference Area (solid line)",
"with CDF for Cleanup Area (dashed line)",
sep="\n"))
16
1. Getting Started
1.11.5 Assessing Goodness-of-Fit with Quantile-Quantile Plots
Figure 1.6 displays the normal Q-Q plot for the log-transformed Reference area
TcCB data (i.e., we are assuming these data come from a lognormal distribution), along with a fitted least squares line. Figure 1.7 displays the corresponding Tukey mean-difference Q-Q plot. As we saw with the quantile plot, the lognormal model appears to be a fairly good fit to these data.
Menu
To create the normal Q-Q plot for the log-transformed Reference area data
shown in Figure 1.6, follow these steps.
1.
2.
3.
4.
5.
In the Object Explorer, highlight the Data folder in the left-hand column. In the right-hand (Object) column, highlight the shortcut
epa.94b.tccb.df.
On the S-PLUS menu bar, make the following menu choices:
EnvironmentalStats>EDA>Q-Q Plot>Q-Q Plot. This will bring up
the Q-Q Plot dialog box.
The Data Set box should display epa.94b.tccb.df. In the x Variable
box, choose TcCB.
In the Subset Rows with box, type
Area=="Reference". In the Distribution box, make sure Lognormal
is selected.
Click on the Plotting tab. Click on the Add a Line box to select this
option.
Click OK or Apply.
To create the Tukey mean-difference Q-Q plot for the Reference area TcCB
data fitted to a normal distribution shown in Figure 1.7, follow the same steps as
above, but in Step 3 also check the Estimate Parameters box, and in Step 4 under Plot Type select Tukey M-D.
Command
To produce the Q-Q plot of the Reference area TcCB data fitted to a lognormal
distribution shown in Figure 1.6, type the following command.
> qqplot(TcCB[Area=="Reference"], dist="lnorm",
add.line=T, ylab="Quantiles of log [ TcCB (ppb) ]",
main=paste("Normal Q-Q Plot for",
"Log-Transformed Reference Area TcCB Data"))
To create the Tukey mean-difference Q-Q plot for the Reference area data fitted
to a lognormal distribution shown in Figure 1.7, type the following command.
> qqplot(TcCB[Area=="Reference"], dist="lnorm",
plot.type="Tukey", estimate.params=T, add.line=T,
main=paste("Tukey Mean-Difference Q-Q Plot for",
1.11. A Tutorial
17
"\nReference Area TcCB Fitted to ",
"Lognormal Distribution", sep=""))
-0.5
-1.0
-1.5
Quantiles of log [ TcCB (ppb) ]
0.0
Normal Q-Q Plot for Log-Transformed Reference Area TcCB Data
-2
-1
0
1
2
Quantiles of Normal(mean = 0, sd = 1)
Figure 1.6. Normal Q-Q plot for the log-transformed Reference area TcCB data.
0.5
0.0
-0.5
-1.0
Observed - Fitted Quantiles
1.0
Tukey Mean-Difference Q-Q Plot for
Reference Area TcCB Fitted to Lognormal Distribution
-1.5
-1.0
-0.5
0.0
Mean of Observed and Fitted Quantiles
Figure 1.7. Tukey mean-difference Q-Q plot for the Reference area TcCB data fitted to
a lognormal distribution.
18
1. Getting Started
1.11.6 Estimating Distribution Parameters
In ENVIRONMENTALSTATS for S-PLUS you can estimate parameters for several
parametric distributions. For example, for the lognormal distribution, you can
estimate the mean and standard deviation based on the log-transformed data, or
you can estimate the mean and coefficient of variation based on the original
data. For either parameterization, you can compute a confidence interval for the
mean. Here are the results for the log-transformed Reference area TcCB data:
Results of Distribution Parameter Estimation
-------------------------------------------Assumed Distribution:
Lognormal
Estimated Parameter(s):
meanlog = -0.6195712
sdlog
= 0.467953
Estimation Method:
mvue
Data:
TcCB[Area=="Reference"]
Sample Size:
47
Confidence Interval for:
meanlog
Confidence Interval Method:
Exact
Confidence Interval Type:
two-sided
Confidence Level:
95%
Confidence Interval:
LCL = -0.7569673
UCL = -0.4821751
and here are the results for the original Reference area TcCB data:
Results of Distribution Parameter Estimation
-------------------------------------------Assumed Distribution:
Lognormal
Estimated Parameter(s):
mean = 0.5989072
cv
= 0.4899539
Estimation Method:
mvue
Data:
TcCB[Area=="Reference"]
Sample Size:
47
Confidence Interval for:
mean
1.11. A Tutorial
Confidence Interval Method:
Land
Confidence Interval Type:
two-sided
Confidence Level:
95%
Confidence Interval:
LCL = 0.5243786
UCL = 0.7016992
19
Menu
To compute the estimated mean and standard deviation for the log-transformed
Reference area TcCB data, follow these steps.
1.
2.
3.
4.
5.
On the S-PLUS menu bar, make the following menu choices:
EnvironmentalStats>Estimation>Parameters. This will bring up the
Estimate Distribution Parameters dialog box.
For Data to Use, make sure the Pre-Defined Data button is selected.
In the Data Set box, select or type epa.94b.tccb.df. In the Variable
box, select TcCB.
In the Subset Rows with box, type
Area=="Reference".
In the Distribution/Estimation section, in the Distribution box select
Lognormal, and for Estimation Method select mvue.
Under the Confidence Interval section, check the Confidence Interval
box. In the CI Type box, select two-sided. In the CI Method box, select exact. In the Confidence Level (%) box, select 95.
Click OK or Apply.
To compute the estimated mean and coefficient of variation for the original
Reference area TcCB data, follow the same steps above, but in Step 3 for Distribution select Lognormal (Alternative) and in Step 4 for CI Method select land.
Command
To compute the estimated mean and standard deviation for the log-transformed
Reference area TcCB data, type this command:
> elnorm(TcCB[Area=="Reference"], ci=T)
To compute the estimated mean and coefficient of variation for the original Reference area TcCB data, type this command:
> elnorm.alt(TcCB[Area=="Reference"], ci=T)
1.11.7 Testing for Goodness of Fit
ENVIRONMENTALSTATS for S-PLUS contains several new or modified S-PLUS
menu items and functions for testing goodness of fit. Here we will use the
Shapiro-Wilk test to test the adequacy of a lognormal model for the Reference
area TcCB data.
20
1. Getting Started
Results of Goodness-of-Fit Test
------------------------------Test Method:
Shapiro-Wilk GOF
Hypothesized Distribution:
Lognormal
Estimated Parameter(s):
meanlog = -0.6195712
sdlog
= 0.467953
Estimation Method:
mvue
Data:
TcCB.ref
Sample Size:
47
Test Statistic:
W = 0.9789915
Test Statistic Parameter:
n = 47
P-value:
0.5512532
Alternative Hypothesis:
True cdf does not equal
Lognormal Distribution.
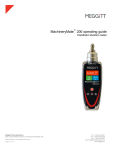
ENVIRONMENTALSTATS for S-PLUS also contains a plotting method for the
results of goodness-of-fit tests, as well as a function or menu choice to produce
four summary plots on one page, as shown in Figure 1.8.
Menu
To perform the Shapiro-Wilk goodness-of-fit test for lognormality on the Reference area TcCB data and produce a summary plot of the results, follow these
steps.
1.
2.
3.
On the S-PLUS menu bar, make the following menu choices:
EnvironmentalStats>Hypothesis Tests>GOF Tests>One Sample>Shapiro-Wilk. This will bring up the Shapiro-Wilk GOF Test
dialog box.
For Data to Use, select Pre-Defined Data. For Data Set make sure
epa.94b.tccb.df is selected, for Variable select TcCB, and in the Subset Rows with box type Area=="Reference". In the Distribution box
select Lognormal.
Click on the Plotting tab. Under Plotting Information, in the Significant Digits box select 3, then click OK or Apply.
Command
To perform the Shapiro-Wilk goodness-of-fit test for lognormality on the Reference area TcCB data, type these commands.
1.11. A Tutorial
21
> TcCB.ref <- TcCB[Area=="Reference"]
> sw.list <- sw.gof(TcCB.ref, dist="lnorm")
> sw.list
To produce a summary plot of the results, type this command.
> plot.gof.summary(sw.list, digits=3)
Results of Shapiro-Wilk GOF Test for TcCB.ref
0.0
Cumulative Probability
0.2 0.4 0.6 0.8
Relative Frequency
0.5
1.0
1.5
0.0
0.2
Quantiles of Log[TcCB.ref]
-1.5
-1.0
-0.5
0.0
0.5
Empirical CDF for TcCB.ref (solid line)
with Fitted Lognormal CDF (dashed line)
1.0
Histogram of Observed Data
with Fitted Lognormal Distribution
0.4
0.6
0.8
TcCB.ref
1.0
1.2
1.4
Quantile-Quantile Plot
with 0-1 Line
0.2
0.4
0.6
0.8
1.0
1.2
Order Statistics for TcCB.ref and
Lognormal(meanlog=-0.62, sdlog=0.468) Distribution
Results of Shapiro-Wilk GOF
Hypothesized
Distribution:
Estimated Parameters:
Data:
Sample Size:
Test Statistic:
Test Statistic Parmeter:
P-value:
-1.5
-1.0
-0.5
0.0
Quantiles of Normal(mean = -0.62, sd = 0.468)
Lognormal
meanlog = -0.62
sdlog = 0.468
TcCB.ref
47
W = 0.979
n = 47
0.551
0.5
Figure 1.8. Summary plots of Shapiro-Wilk goodness-of-fit test for Reference area
TcCB data.
1.11.8 Estimating Quantiles and Computing Confidence Limits
ENVIRONMENTALSTATS for S-PLUS contains a menu item and functions for estimating quantiles and optionally constructing confidence limits for the quantiles. Here we will estimate the 90th percentile of the distribution of the Reference area TcCB, assuming the true distribution is a lognormal distribution, and
compute a 95% confidence interval for this 90th percentile.
Menu
To estimate the 90th percentile and compute a two-sided 95% confidence interval for this percentile, follow these steps.
22
1. Getting Started
1.
2.
3.
4.
5.
6.
On the S-PLUS menu bar, make the following menu choices:
EnvironmentalStats>Estimation>Quantiles. This will bring up the
Estimate Distribution Quantiles dialog box.
For Data to Use, make sure the Pre-Defined Data button is selected.
In the Data Set box, select epa.94b.tccb.df. In the Variable box, select
TcCB. In the Subset Rows with box, type Area=="Reference".
In the Quantile(s) box, select 0.90.
Under the Distribution/Estimation group, for Type, select the Parametric button. In the Distribution box, select Lognormal. For Estimation Method, select qmle.
Under the Confidence Interval group, make sure the Confidence Interval box is checked. For CI Type, select two-sided. For CI Method,
select exact. For Confidence Level (%), select 95.
Click OK or Apply.
Command
To estimate the 90th percentile and compute a two-sided 95% confidence interval for this percentile, type this command.
> eqlnorm(TcCB[Area=="Reference"], p=0.9, ci=T)
Results of Distribution Parameter Estimation
-------------------------------------------Assumed Distribution:
Lognormal
Estimated Parameter(s):
meanlog = -0.6195712
sdlog
= 0.467953
Estimation Method:
mvue
Estimated Quantile(s):
90'th %ile = 0.9803307
Quantile Estimation Method:
qmle
Data:
TcCB[Area=="Reference"]
Sample Size:
47
Confidence Interval for:
90'th %ile
Confidence Interval Method:
Exact
Confidence Interval Type:
two-sided
Confidence Level:
95%
Confidence Interval:
LCL = 0.8358791
UCL = 1.215498
1.11. A Tutorial
23
1.11.9 Comparing Two Distributions Using Nonparametric Tests
ENVIRONMENTALSTATS for S-PLUS contains menu items and functions for performing general two-sample linear rank tests (to test for a shift in location) and a
special quantile test that tests for a shift in the tail of one of the distributions. In
this example we will compare the Reference and Cleanup area TcCB data. Here
are the results for the Wilcoxon rank sum test.
Results of Hypothesis Test
-------------------------Null Hypothesis:
Fy(t) = Fx(t)
Alternative Hypothesis:
Fy(t) > Fx(t) for at least one t
Test Name:
Two-Sample Linear Rank Test:
Wilcoxon Rank Sum Test
Based on Normal Approximation
Data:
x = TcCB[Area == "Cleanup"]
y = TcCB[Area == "Reference"]
Sample Sizes:
nx = 77
ny = 47
Test Statistic:
z = -1.171872
P-value:
0.8793758
and here are the results for the quantile test
Results of Hypothesis Test
-------------------------Null Hypothesis:
e = 0
Alternative Hypothesis:
Tail of Fx Shifted to Right of
Tail of Fy.
0 < e <= 1, where
Fx(t) = (1-e)*Fy(t) + e*Fz(t),
Fz(t) <= Fy(t) for all t,
and Fy != Fz
Test Name:
Quantile Test
Data:
x = TcCB[Area=="Cleanup"]
y = TcCB[Area=="Reference"]
Sample Sizes:
nx = 77
ny = 47
24
1. Getting Started
Test Statistics:
k (# x obs of r largest) = 9
r
= 9
Test Statistic Parameters:
m
= 77
n
= 47
quantile.ub = 0.928
P-value:
0.01136926
Note that the Wilcoxon rank sum test is not significant at the 0.10 level
(p=0.88), while the quantile test is significant at the 0.011 level. The quantile
test picked up the portion of large outlying values in the Cleanup area data.
Menu
To perform the Wilcoxon rank sum test, follow these steps.
1.
2.
3.
On the S-PLUS menu bar, make the following menu choices:
EnvironmentalStats>Hypothesis Tests>Compare Samples>Two
Samples>Linear Rank Test. This will bring up the Two-Sample Linear Rank Test dialog box.
For Data Set, select epa.94b.tccb.df. For Variable 1 select TcCB, for
Variable 2 select Area, and check the box that says Variable 2 is a
Grouping Variable.
For Test select Wilcoxon, and for Shift Type select Location. Under
Alternative Hypothesis select greater, then click OK or Apply.
To perform the quantile test, follow these steps.
1.
2.
3.
On the S-PLUS menu bar, make the following menu choices:
EnvironmentalStats>Hypothesis Tests>Compare Samples>Two
Samples>Quantile Test. This will bring up the Two-Sample Quantile
Test dialog box.
For Data Set, select epa.94b.tccb.df. For Variable 1 select TcCB, for
Variable 2 select Area, and check the box that says Variable 2 is a
Grouping Variable.
Under Alternative Hypothesis select greater. For Specify Target select
Rank, and for Target Rank type 9, then click OK or Apply.
Command
To perform the Wilcoxon rank sum test, type this command
> wilcox.test(TcCB[Area=="Cleanup"],
TcCB[Area=="Reference"], alternative="greater")
or this command
> two.sample.linear.rank.test(TcCB[Area=="Cleanup"],
TcCB[Area=="Reference"], alternative="greater")
1.12. Summary
25
Note that by default the S-PLUS function wilcox.test computes the “corrected” z-statistic while the ENVIRONMENTALSTATS for S-PLUS function
two.sample.linear.rank.test computes the “uncorrected” z-statistic.
To perform the quantile test, type this command.
> quantile.test(TcCB[Area=="Cleanup"],
TcCB[Area=="Reference"], alternative="greater",
target.r=9)
1.12 Summary
•
•
•
•
Environmental statistics is the application of statistics to environmental
problems.
ENVIRONMENTALSTATS for S-PLUS is an S-PLUS module for environmental statistics. It includes several menu items and functions for creating graphs and performing statistical analyses that are commonly
used in environmental statistics.
To use ENVIRONMENTALSTATS for S-PLUS you should be familiar with
the basic operation of S-PLUS and have an elementary knowledge of
probability and statistics.
ENVIRONMENTALSTATS for S-PLUS has an extensive help system that
includes basic explanations in English, as well as equations and references.