1
PET
Pile Echo Tester
User Manual
About this manual
PET and PocketPET
Your PET hardware can be connected to a PC (Running MS Windows operating system) or to a PocketPC (Running MS Windows mobile).
The two are using different software versions. The logged data is stored in identical and fully interchangeable format. This means that data
files collected with one version can be opened by the other.
This manual is intended for the PC version of the software. The PocketPC setup installs a separate brief manual.
USB and Bluetooth models
This manual covers both the USB and the Bluetooth models. Note the USB/Bluetooth symbols.
Printing this manual
Highlight the top heading node and select "Print" - "This selected heading and all sub topics".
If you have a PDF printer, this is also the way to generate a PDF version.
You may also contact us to get a hard copy, or a PDF version.
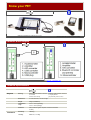
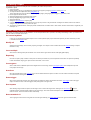
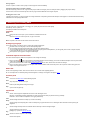
Know your PET
USB PET connected to a Tablet PC (Not included)
Bluetooth-PET with a pocket PC (Not included)
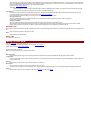
Hardware Block Diagram
See Appendix_A:_Bluetooth_PET
Technical Specifications
Physical
Transducer
Housing
Industrial grade transducer enclosed
in a durable
stainless steel housing
Industrial grade transducer enclosed
in a highly-durable
polycarbonate plastic (Lexan)
Dimensions
25.4 mm (diameter) x 90 mm (Length)
Weight
270gr (Transducer)
Temperature
range
-20°C to +55°C (Operating)
-40°C to +80°C (Storage)
Protection
IP68 (Protection against complete, continuous submersion
in water)
Sensitivity
100mV/g
Linearity
Within 1%, 0 to 50g
Resonance
30kHz
frequency
Sampling
50kHz
frequency
Standards
ASTM D5882-00
Meets or exceeds
Performance
Pile lengths
2m to 100m
(depending on diameter and soil profile. )
Productivity
Up to 100 piles/hour by single operator
(under favorable conditions)
Storage
Requirements
Computer
Unlimited
Pentium III, 266 MHz, 64 MB RAM
Pentium III, 512 MHz, 128 MB RAM
800x600 resolution
800x600 resolution
WinXP/Vista
WinXP/Vista
USB port
Bluetooth antenna/Dongle
Recommended: Tablet PC (outdoor
Recommended: Tablet PC (outdoor
display)
display)
— OR —
— OR —
PocketPC with USB host,
PocketPC with Bluetooth support,
QVGA/VGA, Windows Mobile 2003
QVGA/VGA, Windows Mobile 2005
or higher
or higher
Setup
Software and hardware may be installed in any order.
Software setup
1.
2.
3.
4.
Insert the provided CD into the CD drive of your computer. Select PET and the setup will start automatically.
Follow the setup defaults to install PET (Usually <1 minute).
In case the setup does not start automatically, click the SETUP icon on the CD PET folder.
PET software is installed to
[Start]-[Programs]-[Pile Testing]-[PET]
5. PET program files are installed to
\Program Files\Piletest.com
Hardware Setup
USB
1. Plug the PET USB connector into the computer
2. You should immediately hear a typical sound and see the “found new hardware” balloon, and the “Found new hardware “ Wizard should open
automatically
3. Follow the wizard’s instructions: insert the PET CD into the CD drive of your computer and press [next]
4. The Wizard will start copying the driver files from the CD
5. On Windows XP, a security warning appears. You may safely press [Continue Anyway] PET’s driver is fully tested and will not impair your system’s
stability!
6. After the files are copied, close the wizard by clicking [Finish]
Bluetooth
No need for any hardware drivers setup. You need to form a serial connection using the application provided by your Bluetooth dongle manufacturer or the
control panel applet of the operating system. See Appendix_A:_Bluetooth_PET
Tutorial
Testing a pile
1. Start PET
[Start]-[Programs]-[Pile Testing]-[PET]
2. If you want to use English units (Feet)
Select [Tools]-[Options]
Switch to the [Misc] tab
Select "English"
[Close]
3. Select [File]-[new project] and enter the name of the project
4. Locate the first pile in the actual project plan. Make sure the pile head is clean.
5. Select [Pile]-[Add] or click the big [+] button
6. Enter the pile's name
7. On the [Data] tab enter the planned length of the pile. This length can be changed later. However, it determines the sample size, and initial graph
scales, so it should be in close proximity to the expected length.
8. For now, leave the wave velocity at the default 4000m/s.
9. Connect the PET Sensor, Apply a small amount of putty the its' bottom.
10. Press the PET sensor against a clean spot in the top of the pile with a force of ~1kg (~2 pounds)
11. Click [Start] (See Troubleshooting)
12. Start hitting the pile. Hit sharply, lightly (equivalent to dropping the hammer from 10-20cm) and often (~2 times per sec)
13. You will have to practice this for a while to get a good, clean hammer impact. If you could not collect any good impact, Press [Stop], [Reset] and
[start] again.
14. Start collecting data. You will need at least 3 very similar impacts, and up to 20 or 30 impacts. You will sort them up later on, in the office. It is better to
spend another minute at the pile collecting some redundant data than to re-visit the site.
15. The average impact is displayed on the big graph, the individual impacts on the right
16. Select [Stop] to stop logging. You may continue logging and add impacts at any time later on, even after saving the pile, or on another day.
17. Optionally modify the presentation parameters:
Change the amplification to compensate for the soil friction.
Apply some smoothing using the filter (do not over-use it)
Change the scale of the graph (up to 3 times the planned length).
Use sharpening to enhance some features (do not over-use it)
Change the suggested depth mark location by clicking at any free area on the graph.
18. You may tentatively delete some irregular impacts by clicking on the red [X] icon next to them. The effect on the average is shown immediately.
19. Click on the recycle bin icon to undelete the last deleted impact. When you will save the pile, the recycle bin is emptied and the deleted impacts are
deleted permanently.
20. Add any pile comments
21. Tap [Save] to save the pile
22. Transfer the data to the PC for reporting and additional analysis
See also: Options
Interpretation
IMPORTANT NOTICE: This chapter cannot, and is not intended to waive the need for professional interpretation by a qualified engineer. Piletest.com Ltd.
does not encourage interpretation by unqualified personnel. The guidelines below should therefore be regarded as informational background and not as a
substitute for formal interpretation training.
Signal handling
To turn the raw data into an acceptable reflectogram, the PET software performs several operations. Some of these are performed automatically (marked
“Auto”), while others are done interactively by the operator (marked “User”):
1. Integration: The PET sensor is an accelerometer, while the graphical output represents particle velocity, therefore all signals must be converted from
acceleration to velocity. (Auto).
2. Filtering: To eliminate high-frequency noise and obtain a smooth curve the program uses a numerical low-pass filter. (User).
3. Amplification: Because of friction damping, the stress wave is weakened as it progresses along the pile. To obtain a legible reflectogram, it
has to be compensated for damping, usually exponentially. PET software also allows for linear amplification, which enhances the upper part
of the pile. In a well-balanced reflectogram, the impact on the top and the reflection from the toe should have approximately the same
amplitude. (User).
4. Rotation: The curve is rotated and shifted towards the depth axis. This prepares the reflectogram for the next step. (Auto).
5. Normalization: No two impacts are equal in intensity, so that the resulting particle velocities differ too. In order to assist understanding of
the results, the vertical scale is adjusted so that the maxima and minima of the reflectogram occupy all the available vertical space. (Auto).
6. Averaging: A typical reflectogram will include a consistent component (signal) and a random component (noise). As a result, no two impacts
will yield the same reflectogram. To improve the Signal/Noise ratio, PET software automatically averages successive impacts as they arrive.
(Auto).
Having gone through all this, we hopefully have a good-looking reflectogram, and wonder what it can teach us about the pile. In fact, this is the inverse
problem of taking a given pile shape and drawing the characteristics and the reflectogram. Like many inverse problems, it has no unique solution so that to
get a reasonable approximation we have to make several assumptions. The first and most important is that what we test is indeed a pile with an essentially
cylindrical or prismatic shape. To that we have to add additional information: The piling method, the soil profile and the supervisors’ field notes.
Actual testing with the PET can be learned fairly quickly by qualified personnel. Interpretation, on the other hand, should be left to experienced geotechnical
engineers with thorough knowledge of wave propagation theory, soil mechanics and piling technique. Of course, experts may make a few learned mistakes
from time to time, but the ignorant make a lot of stupid mistakes all the time. Expert interpretation is hence the key to successful sonic testing.
The first step in analyzing the reflectogram is done on site, immediately following each test. This is done by comparing the graph to a mental picture of
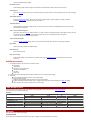
various pile shapes and their respective reflectograms. Some typical cases are presented in Table 1.
Table 1: Typical reflectograms
PILE PROFILE
DESCRIPTION
REFLECTOGRAM
Straight pile, free end, length as expected
Straight pile, fixed end, length as
expected
Straight pile, free end, shorter than
expected
Increased impedance
Decreased impedance
Locally increased impedance
Locally decreased impedance
Multiple reflections from mid-length
discontinuity - toe reflection indiscernible
Irregular profile - irregular reflectogram
If our reflectogram falls into one of these categories (except the last one, of course), it means that we can explain the significance of what we have in hand. If
the opposite is true, we have to try another spot on the pile (this often helps). If all our attempts fail, either the pile top was not sufficiently prepared for
testing, or the pile profile is just not amenable to sonic testing.
Capabilities
Since the sonic method is based on the use of stress-waves, it can identify only those pile attributes that influence wave propagation. The following items
may in many cases be detected:
1. Pile length.
2. Inclusions of foreign material with different acoustic properties.
3. Cracking perpendicular to the axis
4. Joints and staged concreting.
5. Changes in cross section.
6. Distinct changes in soil layers.
Limitations
All physical measurements, including the sonic method, have limitations. For instance, the sonic test will normally not detect the following items:
1. The toe reflection when the L/D ratio roughly exceeds 20 (In hard soils) to 60 (In very soft soils).
2. Progressive changes in cross-section.
3. Minor inclusions and changes in cross-section smaller than ±25% .
4. Impedance changes of small axial dimension.
5. Variations in length smaller than ±10%.
6. Features located below a crack or a major (1:2) change in impedance
7. Debris at the toe
8. Deviations from the straight line and from the vertical.
9. Load-carrying capacity.
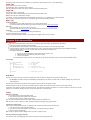
A schematic summary of the above list appears in Table 2.
Table 2: Limitations
High L/D ratio and/or high skin friction -no
toe reflection
Progressive changes in cross-section
Minor inclusions
Deviations from the straight line
Deviations from the vertical
Producing a report
The report is a RTF (Rich Text Format) file which is readable by all modern word processors.
To produce a report:
1. Open your project,
2. Modify all piles to the way you would like them to appear in the project by changing parameters, adding notes, etc.
3. You may bulk-edit some parameters using [Pile]-[Modify all]
This is especially useful to get the desired number of piles per page by changing the [Row height] to a typical 200% value.
4. Edit the project's title and sub-title
5. Select [File]-[Page setup] to change the page margins
6. Select [Tools]-[Options]-[Logo] to select your logo.
7. Select [File]-[Report]
8. Modify the report parameters and press [OK]
9. It is better to change the report parameters at the source (in PET) and not in the generated file. If changes are needed, close the file, make the
changes to the piles in PET and re-produce the report.
10. The report is a regular document, and may be printed, emailed, faxed, converted to PDF or DOC formats, saved to other locations, merged with your
final report, etc.
Labor saving features
Theoretically, the following features are all "redundant": one can test piles without them. In practice, once taking full advantage of them, you will not know
how you could ever test piles without them...
On-screen keyboard
In case you use a keyboard-less tablet computer, the on-screen keyboard option pops a full/numeric keyboard, just when and where you need
it. to enable, use the Options menu
Modify-all
Applying the same settings, such as velocity, reporting row height, etc to all piles. can be a tedious task. Use the Modify All dialog to complete
this task in a snap.
Insert multiple
About to test a retaining wall of piles numbered 1 thru 100? No need to type all those names, select [Pile]-[Add multiple]
Reporting
PET does not print to paper, instead, an RTF (Rich Text Format) is created, and your word processor is launched. This opens the possibility
to final customization, merging your report into other documents, e-fax or email.
Convergence
After a certain amount, additional impacts have marginal effect on the average, Use the Convergence options to accurately define just how
many impacts are "enough".
Auto-Sort
Why keep irregular impacts? With Auto-Sort you can set the desired numbers of impacts to collect. Once this number is reached, the impacts
are sorted and the most irregular one is removed.
Smart trigger
When moving around the pile head, many false impacts are triggered by random accelerometer movement. Smart trigger looks at the trigger
shape, and removes >80% of the false triggers, while passing >80% of the good ones
Sort impacts
After collecting a large number of impacts, the first thing to do is to remove the irregular ones. Clicking on the "sort" button
sorts the
collected impacts by their abnormality ("distance" from the average) - and moves the abnormal impacts to the top of the stack, making them
easier to remove. This is what Auto-Sort does automatically.
Notes standard + #
Tired of typing the same notes for many piles over and over again? Build up your custom notes list and never type the same note twice.
Reference
Main Window
Main menu
File-New Project
Opens the "create a new project" dialog
File-Open project
Opens the "Open a project" dialog
File-Browse for a project
Opens a standard windows "open" dialog. Letting you open projects which are not on the standard folder, including network
drives and CDs.
File-Open project folder
Opens the Windows folder where all the project files are stored. useful for copying/archiving the whole project
File-Project Summary
Shows the current project summary:
Project folder path
Project's title
number of sub-sites
Total number of piles
Total number of tested piles
A summary for each sub-site: Name, number of piles and number of tested piles
File-Sub-Sites
opens the Sub-Sites dialog, for renaming, deleting, and merging sub-sites
File-Print
Opens the print dialog
File-Printer setup
Opens the printer setup dialog (Depends on your printer's hardware). use this to select paper size and orientation, as well as
other printer specific options (such as quality, color, etc)
File-Page Setup
Opens the page setup dialog, allows setting paper margins
File-Exit
Closes PET.
Note that there is no need for a "Save" option. Projects and files are always kept saved to disk.
File-1...9
A quick way to open one of the most-recently-used projects
Pile-Add
Create a temporary new pile and opens the "" dialog
Pile-Delete
PERMANENTLY Deletes the currently selected pile. if the file contains data, a verification message box appears
Pile-Sort
Opens the pile-site dialog, where you can define the sort priority:
Sub-Site
Month/Day/None
Pile's name
Pile-Modify-All
Opens the "Modify all" dialog, where you can do bulk-editing of pile properties
Pile-Match
Opens the "Signal Matching" dialog
Pile-Show counter
Shows/Hides a simple counter that gets incremented on each pile tested. double-click the counter to reset it.
Tools-Options
Opens the Options dialog, where you can customize the report columns and fonts, screen keyboard, logo, unit code and logger
ID
Tools-Signal Options
Opens the Signal options dialog, where you can modify the trigger options, signal convergence, display convention,
amplification mode, and to measure the sensor noise level.
Tools-Data Source
Opens the data source selector dialog, where you can select if PET uses USB, or a simulated data source (For education,
demonstration and practice)
Tools - Calc and add average pile
Add a pile to the current sub-site called "Average". The "pile" is made of the average impacts of all the piles in the sub site and
it therefore "average of averages". each "impact" stored in this "pile" is an average of the piles in the project.
The pile can be processed just like any other pile.
Tools-Velocity Calculator
Opens the velocity calculator dialog, where you can get an initial velocity value, based on concrete age and grade
Help-About
Shows PET version number and legal warnings.
Help-Search for...
Opens this on-line help
Help-Tip of the day
Shows the tips dialog. You are welcome to submit more short tips to [email protected] for the benefit of the PET users
community
Additional controls
1. The toolbar provides a one-click control to common actions:
New project
Open project
Add a pile to an opened project
remove the selected pile
Sort piles
Show help
2. Project’s title and sub-title (Will appear on the final report, and on the "Open project" dialog)
3. Piles table
This is a WYSIWYG (What you see is what you get) display
Drag columns to re-order
Drag the vertical separator between columns to change column width.
Drag the horizontal separator between rows to change column height (Can be bulk-edited in the "Modify all" dialog)
Click on a pile's row in order to analyze, edit or re-test the pile
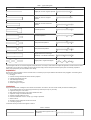
Add Multiple piles
Gives the option to add a series of piles to the project, saving typing them one by one (One of the Labor saving features)
The series can have a fixed prefix and suffix
Examples
To enter this series
Use these settings
Prefix
1,2,3,4...50
empty
From
1
To
50
Suffix
empty
30,40,50,60,70
empty
3
7
0
A7N,A8N,A9N,...A17N
A
7
17
N
2,4,6,8,10,...,100
empty
2
100
empty
(It is faster to delete redundant piles later on, than to type 50 names manually)
1001,1002,...,1009
100
1
9
Options
From the main menu, select Tools-Options
Columns tab
Check each of the possible report columns that you want to appear in the main window and in the report
empty
Change the caption of the column to customize it (For example use "Shaft" instead of "Pile", or use localized name)
Fonts Tab
Click to select the font of each report item
Click [Default] to return to the default "factory settings"
Tip: Use consistent font styles in the report to achieve a professional-looking report
Logo Tab
Enter the FULL path of your logo file.
The logo file must be in Bitmap (.BMP) format. Recommended size is 600w X 300h
Note: Actual Logo size is calculated for 300 DPI.
For example: your logo is 600 pixels wide X 300 pixels high, it will print as 2" X 1", regardless of your printer resolution.
Tip: If you plan to send your reports over fax, use a logo design that looks good in Black & White
Misc. Tab
On-Screen keyboard
Check this if you use a tablet computer with no on-screen keyboard support
An automatic software keyboard will pop-up whenever needed. (One of the Labor saving features)
Unit Code
(Only applicable if you have more than one PET unit)
This is the prefix of the pile's file name, use a different prefix for each unit to avoid name collision
Logger ID
Click to enter the Name/ID of the person doing the field testing.
This will be the default for each new pile
check the "Show this message at startup" to be prompted for the logger ID each time you start PET
Projects, Sub-sites and files
Background
PET uses one dedicated folder to store projects, this folder is called "Home folder", by default this is "\pile testing"
Projects are stored as sub folders of the home folder
Each pile (All impacts and meta-data) is stored a separate file (with the extension .PP) under the project folder.
A project folder also contains a file called "PROJECT.INI", which is a text file storing the project's titles and other miscellaneous settings
A pile's file name is made of a unit code, a system-wide unique number and the extension ".PP".
For example: B0000059.PP
1. B is the unit code (Only relevant for users with more than one PET unit)
2. 000059 means this is the 59th pile stored on this system
3. .PP is the file extension
This naming scheme makes sure that no two piles will ever get the same file name, and no test work will get overridden and lost
For example:
C:\PISA_PROJECTS
├───1003
│
├───A00059.PP
│
├───A00060.PP
│
└───PROJECT.INI
│
:
│
├───1004
:
<-<-<-<-<--
Home folder
A project
A pile
Another pile
Project's settings
<-- Another project
Sub-Sites
Sub-sites are a way to "break up" a project into smaller parts, which are easier to manage and can produce a clearer report
For example: if the project contains several buildings, each building can be used as a sub-site. Piles on different buildings may then have the
same designation.
Sub-site names are stored in each pile's file, when a project is opened, piles are grouped by sub-site.
When the last pile of a sub-site was moved to a different sub-site or deleted, the sub-site is removed. There are never empty sub-sites.
A new pile in a new project is created in the "default" sub-site. This name will not appear in the report. if you create a new pile in a new sub-site, PET will
suggest you to rename the "Default" sub-site to a more meaningful name, to avoid confusion.
Tasks
Starting a new project
1. From the main menu, select [File]-[New project]
2. Verify that the "Home folder" points to the correct path.
3. Enter the project's name or number and click [OK]
PET will create a new folder under the home folder, and will create the file PROJECT.INI
TIP: Use project numbers, rather than names. this makes finding and managing many projects simpler
Opening an existing project
If the file was created or opened recently, you will find it in the "most recently used" list under the "file" menu
1. From the main menu, select [File]-[Open project]
2. Verify that the "Home folder" points to the correct path, or click [Home Folder] to change it
3. Select the project and click [OK]
TIP: The title you give the project is displayed when you look for a project to open.
Deleting, renaming & merging sub-sites
From the main menu, select [File]-[Sub-Sites], select the proper sub-site and the proper action
Saving a project
There is no option or need to save a project, as all changes are saved immediately.
Transferring project files to another computer
After the first (or only) visit to the site, copy the whole project's folder to the target (This can usually be done by dragging the project's folder)
On future visits, sort the source folder by date, and only copy the latest added files to the target computer
Sending piles over e-mail
If sending just a few files, you may send them as an single attachment. Compressing the files with WinZip of similar program is recommended. Note that many
mailboxes cannot accept large attachments.
Collecting and editing data
From the main menu, select Pile-Add, or the big [+] icon, specify the pile's name and select [Start]
Alternatively, click on a pile's row
The display is divided into several panes
Top pane
Name
Change the name of the pile, up to 40 characters, localized names are OK
Sub-Site
Select the sub-site to move this pile into, or type a new name
Note: Two piles in the same sub-site cannot have the same name
Average signal graph
This is the big graph on the left-top corner, showing the average reflectogram
Move the cursor over the graph to see the corresponding depth
The red triangle specified the designed length of the pile (See data tab, below)
The red rectangle specified the end of the reflectogram. This point gets the full amplification. you will typically want to show a couple of meters
(~6feet) after the piles toe. you may drag this right and left
Click anywhere on the graph to change the default depth
Individual impacts list and toolbar
Each new recorded impact is added to the impacts list, and changes the average.
Click on the [Sort]
button to sort impacts by abnormality (distance from the average). This moves the abnormal impacts to the top of the stack,
making them easier to remove. (One of the Labor saving features)
Click on the red X to the left of each impact to push it to the "recycle bin" stack, where it does not effect the average
Click on the "Recycle bin" button to pop the impact back from the "deleted" stack into the list (First in, last out). NOTE: When saving a pile, the
impacts in the recycle bin are lost
Status bar
Shows a hint regarding a control, when the cursor hovers over it. Shows hints regarding impacts.
if a new impact does not materially change the reflectogram, a message "Convergence" will appear. more...
Controls pane
Start
Connects to the data source starts Collecting impacts
Save
Stops acquisition, and saves the pile
Abort
Exits the pile editing without saving the changes
Help
Open on-line help (this file)
Impact Tab
Amp
Shows / and changes the amplification at the end of the reflectogram curve
[A] (icon) - Automatically changes amplification to match the signal at the start (0m) and at the end (if possible)
Checkbox - Show or hide the amplification curve (gray dashed line)
Filter
Shows/changes the filter level. Always try to avoid over-filtering
Sharp
Shows/changes the sharpening filter. Avoid over-sharpening. A typical final value is 0-2, while larger values should be used only during the
diagnostic.
Scale
Shows/changes the depth scale. the maximal value is limited by 3 times the designed length
C
Shows/Changes the wave velocity
[Calc] (icon) - opens the Velocity calculator
Avg
Shows the number of impacts in the average
Reset
Clears all the impacts
Signal Options
Click on the [Signal] icon to change the signal processing options
FFT
Toggles FFT (Fast Fourier Transform) display on and off (See Using the FFT curve) (Green curve)
Show stacked
Shows all individual blows stacked on on top of the other (solid gray line) and blow the average (thick black line)
Compare...:
Compares this pile to any of the other piles in the project (the other pile is shown using a dashed blue line)
Data Tab
Planned length
Enter the planned length of the pile, this will appear as a red triangle on the reflectogram and in the details columns of the report
You may use the up/down arrows to enter depth quickly on a tablet computer
Length tag
Click to change the reported length, from a number, a number with a question mark, to a question mark only.
This is used to express uncertainty of the reported length
Note: Sometimes the piles are un-testable by the PET method, either because of design or preperation. Use the Uncertain or Unknown marks to
show that the length cannot be accurately determined.
Notes
Edit or select from the history the notes/comments for this pile
TIP: Enter the hash (#) character into a stored note to represent depth, this character will be replaced by the depth you clicked on the reflectogram
For example: enter and store the note "Possible necking at #". Click on the reflectogram at 5.2m, the text will change to "Possible necking at 5.2m"
Reflectogram
When editing pile notes, click on the reflectogram to inject the depth into the notes
+Add to list
Add the current note to the stored notes list
-Remove from list
Remove the currently selected note from the stored notes list
Export Tab
Shows general pile information and allows exporting to CSV format
Export
Exports the pile raw data to CSV format
Reporting
PET does not print directly to the printer, instead, it generates an RTF (Rich Text Format) file and calls your word processor. Most word processors
(including MSWord) recognize this file format.
This approach gives you the option to
Add final customization to the report, change fonts, colors, add a preface, etc.
Preview the report using the strong preview capabilities of the word processor
Save the report together with the logged data
Email the report, or Fax or directly from the computer
From the main menu, select file-Report (or click the report icon)
Sub-Sites
All: Print report for all sub sites.
Current: Print report for the current sub-site only.
Dates
All: Print report for all piles.
Monthly: Print report for all piles tested during the current month.
Daily: Print report for piles tested today.
New page for each sub-site
When checked, PET will add a page-break after each sub-site
Word97 format
For backwards compatibility - When checked, the generated file will be readable by Word97, but not by later versions.
First page number
Number to start the pages auto-numbering. this is useful if you attach a standard, pre-printed preface to your reports
See also:
Sub-Sites Modify-All
Signal processing options
Trigger tab
Trigger Level
Enter the hammer-impact strength [mg] needed to trigger the sampling
A typical value is 400mg
Pre-Trigger
Enter the length of the curve before the top of the trigger pulse
Typically between 150 and 200cm
Beep at each impact
When checked, the computer will produce a short beep sound on each recorded impact.
Trigger+ Tab
Use smart options
Enables or disables all smart trigger, AutoSort and convergence options. When testing very hard to test piles, it is sometimes better to collect all raw
data and sort it later manually.
Smart-Trigger
When checked, PET will apply an algorithm on each triggered pulse to determine if it is a valid hammer impact, or just noise from unintentional sensor
move. The algorithm usually rejects more than 80% of the noise pulses, and passes 80% of the good ones, so it is recommended to use it unless the
pile top is badly prepared, and it is hard to get a good hammer impact.
(One of the Labor saving features)
Auto Sort
Check this option to limit the number of collected impacts. When an additional impact is taken, the impacts are sorted and the most irregular
one is removed. Using this you can reduce the amount of office post-processing.
Convergence
Convergence is an indication that enough impacts have been collected, and that additional impacts have marginal effect to the average. you can
control the accuracy of the convergence in this tab. (One of the Labor saving features)
Once convergence is reached, a big, red "Convergence" message will flash across the graph
Average change [%]
Select the convergence accuracy, smaller value means more similar impacts must be collected in order to reach convergence.
5% is typically a good value to work with
Number of impacts
Select the minimal number of impacts that must be collected before a convergence can be declared. (3-20)
When sending a less experienced technician to the site, it is possible to set the value to high (for example, 10) and ask the technician to collect
impacts until convergence is reached. It is always easier to remove bad impacts in the office than to go back to the site.
Up/Down Tab
There are two popular presentation methods, regarding the polarity of velocities. After getting used to one, it is hard to analyze the others. PET supports both
Up
down-velocities are plotted on the positive Y axis
Down
Down velocities are plotted down
Noise Tab
For Piletest.com internal use.
Modify All Piles page
From the main menu, select [Pile]-[Modify All...]
Using this dialog, you can bulk-edit all piles in the current sub-site or project
(Modify-All is one of the Labor saving features)
There are four fields for bulk-edit
Note: if you leave a field empty - no changes will be made
Planned Length
Enter the piles planned length. This is useful if this piece of information only becomes available AFTER the piles have been tested
Length Scale
Enter the graph scale (X-Axis value where the graph ends). Your report will look better, and it is easier to compare reflectograms of different piles if all
at at the same scale
Velocity
Wave velocity of all piles cast of the same age is likely to be identical.
Row Height
Use this option to control how "thick" are the printed rows in the report.
To print 10 piles per page, set the row height to 190%. This number may change according to your paper size, margins and printing preferences.
Apply To
Select whether limit the scope of changes to the current sub-site, or to the whole project
Exporting Pile data to CSV
After testing a pile, select the export tab to export the pile's data to a CSV (Comma Delimited test format) which is readable by most spreadsheets and editors.
This can be used for research and for exporting to alternative analysis software.
PET will create a CSV file by adding the ".CSV" extension to the pile's name
Pile name:
Foo-45
Subsite:
Tower 2 / PC2
Filename:
C:\Pile Testing\foobar - 2nd\A0000110.pp
Created:
7-22-2004
Samples:
20 Impacts
each of 576 samples
at 50.0KHz
Impacts:
Avg
Impact1
Impact2
Impact3
...
-1
43
-33
-29
...
4
89
-20
22
...
-3
-31
18
-43
...
5
6
-17
2
...
1
-28
11
58
...
-8
-1
14
-25
...
-5
17
58
36
...
-11
20
17
21
...
...
...
...
...
...
First rows are general data, followed by a column for the average data and a column for each impact
Each row is a sample value. With equal time differences defined by the sampling rate (32KHz here)
Sample values are integers. to convert to acceleration [g] multiply by 0.000244140625 (=1/1000 hex)
To plot the raw data, select a column, and click the chart icon.
Note: To convert this to PET-like plot, you will need to implement your own algorithms for filtering, integrating etc. to the raw data.
Using the FFT curve
[X] Check the FFT checkbox of an existing, tested pile. to show/hide the green FFT curve
Background
The FFT (Fast Fourier Transform) is a frequency-domain analysis of the time-domain signal
for simplicity, PET converts frequencies to depth (using the current velocity)
(for example, if the velocity is 4000m/s, a frequency of 1KHz is displayed at 2m)
Usage
The FFT curve is usually smooth (with several peaks resulting from the signal shape, and the FFT algorithm)
Here is a sample of a reflectogram with some periodic noise, a sharp peak in the FFT curve is clearly visible, and a possible analysis is a necking at ~2.8m
(Which is hard to quantify from the time-domain curve)
Velocity calculator
From the main menu select Tools-Velocity Calculator, or when adding a new pile, click on the [Calc] button
Drag left and right the concrete age and grade bars, to calculate the velocity
When adding a new pile, the calculated velocity is automatically used as the wave velocity
BACKGROUND:
Wave velocity in a rod is given by
. The mass density ρ is determined at the moment of concreting and hence does not change. Young’s
Modulus E, however, tends to increase as the concrete hardens, albeit at a decreasing rate. As a result, c increases with the age of the concrete.
The relationship between the wave velocity (in m/sec) and age for 30 MPa concrete is given by (Amir, 1988):
where t is the concrete age in days. The wave velocity c for other concrete grades fc is given by:
It appears that from the age of one week onwards, c lies between the rather narrow limits of 4000m/sec +/- 10%.
Signal Matching
This is a technology preview
feature
From the main menu, Highlight a pile and select [Pile]-[Match]
In this dialog, you see the actual data superimposed with a simulated data. You change the friction and geometry profile until a good match is achived.
NOTE: This does not indicate that the profile matches the actual pile shape, there are infinite number of possible good solutions.
When editing a profile, click on it to add a point, or right click to remove a point. Points can be dragged.
Start by matching the impact offset and duration until a good overlap is reached
Next, get a rough matching of the friction profile by using the up-down arrows until the start and toe reflection roughly match the actual pile.
Continue by modifying the geometry profile.
Continue iteratively until a good match is found, watch the match quality mark and try to maximize it.
You can save the matched profile, it will be loaded automatically when you re-open this dialog with this pile.
Try the "Match" option which uses an evolutionary algorithm and tries to improve your match
You can stop the automatic match process at any time, "help" it by modifying the profiles, and let it try to improve again from the point you have left.
Please send us your feedback on this feature.
Theoretical Background
Stress-wave Theory
Having tested our piles does not conclude our task: We also have to analyze the results and reach some conclusions regarding the acceptability of the pile
namely its length, continuity and changes in cross-section. To understand the meaning of our reflectograms, we must first look into some basic principles of
one-dimensional stress-wave propagation.
Wave Propagation in Elastic Rods
When hitting the pile top with the hammer, we create a compression stress-wave that moves downwards.
The analysis of wave propagation in piles is fairly straightforward, provided we make a few reasonable assumptions:
·
·
·
The pile is prismatic (Or cylindrical), with cross-section A, elastic with Young’s Modulus E and homogeneous with mass density r.
·
Lateral inertia effects are negligible
The wavelength is larger than the lateral dimension of the rod.
Cross sections remain plane, parallel and uniformly stressed.
Let us now examine an element along the rod (Figure 1). If we denote the stress above the element by s and below the element by s + (¶s/¶x) Dx, the
unbalanced force on the element is (¶s/¶x)Dx. According to Newton’s second law (Force equals mass times acceleration):
2
2
A(¶s/¶x)Dx = A.Dx.r(¶ u/¶t )
(1)
Because of elasticity,
s = E.¶u/¶x
(2)
Substituting in equation (1) and eliminating both A and Dx on both sides, we get:
2
2
2
2
2 2
2
(¶ u/¶t ) = E/r (¶ u/¶x ) = c (¶ u/¶x )
(3)
Which is the one-dimensional wave equation for a prismatic rod. c = Ö(E/r) is the velocity of wave propagation in the rod as distinct from v = ¶u/¶t which is
the particle velocity.
Figure 1: Waves in an elastic rod
Using Hooke’s Law, it is also possible to demonstrate that the force P acting on a given plane is proportional to the particle velocity v:
P = Z×v
(4)
The coefficient Z = Acr is called the impedance, with typical dimensions of kg/sec. Alternative expressions for Z are A×Ö(Er) and E×A/c.
Reflection from the end
When waves propagate in a finite rod, they will eventually reach the end. The wave will then be reflected, with the nature of the reflection depending on the
boundary conditions at the end: When the end is fixed, the wave will be reflected unchanged, that is a compressive wave will be reflected as compressive,
and vice versa. On the other hand, a wave reflected from a free end will change sign: From compressive to tensile, and vice versa.
If we take a prismatic rod with a given length L, and apply a short duration (dynamic) load to one end, the wave created will travel along the rod and return
from the other hand, the duration of the whole trip being T = 2×L/c.
Discontinuities in rods
A discontinuity in a rod is defined as an abrupt change in either cross section (From A1 to A2) or material properties E and r. When a wave traveling in a rod
meets such a discontinuity, a part of it will be reflected back while another part will be transmitted beyond the discontinuity (Figure 2). Let us represent the
incident wave parameters by the index i, while r and t will denote the reflected and transmitted waves, respectively.
Figure 2: A rod with a discontinuity
From equilibrium and continuity considerations, we can get the following relationships:
(5)
And:
(6)
These two equations enable us to calculate the behavior of a wave as it moves along a rod of an arbitrary shape. A convenient way to visualize the process
is to represent the wave propagation in the x-t plane. The lines on this plane describing the propagation of longitudinal waves in a rod are called
characteristics.
Figure 3 shows the characteristics for a rod with a reduced cross-section. The figures besides the lines are the respective stresses, calculated from
equations (5) and (6).
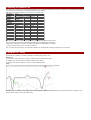
Using the method of characteristics, we can draw a graph showing the velocity at the top of the pile versus time. Such a graph (Figure 3) is called a
reflectogram.
Figure 3:
Characteristics for a rod with a reduced cross-section
(After Vyncke & van Nieuwenburg 1987)
Damping
The above analysis of wave phenomena in prismatic rods was based on the assumption of zero skin friction. When the rod is embedded in some solid
material, however, the situation is different: Rod particle displacement, which is associated with the wave, will give rise to skin friction forces in the opposite
direction. To visualize the effect of these forces, let us consider the case of a compressive wave traveling downwards in a rod (Figure 4). As the wave passes
the point x = a, it gives rise to a friction force F acting, obviously, upwards.
For the sake of simplicity, let us assume an elastic, linear friction model.
The friction force F gives rise to a pair of waves, each equal in magnitude to F/2: A reflected wave and a transmitted wave. The reflected wave is of the same
type of the incident wave: A compressive wave will cause a compressive reflection, and vice versa. Thus, the reflection due to skin friction has a similar
effect to an increase in the impedance.
The transmitted component is superposed on the incident wave. Since it is of opposite sign, the net result is a weakening, or damping, of the wave. The total
energy in the rod is decreased by friction, the difference being radiated to the surrounding medium.
Figure 4: Skin friction
Troubleshooting
When pressing [Start] A message "USB PET could not be found..." appears although the plug is inserted.
Make sure the hardware drivers are installed
Separate elements: Make sure your PC USB port is operational by plugging a disk-on-key or similar device to the port, plug the PET into a different
PC (even without PET installed) to see the "New hardware wizard".
Start "device manager" ([Start]-[My computer]-right click-[Properties]-[Hardware tab]-[Device manager].
Scroll down the "Universal serial bus controllers" and locate the PET. If you see a "unrecognized device", right click it and try to reinstall the driver.
When hitting the pile, I hear beeps, but no impact is recorded
(This means that the impacts are strong enough, but are rejected by the smart trigger)
Hit softer: You should hit sharply, lightly (equivalent to dropping the hammer from 10-20cm) and often (~2 times per sec)
Find a different spot for the sensor or hammer, make sure you do not hit slurry mixture or loose concrete.
Clean or trim the pile head
Disable "Smart Trigger": Under difficult conditions, it is hard to get any good impact. Than it is faster to disable the smart trigger and sort the impacts
manually . Remember to re-activate the smart trigger when you are done.
Trigger Level: Typically, a trigger level of 0.4g is just right. However, this level can be decreased to make the PET more sensitive, or increased to
make it respond only to a stronger impact.
Impacts are very irregular
Find a different spot for the sensor or hammer, make sure you do not hit slurry mixture or loose concrete
Clean or trim the pile head.
In extreme cases, have a testing surface prepared and smoothed with a disk grinder.
The system records impacts without hitting the pile
Trigger level might be set too low. Typically 0.4g is just right.
The system might be using the "Demo" data source.
Contacting Piletest
Getting-started support from Piletest is part of the package. It's yours, use it.
We will:
Do your first report for you
Review and modify your second report
Review a couple of additional reports, until we feel you are on your own
Review any additional interesting or unusual case
To get support:
Browse to your project folder, and ZIP all files into one archive.
email [email protected] - attach the raw data archive, and any additional information such as soil profile, drilling method, groundwater table, etc...
the more the better
Appendix A: Bluetooth PET
Overview
Instructions specific to the Bluetooth PET
Batteries
The unit is operated by two alkaline AAA batteries. The combined minimal battery voltage is 2.1V – Rechargeable batteries usually give lower voltage and
cannot be used.
WARNING:
The batteries must be inserted with the correct polarity (note the + sign near the battery opening). Inverting the polarity will destroy the system
immediately and is NOT covered by warranty.
Use batteries only from a reputable manufacturer such as Duracell, GP, Energizer, etc.
The batteries should typically last for 200-300 piles. This may vary depending on many factors (Number of blows per
pile, length of piles, idle time between testing, storage time and many others)
You may keep working with flat batteries until the unit is no longer responsive. The data sampling accuracy is not affected by the battery level.
Never replace batteries in the rain or under conditions where water can reach the inside of the unit.
To protect our environment, please dispose batteries responsibly.
During flight, the batteries should be removed to prevent unintentional activation of the system.
General operation
The unit has a built-in impact switch. To start the system, simply tap it lightly on the pile top. The system will enter “discoverable mode” where it waiting for a
connection from a PocketPC or other Bluetooth-enabled host.
The unit is fully waterproof with the case tightly closed and the O-Ring intact. If the O-ring is damaged, replace it (Free from Piletest).
LED Indications
Blinks
Possible Meanings
None
The system is off (Tap to switch on)
Batteries are dead
The system is connected and logging data
(Every movement will generate a short blink)
10 blinks
●○●○●○●○●○●○●○●○●○●○○○○○○○
The batteries were replaced
2 close blinks every 1.5sec (heartbeat)
●●○○○○○○●●○○○○○○a
The unit is waiting for a connection by a
computer
If no connection is made in 2 minutes the system
shuts down to conserve battery
1 blink every 2 sec
●○○○○○○○○○○○○○●a
The system is connected to the computer, but
not logging data
1 short blink
●○○○○○○○○○○○○○
Impact data was sent to the computer
Fading down and up again
Low battery
●●●●●
●●●●●●●
The cover was opened and closed
a command was received from the computer
●●●●●a
50 very frequent blinks
●●●●●●●●●●●●●●a
Error, contact Piletest
Software
Connecting your PocketPC for the first time:
Insert new batteries into the unit and close the cover, or tap the unit. The LED blinks 10 times, and than starts
flashing two close blinks every 1.5 seconds. Those “heartbeats” mean the system is waiting for a connection
from the host.
In your PC/PocketPC, make sure the Bluetooth is switched on and start a search for a new Bluetooth device
(Consult the computer user manual).
The PET will be discovered, with the name PETnnnn (where nnnn is the serial number of the unit). Continue to
create a connection (Also called “bond”) with the unit. Set this as the default connection. If required to use a
security code (also called PIN or pass-code) use “1234”.
Take note of the outgoing COM port number assigned to the BTPET. You might need this number in the next
steps.
On a Mobile PC - Use PocketPET software version 3.0 or later. Select tools-options-hardware-Bluetooth-OK.
You may also specify the COM port number, or leave it as Automatic (Which may not always succeed).
On a Windows system, take note of the COM port number assigned for the connection. Start PET, select
Tools-Data Source, and specify this COM post number.
Tip: Continuous Bluetooth usage in WM5 (Microsoft Mobile 2005 operating system) and to some degree in WM6 may cause a gradual degradation in system
performance. The simplest remedy is to warm-reset the PocketPC by pressing the reset switch (See the PocketPC user manual).
Additional software features
Battery indication: During testing, the approximated battery capacity is displayed on the status bar. When the capacity is low, an alert is displayed.