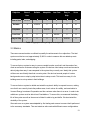
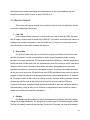
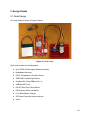
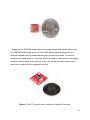
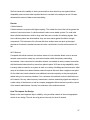
1
SEED Group #20: Wireless Building Monitoring System for Energy Audits Team: Micah BotkinLevy, [email protected] James Chin, [email protected] Hao Hu, [email protected] Kaitlyn Mayberry, [email protected] Michael Zonnenberg, [email protected] Mentor: Mads Almassalkhi, [email protected] Client: Ethan Goldman, [email protected] Efficiency Vermont To: Ethan Goldman From: SEED Team 20, Micah, Kaitlyn, Kimmy, Hao, Michael Date: May 4, 2015 Our team was tasked to create a Wireless Building Monitoring System for Energy Audits for Efficiency Vermont. With financial support from our client we were to design and create such a system. In this report you‘ll find our problem statement and how we went about solving it. Along with an analysis section of our design. 1 Table of Contents 1. Problem Statement………………….……………………………………………....pages 25 1.1 Motivation 1.2 Problem Statement Iterations 1.3 Key Objectives 2. Design Overview………………………………………….………………………….pages 25 3. Objective Analysis…..…………………………………………....…………..........pages 611 3.1 Objective Tree 3.2 Aggregate Rank Analysis 3.3 Metrics 3.4 Objectives Results 4. Function Analysis………………………....…....……………………………........pages 1315 4.1 Black Box Function Diagram 4.2 Functions/Mean Tree 4.3 Requirements 4.4 Functions Results 5. Design Details…………………………………………………………..............pages 1618 5.1 Node Design 5.2 System Design 5.3 Casing Design 6. Analysis……………………………......……………………………………..........pages 2542 6.1 Microcontroller 6.2 Sensors 6.3 Logging and Buffering Data 6.4 Transmission of Data 2 6.5 Data Collection and Live Stream 7. Test Results………………………...……..……....………………………….……......page 49 8. Conclusion and Future Work…………………………………………………………..page 9. References………………………………………………..………………...........pages 5354 Appendices A. Users Manual B. Budget C. Bill of Materials D. Schedule 1. Problem Statement 3 1.1 Motivation Currently Efficiency Vermont sends energy auditors to buildings to set up wired monitoring systems. There is not an easy way to remotely monitor the collected data, which sometimes causes auditors to discover months later they have been collecting inaccurate data. This method requires lots of travel and troubleshooting time of Efficiency Vermont employees. 1.2 Problem Statement Iterations From the goals and requirements provided to us by our client, Efficiency Vermont, we came up with our initial problem statement: Vermont Energy Investment Corporation would like a lowcost building monitoring system to support their energy efficiency analysis before and after efficiency measures are implemented. The system will transmit data from sensors through a gateway hub to a remote server using a mesh network that can cover 20,000 sq ft. In case of a network interruption the sensor must buffer and preprocess data and the gateway must be able to log data for 3 months. The system must be batterypowered, last up to 312 months and transmit at 5min intervals. The system will be set up by an energy auditor with rudimentary training and have the ability to collect data from a variety of sensors including temperature, humidity, lightlevel, airquality, occupancy, motor state, voltage, current and serial inputs. The hub should provide data to a web admin interface which allows for configuration and troubleshooting of all parts of the system. The remote server should be able to collect data as well as be browsable and able to send alerts for initiating troubleshooting when faced with a connection outage. After creating our objective tree and performing rank analysis, we updated our initial problem statement to reflect new information and ideas we came up with during these processes. Through rank analysis, we found that reliability was the most important objective for our team. To emphasize reliability, we included it in the opening sentence of our problem statement. Ease of use was our second highestranked objective; therefore, we included it in our section on the system setup. We also wanted to highlight that the system wouldn’t always be set up by an energy auditor but a person with rudimentary experience as well. 4 During our first meeting, our client, Ethan Goldman, provided us with important requests and requirements for our project from which we were able to refine our problem statement. We learned that he would prefer the system to transmit data from the gateway to a remote server through a cellular connection. He also suggested that we look into using Pinoccio as a way to communicate data from multiple sensor nodes to a main hub node. Our client explained that the system should cost approximately $1,000 and last at least 5 installations to be cost effective. Our problem statement was continuously refined as we conducted indepth analysis on various aspects of our system and continued to meet with our client. We learned that our client needed the sensors to buffer data for 2 weeks and the gateway must be able to log data for 12 months at 5minute intervals. Also, we narrowed down the list of sensors that our system should incorporate to include: relative and external temperature, humidity, magnetic field sensors, and generic 05V and 430mA inputs. With a deeper understanding of the webbased admin interface, we updated the problem statement to include its ability to locate the problem area, configure network connectivity, troubleshoot network connectivity, and check values for validity. Our problem statement at the end of our first semester is presented below: Vermont Energy Investment Corporation would like a reliable building monitoring system to support their energy efficiency analysis before and after efficiency measures are implemented. The system will transmit data using a mesh network that consists of remote sensor devices connected to a gateway hub which can cover an area of 20,000 sq. ft. The gateway feeds collected data into a remote server, preferably through a cellular connection. The sensors will constantly preprocess data before sending it to the gateway. In case of a network interruption the sensors must buffer for 2 weeks and the gateway must be able to log data for 12 months. The sensors must last up to 312 months on battery power and log data at 5 minute intervals. The system will be easily set up by a customer with rudimentary training or an electrician with provided instructions. It will have the ability to collect data from a variety of compatible sensors (relative and external temperature, humidity, and magnetic field sensors as well as generic 05V and 430mA inputs) which will be included with the system. The hub will provide data to a webbased admin interface which allows for configuration and troubleshooting of all parts of the system (with the ability to locate the problem area), including network connectivity as well as checking 5 values for validity. The remote server will collect data as well as be browsable and able to send alerts for initiating troubleshooting when faced with a connection outage. Our system will likely utilize existing technologies such as Pinoccio. The total cost of the system will be approximately $1,000 and last at least 5 installations. During the second semester we worked extensively on designing our system. Throughout the design process we needed to work with our client to change some of the requirements for our system. We switched to using the Arch GPRS V2 instead of Pinoccio. We wanted to send our sensor data through a cellular connection rather than wifi, and the Arch GPRS V2 development board houses a SIM900 cellular networking module. It also has a built in microSD slot for convenient data backup. Using the microcontroller’s low power ARM CoretexM0 Core, we needed to make the Arch GPRS V2 last 3 months on battery power. Here is our final problem statement: Efficiency Vermont would like a reliable building monitoring system to support their energy efficiency analysis before and after efficiency measures are implemented. The system is made up of multiple nodes, each of which contain sensors and a battery connected to a microcontroller. The microcontrollers must last 3 months on battery power. Collected data is fed into an online database through a cellular network, capable of covering an area of 20,000 sq. ft. In case of a network interruption, the microcontrollers must buffer data for 2 weeks and the online database must be able to log data for 12 months both at 5 minute intervals. The system is packaged with stepbystep instructions and mailed to a customer with rudimentary training for easy setup. It will have the ability to collect data from a variety of compatible sensors (relative and external temperature, humidity, and magnetic field sensors as well as generic 05V and 430mA inputs), which will be included with the system. The online database allows for configuration and troubleshooting of all parts of the system (with the ability to locate the problem area), including network connectivity as well as checking values for validity. The system will send alerts for initiating troubleshooting when faced with a connection outage. The total cost of the system will be approximately $1,000 and last at least 5 installations. 6 1.3 Key Objectives Our team identified five key objectives for this project: ● low cost ● ease of use ● reliable ● adaptable ● easy to ship These objectives will allow us to meet the requirements from our client and produce a product that will perform the essential functions. 7 2. Design Overview Our design was to make individual nodes each comprised of its own microcontroller, cellular data plan, and set of sensors. Figure 1 below shows two nodes and how the data will be transferred over cellular network. Each node will have a temperature, humidity, and light level sensor to collect environmental data, along with an individual sim card and microSD card to transmit and backup data. Each node will upload to ThinkSpeak.com which is an Internet of Things API with a great easy to use use interface. Each node will have to be configured by the auditors at Efficiency Vermont. The microSD will carry an executable java file which when selected will run our configuration GUI. The user will enter the project’s information along with the API key found on their ThingSpeak channel. Once the GUI is compiled text files will automatically be created on the card and once the microSD card is inserted into the node and the power switch is toggled to the on position the node will start transmitting the selected data. Data will be transmitted and stored every at 5 minute intervals. Figure 1. Design utilizes sensors connected to nodes which communicate collected data to a ThingSpeak API via a cellular network 8 3. Objective Analysis 3.1 Objective Tree Our team had five higher level objectives for our wireless building monitoring system for energy audits: low cost, ease of use, reliable, adaptable, and easy to ship. An objective tree was created with these constraints shown in orange. First, the total system must cost approximately $1000 to be cost effective for Vermont Energy Investment Corporation. Figure 2. Low cost portion of the objective tree Second, the system needed to be easy to use. This meant the data collected is readily accessible for Efficiency Vermont. Also, the system must be easy for both Efficiency Vermont and the customer to set up and maintain. Figure 3. Ease of use portion of the objective tree 9 The system needed to be reliable. It was important that the system was able to troubleshoot in response to errors: locating the problem area and checking values for validity. It also needed to send alerts to Vermont Energy Investment Corporation and the customer when there was an error. The Arch GPRS V2 must have a 3 month battery life to last throughout the energy efficiency analysis. In case of an outage, the online database must be able to log data for up to 12 months and the Arch GPRS V2 must be able to buffer data for 2 weeks both at 5minute intervals. Sensor nodes must constantly preprocess data. The system must last at least 5 installations before it needs to be replaced. Figure 4. Reliable portion of the objective tree 10 The system must also be adaptable. Data is collected from a variety of sensors: relative and external temperature, humidity, magnetic field sensors, and generic 05V and 430mA inputs. The system will be utilized in a variety of buildings and must cover an area of 20,000 sq. ft. Figure 5. Adaptable portion of the objective tree Lastly, the system must be easy to ship, therefore it must be compact, lightweight, and durable. Figure 6. Easy to ship portion of the objective tree 11 3.2 Aggregate Rank Analysis Each of our team members and our mentor performed a ranking of our five higher level objectives (low cost, ease of use, reliable, adaptable, and easy to ship) presented in section 2.1. A ranking of 1 was the most important and a ranking of 5 was the least important. The individual results are listed in Table 1 below: BotkinLevy Chin Hu Mayberry Zonnenberg Almassalkhi 1. Ease of use Reliable Reliable Ease of use Adaptable Reliable 2. Reliable Ease of use Adaptable Reliable Reliable Adaptable 3. Adaptable Adaptable Low cost Adaptable Low cost Ease of use 4. Low cost Low cost Ease of use Low cost 5. Easy to ship Easy to ship Easy to ship Easy to ship Easy to ship Easy to ship Ease of use Low cost Table 1. Individual rankings of higher level objectives From these individual rankings, an aggregate ranking of our five higher level objectives was compiled, shown in Table 2. As a team, we gave reliability the highest score. Not only does our system need to work consistently day to day, but it also needs to respond to problems it may encounter such as outages. Ease of use and adaptable were very close in ranking as the next highest ranked. The system needs to be simple and work in a variety of buildings and environments. Through conversations with our client, we determined that low cost should be achievable as long as the system is simple. Easy to ship isn’t so much of a priority for our team as it should come along with the simple design. 12 Objective Ease of Reliable Adaptable Low Cost Easy to Use Score Ship Ease of Use XXXXX 2 3 4 6 15 Reliable 4 XXXXX 5 6 6 21 Adaptable 3 1 XXXXX 6 6 16 Low Cost 2 0 0 XXXXX 6 8 Easy to Ship 0 0 0 0 XXXXX 0 Table 2. Aggregate ranking of higher level objectives 3.3 Metrics There were several metrics we utilized to quantify the achievement of our objectives. The total system must be low cost, approximately $1,000. In order to measure this we added up costs including parts, labor, and shipping. To ensure that our system is easy to use we needed to make sure that it met the needs of our client as well as the customers using the system. We had our client setup a node and access its data to judge how easy it was compared to the system they currently use. Ideally this system will be more userfriendly than their current system. We also had several people of various backgrounds use our stepbystep instructions to setup a node. This tests how easy it is for building users to set up nodes in their buildings. To ensure that our system is reliable we tested the system’s ability to respond to errors, making sure that it can correctly locate the problem area, check values for validity, and send alerts to Vermont Energy Investment Corporation and the customer when there is an error. In order to be reliable our system must be able to last 5 installations. To ensure this, we measured the battery life of the system as well as the amount of data it is able to log and buffer. We also tested the durability of the system. We made sure our system was adaptable by first testing each sensor to ensure that it performed to the necessary standards. Then we tested an entire node with different sensor configurations. 13 We tested several nodes transmitting data simultaneously to the online database. We also tested the system’s ability to cover an area of 20,000 sq. ft. 3.4 Objective Results This section will analyze whether we were able to meet our main five objectives that we set out in the beginning of the project. 1. Low Cost In the original problem statement, it set the total cost of the system as $1000. We were able to create a system node for a total cost of $252.07. This means we could have 4 nodes in a building which would be adequate to cover the 20,000 sq. ft. Using a low cost microprocessor and minimal part we were able to satisfy this objective. 2. Ease of Use Our system needs to be easy to use and have a good user interface for both our client and their customers. In order to achieve this we tried to make the node as simple to use as possible once it was constructed. The setup performed by the Efficiency Vermonts employee is simple and does not take much time. We implemented a Java GUI running on an SD card which allows the client to enter information about where the node is being deployed as well as the important information of connecting to a thingspeak account. Once they have made an account all they have to do is plug the SD card into the Arch GPRS and flip the power switch to start the program. Initially the node will enter a debug mode where it will transmit data every 30 seconds for 15 minutes in order to make sure it is working correctly. Once the building manager receives the package with the node all they have to do is install the node according to Efficiency Vermont’s instructions using the multiple attachment methods on the case and flip the switch to start transmitting. Using an easy to use GUI and a configuration file we were able to create a simple user interface and meet this requirement. 3. Reliable Our design must be reliable to be able to troubleshoot any problems, deal with outages, and last for multiple installments. We designed two specific ways of troubleshooting the system. The first is the debug mode built into the code. For the first 15 minutes, the node will send data 14 every 30 seconds to make sure it is transmitting correctly. The system will also write any errors that happens while running to an error log file on the SD card. Each error (did not connect to the network for example) will be written to the txt file with a timestamp. Our system also writes every value it reads onto the SD card to a csv file so it can be accessed after in case of an outage. The system is able to last five installations due to the configuration file and reliable parts. However, we had some problems getting the battery life to last 3 months. As seen in our analysis it will not last that long. We were able to most satisfy this objective with our project. 4. Adaptable The system must be adaptable to work in a variety of buildings. There were two parts to this objective: variety of sensors and connection in a range of locations. SInce we choose to use a cellular network to transmit data there will be some buildings that do not get a connections and will not be able to transmit. However, the system was able to transmit in all the buildings that we tested. We were only able to get the temperature, humidity, and light sensors to work. We were hoping for a larger range of sensors. However the light sensor is plugged into a analog input so the system could be configured for any sensor with an analog. For the most part we were able to meet this objective. 5. Easy to Ship Our system had to be able to be shipped in the mail to reduce the travel of Efficiency Vermont employees. We were able to achieve this objective by creating a compact and durable casing for the node that would be able to be shipped. 15 4. Function/Means/Requirements Analysis 4.1 Black Box Function Diagram To get an idea of our project, our team used the black box and expanded black box, shown below in Figure 7 and Figure 8. These black box diagrams gave us an idea of what our inputs to the system were, what functions our system will perform, and what the expected outputs are. Figure 7 . Black Box Diagram Figure 8. Expanded Black Box Diagram Key Functions: 16 The most significant function is to gather environmental data from the building that is being audited. To do this our system will use the following sensors; temperature, humidity, magnetic field, voltage, and current. Each sensor must buffer data incase of a connection outage and will be able to send the collected data through a mesh network to gateway. The gateway will be the hub of the entire system, it will collect the data from the sensor nodes in the mesh network, data log incase of connection outage, and transmit the data to the cloud via cellular or wifi. Overall, our system will take the environmental information and battery power as inputs and the outputs will be sensor data in the cloud as well as outage alerts if necessary. 4.2 Functions/Mean Tree To completely understand what our system needed to do and how our team was to accomplish this, we created the functions/mean tree shown in Figure 9. Figure 9. Function/Mean Tree, where blue boxes represent functions and white boxes represent means of our system. As shown above, most of the subfunctions only have one or two means since they are limited or constrained by the problem statement. Two notable subfunctions are how the data will be sent to the gateway and how the data will be sent to the cloud and remote server. Our team is planning on setting up the sensors in a mesh network that would relay the data to the gateways. However, we are also exploring the option of having standalone sensors that send the data to the gateway or even directly to the cloud. Our client has specified that a cellular connection 17 between the gateway and the cloud is prefered however we are also exploring the option of having an addition connection opportunity through the use of WiFi. 4.3 Requirements Gather Environment Information Our client’s main objective for our project is to gather environment information to perform an energy audit. Data points must be measured every five minutes to get an impression of what is happening inside the building that is being audited. This will be easy to check by trial, if the data is not being measured every five minutes there is an error and the sensor node will be troubleshooted. The Arch GPRS V2 must have 3 months of battery life. To test this, our group will perform multiple small timeframe tests on operation of the device when the device has various amount of charge left to ensure this battery life will be satisfied. The system must be able to cover 20,000 square feet. To test this, our group will perform various small scale testing and eventually a large scale test to make sure the area covered is sufficient. Finally, the data must be recorded accurately. To ensure this, our group will have to test and compare measurements done by hand and those done by the sensor. Buffer Data The buffering of data must reliably store the data collected at a minimum of two weeks. To test this, our group will perform small timeframe testing to measure the reliability and after move up to the full two week timeframe testing. Log Data The logging of data must be reliable to store data collected at a minimum of three months. To test this, our group will employ the same strategy as in the buffer data case, however due to time constraints we will only employ long term testing up to a certain point. Send Data to Gateway Sending data to the gateway must be reliable. To ensure this reliability, our group will complete a series of tests where data is sent across sensor nodes to the gateway. Having known the data that was transmitted, the received data at the gateway should match this transmitted data. If not our system has an error and the troubleshooting process must begin until the error is fixed. Send Data to Remote Server 18 Sending data to a remote VEIC server must be reliable as well, due to VEIC needing this data to perform data analysis to make these buildings more efficient. To test this our group will employ the same method as above. Knowing the transmitted data, we can check whether the same data was received at the remote server. If not our system again has an error and we will troubleshoot to fix this. Check for Outage and Send Outage Alert Checking for an outage is simple, if data cannot be transmitted or data isn’t being received then there is an outage. Our group will perform tests on both the transmitting side and receiving side. On the transmitting side, if the device cannot transmit data to the cloud there is an outage and an alert will be sent. On the receiving side, if no data is received in a given amount of time there is an outage and an alert will be sent. In trials, if this procedure does not work properly we will troubleshoot to fix this error. Cost Effective Our finalized total system cost must be $1000 and must last five installations. These constraints are in place to make sure our system will be cost effective to employ. To test whether or not our system will last five installations, we will simulate the conditions of shipping and packaging our final system multiple times to ensure our system works properly. Simple Set Up Our system will be set up by someone with rudimentary or no training at all. To accomplish this task, we will create written and/or online instructions. Testing whether someone can set our system up, we will perform multiple trials on a test group and improve our instructions until our system can be simple enough to set up by almost anyone. Easy to Ship Our final product must be easy to ship. To test this we must make sure our final product can fit into the dimensions of a package. 4.4 Function Results 19 5. Design Details 5.1 Node Design Our node design is shown in Figure 10 below. Figure 10. Node design Each node contains the following parts: ● Arch GPRS V2 Development Board and cable ● Breadboard and wires ● DH22: Temperature & Humidity Sensor ● TEMT6000: Ambient Light Sensor ● Vodafone Sim Card5MB/mo for 2 yr ● 4GB MicroSD Card ● DS1307 Real Time Clock Module ● 6Ah Polymer Lithium Ion Battery ● LiPo Rider Battery Charger ● 3D Printed Case with screws and nuts ● Velcro 20 Figure 11. The Arch GPRS V2 development board. The Arch GPRS V2, made by Seeed Studio, is an mbed enabled development board. The Arch GPRS V2 was chosen because it houses a SIM900 cellular networking module along with a built in microSD slot. It holds the LPC11U37 microcontroller; has a low power ARM CortexM0 core; and 128kB flash, 12kB SRAM, and 4kB EEPROM on chip memory. Figure 12. The DHT22 temperature and humidity sensor. The DHT22 is a digital temperature and humidity sensor that requires 3.36V input voltage, 11.5mA measuring current, and 4050 uA standby current. It can measure humidity from 0 to 100% RH (relative humidity) and temperature from 40 to 80 degrees Celsius. It has 2% RH accuracy and 0.5 degrees Celsius accuracy. 21 Figure 13. The TEMT6000 ambient light sensor breakout board from SparkFun Electronics. The TEMT6000 ambient light sensor is a silicon NPN epitaxial planar phototransistor in a miniature transparent mold for surface mounting onto a printed circuit board. The device is sensitive to the visible spectrum. The device acts like a transistor, where greater incoming light will rise the analog voltage on the signal pin. In the code, a scale is created to determine if a room is dim or bright and this is displayed to the user. Figure 14. The RTC (real time clock) module from Sparkfun Electronics. 22 The DS1307 RTC module keeps track of the year, month, day, and time up to the second. The module is necessary to timestamp the data so that it can be backed up on the microSD card . The module includes a small CR1225 Lithium coin cell battery that will run the RTC for a minimum of 9 years (17 years typical) without any external power supply. Figure 15. The 6Ah polymer lithium ion battery from Sparkfun Electronics. The 6Ah polymer lithium ion battery consists of a triple pack of very slim, extremely lightweight batteries. Each cell outputs a nominal 3.7V at 2000mAh. The three cells have been matched for internal impedance and can be fully charged and discharged in parallel. The entire battery is rated to 1A continuous discharge. The Vodafone sim card and microSD card are placed in the Arch GPRS V2’s respective slots. The DH22 temperature & humidity sensor, the TEMT6000 ambient light sensor, the DS1307 real time clock module, and the battery are connected to the Arch GPRS V2. Some connections require a breadboard and wires. The system fits inside the 3D printed case. The battery is placed in the bottom of the case and the Arch GPRS V2 board rests on top of it. There are slots in the side of the case for the sensor wires to fit through, as well as the microSD card. Velcro is attached to the case for easy attachment to surfaces. The total cost estimate of a node is $288.28. 23 5.2 System Design Through a cellular connection, each node transmits data to a ThingSpeak API as diagrammed in Figure 16. Figure 16. System design Figure 17 shows plotted temperature and humidity data on our ThingSpeak account. 24 Figure 17. Data acquisition (humidity and temperature) 25 5.3 Casing Design Problem: The primary objective of the enclosure is that it will properly secure and protect the node’s components from damage. The case needs to provide impact durability to extend the system’s lifetime. Each node in the system consists of an Arch GPRS V2 connected to a DH22 temperature & humidity sensor, a TEMT6000 ambient light sensor, a DS1307 real time clock module, a LED, a switch, a polymer lithium ion battery , and a polymer lithium ion battery charger . All of these parts must be fastened to ensure the components are not hitting each other inside of the enclosure and failing. Although a node may not require all of the sensors, each node must have the capability to connect to them. The sensors must be placed outside of the case to monitor environmental conditions. Therefore each of these sensors must be properly secured to the outside of the casing. Also, each case will need to be closed and opened with easy to allow for access of inner components for repair, maintenance, and debugging. The secondary objective is designing a case that is visually appealing and that can be secured anywhere inside a building. This objective is of the utmost importance as our client has stressed that if the system does not look professional or visually appealing, the customer’s will not be interested in the finished product. Alongside this idea is that the case must be user friendly. The user must be able to turn on the system easily with the power switch, insert the microSD card into the Arch GPRS V2 with ease, charge the battery without opening up the case via mini USB, and upload code to the Arch GPRS V2 without opening up the case. Finally, the case must be secured anywhere inside a building while being the least intrusive or damaging to the building. Approach: Our team wanted to make our casing design easily improved or edited as well as being easily manufacturable. Therefore the choice was to design our case using Onshape, a cloud based 3D CAD system, and 3D printing. Onshape was chosen because of its versatility. It is the first and only fullcloud 3D CAD system. This is beneficial because not only can you pull up and edit a model from any computer, but you can also corroborate and improve your design with others. Thereby Onshape helped reduce the time necessary to complete our 3D modeling of our casing. 3D printing was chosen because the technology is readily available to produce our cases quickly with a high level of precision. 26 Realizing that our team was going to use 3D printing to make our casing, the logical next step was to research materials to print with. Our team quickly narrowed materials down to two options: PLA plastic or LAYWOOD3. PLA plastic is a very common 3D printing material. It is odorless, lowwarp, and one of the more ecofriendly 3D printing materials. PLA was chosen due to its strength and that it is available in a wide range of colors, which was necessary for the aesthetics. LAYWOOD3 was chosen as it was the most visually appealing as well as being made of recycled wood. It has the ability to be cut, painted, and sanded. It is even possible to give printed parts a wood grain appearance by varying the temperature during printing. Following our material choices, our team set out to design the casing using Onshape. Using a caliper for accurate measurement, we measured all components of the system to get a sense of how large the case had to be as well as making sure all components would fit inside the case. For our first case iteration, we designed a rectangular box with a removable lid. Screws and nuts were used to secure the lid when the case was closed. The case was printed with PLA plastic. The battery was placed in the bottom of the case, the Arch GPRS V2 on top of it, and the additional hardware above the Arch. The case had slots for the following components: three sensors, microSD card, LED, battery charger, computer cord, and antenna. Our cases were printed using a Flashforge Creater Pro 3D printer, which was accurate enough for our design. Following our first case iteration, we attempted to use the LAYWOOD3 material. Yet the material was harder than expected to print, as the material would easily crack. Our team was unable to get the temperature just right for the material, therefore we abandoned it for the PLA case which was already exceptional. We considered various methods to attach the case to the wall: velcro, zip ties, and adhesive strips. Each attachment has its benefits and drawbacks. If we went with the velcro approach, we would attach one side of the velcro to the case and have the user attach the other side of the velcro to the surface where they wanted the case to be mounted. It would be simple for the user to take the case off of the wall mount; however, it would be very difficult to take the velcro off of either the case or the wall. If we used zip ties, we would need to print hooks on the case for them to attach to. The zip ties would then need to be wrapped around pipes or similar building features. This method would limit the surfaces the case could be mounted to. The third option would be to attach the case to the wall surface using adhesive strips. These are slightly less 27 strong than velcro, but would still be able to hold the node’s weight. They are fairly easy to peel off surfaces when they are no longer needed. Results: Our team wanted to make our final case user friendly, visually appealing, durable, and practical. Therefore we designed and printed a compact case that encompasses all of these ideas well. Using PLA we printed the case shown in Figure 18 below. We are presenting to our client velcro, zip ties, and adhesive strips as possible methods of securing our casing to the customer’s building. (a) (b) Figure 18. The bottom of the casing for the system. The battery is rested on the bottom of the case with the Arch GPRS V2 resting on top of the battery. The Arch GPRS V2 is then fastened with screws via the bottom through holes to secure both it and the battery. Note there is a slot for the microUSB on (a) to the left and there is a microUSB slot on (b) in the center. 28 (a) (b) Figure 19. The top of the casing for the system. There are a total of nine through holes for this part, eight of which are for fastening both the bottom of the case to the top as well as the mini USB battery charger and the other larger hole is for a LED indicator. The center cut shown in (a) is for a mini USB to be plugged in with ease. Note all edges are smooth for aesthetics in (b). (a) (b) Figure 20. The total assembly of the case. In (a) you can see the on the top left a slot for the power switch and on the top center the slot for the mini USB charger. In (b) you can see the three rectangular holes for the sensors to go through to sense their environment as well as two through holes on the side to secure the antenna of the Arch GPRS V2. 6. Analysis/Modeling/Simulation Results 29 Our group analyzed the following aspects of our wireless building monitoring system for energy audits: 1. Microcontroller 2. Sensors 3. Logging and Buffering Data 4. Transmission of Data 5. Data Collection and Live Stream The following is a summary of the problems we each analyzed, our approaches, our results, and how these findings impact our design. 30 6.1 Microcontroller Problem: We need a microcontroller system to connect with sensors and other hardware to collect environmental data. It needs to utilize a cellular connection to send data. It must have the appropriate sleep functions and battery capability to last at least 3 months on a single charge. Approach: We researched various platforms that could be used in our system. It was important to consider how compact they are, how they would connect with sensors and other hardware, and their cellular capabilities.We also looked for the abundance of documentation and libraries, Results: Arch GPRS V2 is the new improved version of the Arch GPRS development board from Seeed Studio. It is an mbed enabled development board that houses a cellular networking module along with a microcontroller. The Arch GPRS V2 uses the LPC 11U37 microcontroller instead of the LPC11U24 used on the Arch GPRS. You can use the mbed C/C++ SDK, libraries and optimizing online development tools to rapidly build your prototypes. mbed is a platform and operating system for the internet connected devices based on 32bit ARM CortexM microcontrollers. Such devices are also known as Internet of Things devices. Applications may be only developed for the mbed platform using the mbed online IDE, a free online code editor and compiler. Code is written and compiled within a web browser and compiled on the cloud using the ARM C/C++ compiler. The cellular networking module on the Arch GPRS V2 is the SIM900 Quadband GSM/GPRS engine from SIMCon. With this, data collection functions can be performed easily using the 2G GSM.GPRS based cellular network. How This Impacts Our Design: The mbed enabled Arch GPRS V2 is a great microcontroller for what our design consists of. The low power ARM CortexM0 core will have great sleep characteristics (<2mA). Mbed will 31 provided great online development tools along with forums and documentation. The SIM900 Module will allow us to send the data to the cloud. Also, there is a built in microSD card slot on the bottom of the board. 6.2 Sensors Problem: Our wireless building monitoring system will utilize a variety of sensors to collect data on the building. Ideally, the system will have sensors that measure the following: ● Temperature & Humidity ● Light Level All of the sensors need to be compatible with the Arch GPRS V2. Looking at the tech specs provided, the Arch GPRS V2 microcontroller has 3.35V power. All sensors considered must be within this range of operation. The Arch GPRS has both analog and digital pins, therefore both analog and digital sensors can be used in our system. The sensors must be tested for the following: ● compatibility ● accuracy ● power consumption Approach: Choosing the correct sensors for our project is key, as collecting data is imperative for a wireless building monitoring system. Cost, accuracy, compatibility, power consumption, and flexibility of sensors were main focuses for this analysis. Results: Temperature and Humidity Sensor 32 The requirements of relative temperature and humidity are met by the digital output sensor shown in Figure 21. And the circuit schematics is shown in Figure 22. Although size is not a leading requirement, the size of the sensor is only slightly larger than a quarter which should reduce the cost of 3D printing material for the sensor’s case. The tech specs for this sensor are the following: 3.3V to 6V input, 1mA to 1.5mA operating current, and 40 µ A to 50 µ A standby current. Therefore this sensor is compatible with both our platforms and the sensor will consume low amounts of power. The sensor is capable of measuring relative humidity(RH) from 0% to 100% and has an accuracy of +2% RH. The sensor also has a temperature range between 40℃ and 80℃ and has an accuracy of +0.5℃. Therefore this sensor fulfills the accuracy requirement from our client. Every measurement taken requires storage of 40 bits. Our client specified that a measurement should be taken every 5 minutes and will need to be kept for a maximum of 12 months. Therefore, the approximate storage needed for this one sensor is approximately 4.3 megabytes. After looking at a variety of temperature and humidity sensors, this seems to be the best fit for our project due to low cost ($9.95 per unit) and accuracy. Figure 21. The temperature and humidity sensor ( https://www.sparkfun.com/products/10167 ) Figure 22 shows the typical setup of the temperature and humidity sensor, which consists of two parts: the sensor itself and the microcontroller. 33 Figure 22. The temperature and humidity sensor circuit schematic Light Level Sensor The requirement to measure light level is met by the digital output sensor shown in Figure 23. And the circuit schematics is shown in Figure 24. The sensor works by varying its resistance depending on the amount of light the sensor is subjected to. The resistance will decrease as the light level increases. In bright light, the resistance will measure 20KΩ. In the dark, the resistance will measure 1MΩ. The output of the sensor will be HIGH in bright light and will be LOW in the dark. Our client only wishes to know if the light is on or off, therefore this sensor meets the accuracy requirement of our project. The sensor is compatible with both of our platforms and consumes a low amount of power. The sensor requires 3 5V power and a supply current of 0.5 3mA. The sensor is also under the size of a quarter, which helps our size requirement. At a cost of $2.90 per unit, the sensor is low cost. Figure 23. The light level sensor ( http://www.seeedstudio.com/depot/GroveLightSensorPp1253.html ) 34 Figure 24 shows the typical setup of the light level sensor. There are only two extra necessary parts to set the sensor up, which include one resistor and a microcontroller. Figure 24. The light level sensor circuit schematic 6.3 Logging and Buffering Data Problem: Since our wireless building monitoring system will be exposed to a variety of environments, it is very possible that it could experience a network interruption. As a preventive measure our client has requested that the node must be able to log data for 12 months. Data will be logged at 5minute intervals. We needed to analyze the methods in which data could logged for our system. Approach: Our system must use a microSD card to log data from the Arch GPRS V2. We need to estimate how much data the system will be logging in order to purchase the correctlysized microSD card. We needed to explore several online platforms that could be used to log our data. The online platform must be able to take data that is transmitted through a cellular connection. The data 35 must be displayed in a manner that is easy for Efficiency Vermont and the building monitor to observe. Results: We first looked at how much data we will be storing at any one time for an Arch GPRS V2 with all sensors attached. Data will be collected at 5minute intervals for 2 weeks. Supposing each data point is an integer and is 4 bytes from each of our sensors and we are collecting data from 3 sensors, plus a 14 byte timestamp, then we would need the following minimum storage: 30 days 60 minutes (12 months)( 1 month )( 24 hours 1 day )( 1 hour ) = 5 18, 4 00 minutes of data logged by each sensor 1 (518, 4 00 minutes)(26 bytes of data)( 5 minute sampling time ) = 2 , 6 95, 6 80 bytes of total data collected This means that for logging data we would need a minimum of 2.696 MB of storage. How This Impacts Our Design: We decided to purchase a 4GB MicroSD Card for each Arch GPRS V2. Since microSD cards with large amounts of capacity are very cheap today this seemed to make the most sense. This will allow for data being logged for more than 12 months at a time. Also, there will be plenty of space in case the mircoSD card is not cleared before a new installation. 6.4 Transmission of Data Problem: Our system needs to be able to cover an area of 20,000 sq. ft. reliably. We need to make sure that the amount of data we are transmitting can be handled by the network. We explored two options for transmitting data: through a cellular network and a wifi network. Approach: 36 We first looked at the stability of each system and then how robust they are against failures. Adaptability and cost were other important factors to consider in the analysis as well. We also estimated the amount of data we are transmitting. Results: Cellular Network Cellular network is a system with higher capacity. The smaller the size of the cell the greater the number of concurrent users. A cellular network is also a more stable system. For small cells there is limited interference, while for huge cells there are a number of interfering signals. Also, since cellular systems are decentralized, they are more robust against the failure of single components. This is because if a cell tower fails then another tower can pick up the signal, whereas wi fi network is weaker because the router can fail and in turn the entire network will fail. WiFi Network Compared with cellular network, the wireless nature of such networks allows users to access network resources from nearly any convenient location within their primary networking environment. Users connected to a wireless network can maintain a nearly constant connection with their desired network as they move from place to place. Wifi has strong adaptability, which is exactly what we need for our system to work on a variety of buildings and environments. Initial setup of an infrastructurebased wireless network requires little more than a single access point. On the other hand, wired networks have additional cost and complexity as they have physical cables being run to numerous locations. Our customers will need their routers to build their own wifi network. Like any radio frequency transmission, wireless networking signals are subject to a wide variety of interference as well as complex propagation effects that are beyond the control of the network administrator. Security is a weakness of the wireless network. How This Impacts Our Design: Based on the most important object, reliability, using a cellular network is the most appropriate choice for our design. There is also a big issue of security for the wifi network. 37 6.5 Data Collection and Live Stream Problem: It is important for our client to be able to have access to a live stream of the sensor data online to make sure the sensors are transmitting and reporting correct values. In order to do this we will need an online tool to collect the data and display the live stream. Approach: We will use an online service to receive and collect the data. The comparison of the options we considered is below. Ease of setup and use are our primary concerns. Results: ThingSpeak ThingSpeak is an open API and allows for realtime data collection. Users sign up for an account. They can create a channel for each node in the system. Data is presented graphically with respect to time. Each channel can have multiple field which can collect data from multiple sensors. The data can then be exported as a CSV. A huge benefit to ThingSpeak is that is is extremely easy to setup and the user interface is simple. However the API of ThingSpeak only allows for one timestamp of sensor data to be sent at a time. GroveStreams is another platform that could be used to collect, store and visualize data. Its open API allows you to send millions of streams of data to their cloudbased system. Each Arch GPRS V2 can send streams or a point stream at a fixed interval. Data streams can be sent at up to 10 second intervals with up to 10 individual data points. Up to 94,000,000 data points per stream can be stored in a secure, reliable, bigdata cloud network (three years of 1 second resolution data). Data can be downloaded for additional backup or offline analysis. GroveStreams provides customizable charts and graphs to visualize data. It also has notification tools to alert you to take action when predefined or userdefined events occur. These notifications can be in the form of text, email, HTTP calls, and GroveStream platform messages. 38 Xively is a third platform option that allows developers to connect sensorderived data. It provides internet of things connectivity that is fast, secure and scalable. In a single interface, connected users are able to manage their connected devices and their data. Users create a Xively account, add their device and channels, import the Arch GPRS V2’s program, and customize the sensor labels. Sensor values are displayed in channel graphs. How This Impacts Our Design: Ideally, we would have used Xively since it has some documentation with the Arch GPRS already and fits our needs. However we were unable to get an account. Therefore due to the ease of use, we choose ThingSpeak as our online tool. We were unable to get a successful test of the grovestream API however if battery lifetime was a concern it would be worth it to pursue this in order to send multiple data points at one time. 7. Test Results For testing of our system we are to compare the data collected from our system to the existing sensor that are deployed at Efficiency Vermont. The HOBO datalogger is the current sensor station they use to monitor buildings. 7.1 Accuracy of sensors Figure 25 :On the left we have the HOBO and the right our system 39 Figure 26: Test results between HOBO and our system’s temperature sensors Figure 26 above is our test results for the temperature sensors. The blue is the HOBO’s data and the grey is our system’s data. As you see, the HOBO provides more accurate data then our system. This we believe is result from our code. Also our systems temperature changes more rapidly than the HOBOs, this is desired when monitoring buildings. We believe this result is because the HOBO’s temperature sensor is inside the casing while ours is outside. 40 Figure 27: Test results from HOBO’s and our system’s humidity dat Figure 27 above is our test results for the humidity sensors. The orange is the HOBO’s data and the yellow is our system’s data. As you see, the HOBO provides more accurate data then our system. We still believe that our humidity sensor is sufficient to run energy audits. 7.2 Repeated Installations We determined that our system would last 5 installations due to our system setup and choice of components. The configuration file allows the same node to be used for as many different buildings and configurations of sensors as possible. The rechargeable battery and easy access to the battery charger allows the node to be recharged without opening up the case. The rest of our components were chosen to last for multiple installations. 41 7.3 Cellular connection To test cellular connection we used the trial and error approach with different buildings made of different materials. We know that the Votey Engineering building is one of the worst for cellular connection. We found that in some rooms in Votey our system connected while most others our system failed to connect. Our system will not be adequate for a building like Votey. 7.4 Battery consumption Figure 28: Test results for battery power consumption. Figure 28 above shows the current being drawn from the battery when our device goes from sleep mode, waking up, collecting environmental data, turning on the SIM900 module, sending data to ThingSpeak, turning of the SIM900 module, and then going back to sleep. When in sleep mode the system is drawing about 8mA. If our system is only in sleep mode it will last 750 hours ( 6,000 mAh / 8mA = 750 hrs) which is about 1 month of usage. For our system to meet our objective of lasting a minimum of 3 months we must perform further R&D to have our sleep mode enter a deeper sleep of about <2mA. 42 7.5 Data Usage Analysis For our system we bought a data plan that has 5MB/month. In order to make sure we had enough data to transmit every 5 minutes we divided the month into number of transmissions: Then, we divided the monthly data limit by the number of transmissions: Assuming that we are not using more than 500 Bytes per HTTP request that we send to ThingSpeak we have plenty of data. 8. Conclusion Our system does not meet the objective of lasting at least 3 months on a single charge, even with our large 6Ah lipo battery. To upload the data to thingspeak our system had to turn on the SIM900 module, connect to the cellular network, send the data through a HTTP request, and then power down the SIM900. These maneuvers to upload data were very expensive in terms of power consumption. To combat this issue one solution would be to upload large amounts a data once a day instead of the 288 uploads we are currently performing. We were limited doing this approach by using ThingSpeak, so we would need to find another viable IoT online database that can handle bulk data uploads. Another issue with our power consumption was the sleep mode our system entered was only able to reach as low as 8 mA. In order for us to have reached our goal we would need our sleep mode to reach sub 2mA. A third way to combat the power consumption issue would to use the strategy of dead band compression. Dead band compression is when we would not upload equal consecutive data, this would decrease the number of uploads per day and save power. In conclusion, we’ve met most of the important objectives and in the end created a low cost monitoring system that will last about 30 days on a single charge. 43 9. References “3D Printer Filament Comparison.” MatterHackers. N.p., n.d. Web. 20 Apr. 2015. <http://www.matterhackers.com/3dprinterfilamentcompare>. "About Us." PanStamp . N.p., n.d. Web. 21 Sept. 2014. <http://www.panstamp.com/aboutus/>. Akshay, N. , Kumar, M.P. , Harish, B. , & Dhanorkar, S. An Efficient Approach for Sensor Deployments in Wireless Sensor Network, Emerging Trends in Robotics and Communication Technologies (INTERACT) , 35 Dec. 2010: 350355. < http://ieeexplore.ieee.org/xpl/articleDetails.jsp?tp=&arnumber=5706178&contentType=Co nference+Publications& >. Anbya, M.F.B. , Salehuddin, M. , Hadisupadmo, S. , & Leksono, E. Wireless sensor network for single phase electricity monitoring system via Zigbee protocol. Control, Systems & Industrial Informatics (ICCSII), 2326 Sept. 2012.: 261266. < http://ieeexplore.ieee.org/xpl/articleDetails.jsp?tp=&arnumber=6470512&contentType=Co nference+Publications& >. "Billions and Billions." ThingSpeak. N.p., n.d. Web. 20 Apr. 2015. <https://thingspeak.com/>. "BuildingIQ Solutions." BuildingIQ . N.p., n.d. Web. 21 Sept. 2014. <http://www.buildingiq.com/solutions/>. "Data Validation Algorithm for Wireless Sens Networorks." Hindawi . Ed. Yu Gu. International Journal of Distributed Sensor Network, 2013. Web. 01 Oct. 2014. Fawzy, Asmaa. "Outliers Detection and Classification in Wireless Sensor Networks." Science Direct . Elsevier, July 2013. Web. 01 Oct. 2014. Figo, Davide. "Preprocessing Techniques for Context Recognition from Accelerometer Data." Personal and Ubiquitous Computing 14 (2010): 64562. Instituto Superior Tecnico, 2010. Web. 1 Oct. 2014. Mcouat, Joanna. "Wireless Sensor Networks." Google Books . Springer Science, 23 Oct. 2013. Web. 01 Oct. 2014. Nikola Janjic, Technical Reference User Manual (TRM) Measure Savings Algorithms and Cost Assumption. 8 Sept. 2013. 44 < http://www.greenmountainpower.com/upload/photos/371TRM_User_Manual_No_201382 5protected.pdf >. "Overview." First Fuel . N.p., 2014. Web. 21 Sept. 2014. <http://www.firstfuel.com/platform/overview/>. Wikipedia, United States Frequency Allocations Chart 2011 The Radio Spectrum. 1 Aug. 2011. < http://en.wikipedia.org/wiki/File:United_States_Frequency_Allocations_Chart_2011__Th e_Radio_Spectrum.pdf >. “Storage and Analytics for the Internet of Things.” GroveStreams. N.p., n.d. Web. 20 Apr. 2015. <https://grovestreams.com/index.html>. "SkySpark." SkyFoundry . N.p., n.d. Web. 21 Sept. 2014. < http://www.skyfoundry.com/skyspark/ >. "Xively by LogMeIn." Xively. N.p., n.d. Web. 20 Apr. 2015. <https://xively.com>. Appendices A. Users Manual VEIC StepByStep New Node Documentation: Steps for setting up ARCH for Windows 8 computer: 1. Go to Settings a. Change PC Settings b. Update & recovery c. Recovery > Restart now d. Troubleshoot > Advanced options > Startup Settings > Disable driver signature enforcement 2. Download zip file: https://mbed.org/media/uploads/samux/serial.zip 3. Save file and extract 45 4. Open Device Manager 5. Action > Add Legacy Hardware > Next a. Install the hardware that I manually select from a list (Advanced) > Next b. Ports (COM & LPT) > Next 46 c. Have Disk… d. Browse… [select file downloaded in Step 1] > OK Create mbed account 1. Go to https://developer.mbed.org/ 2. Click the Login or Signup button in the upper righthand corner 3. Click the Signup button to create an account VEIC StepByStep Existing Node Documentation: Create ThingSpeak account: 1. Go to https://thingspeak.com/ 2. Click on the Sign Up button in the upper righthand corner 3. Fill out information and click the Create Account button 4. Create New Channel 5. Click “Channel Settings” tab 6. Enter Fields for each sensor (DHT sensor has two fields: Temperature and Humidity) 7. Click “Save Channel” 47 8. Click the “API Keys” tab, and copy the Write API Key Configure the Arch GPRS V2 1. 2. 3. 4. 5. Run the executable file on the microSD card Fill out the following information, including the API key from step 6 Remove the microSD card from the computer and insert it in the Arch GPRS V2 Turn on with the power switch and it will begin recording. If configured correctly, LEDs will flash. Building User StepByStep Documentation: 1. Open package and take out nodes(s) 2. Attach node(s) according to directions 3. Flip power switch to On position 4. Log on to ThingSpeak account and make sure data is being transmitted 5. Contact Efficiency Vermont if node does not turn on or no data is transmitted 48 B.Total Budget 49 Above you will find our total budget for the project. We’ve spent a total of $1,619.94 which is less than 35% of our $5,000 budget. C. Bill of Materials Below you will find the our bill of material for one node. D. Schedule The figure shown below is our team’s Gantt chart, which shows our schedule plan over the of the design. 50 51 52