1
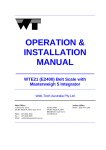
making BETTER FERTiLiSER DECiSiOnS FOR CROPPing SySTEmS in aUSTRaLia
uSeR MANuAl
MAKING BETTER FERTILISER
DECISIONS FOR CROPPING
SySTEMS IN AUSTRALIA
making BETTER FERTILISER DECISIONS FOR CROPPING systems IN AUSTRALIA
NSW Department of Primary Industries
161 Kite Street, Orange NSW 2800
www.bfdc.com.au
Acknowledgements
The database of historic nitrogen (N), phosphorus (P), potassium (K) and sulphur (S)
soil test–crop response trials for cereals, oilseeds and pulses established through the
Making Better Fertiliser Decisions for Cropping Systems in Australia project (BFDC),
and the BFDC Interrogator tool that was built to query the data, are being used to
underpin all FERTCARE® fertiliser recommendations in Australia as the best available
data. BFDC will also be used in the auditing of FERTCARE® accredited Decision Support
Systems and FERTCARE® Accredited Advisors where these provide the basis for fertiliser
recommendations in cereal, oilseed and pulse crops.
The user manual was written as part of the project to enable potential users of the
BFDC Interrogator to understand, develop and use soil test–crop response relationships
as part of soil test interpretation.
The BFDC project was supported by the Grains Research and Development Corporation.
It was led by NSW DPI and includes substantial collaboration with the fertiliser industry
(including the Fertiliser Industry Federation of Australia, International Plant Nutrition
Institute, Incitec Pivot Fertilisers, CSBP, Summit Fertilisers, Impact Fertilisers, and
Superfert), consultants (Back Paddock Company, Geographic Web Solutions,
K I P Consultancy Services, Reuter and Associates, and Dodgshun Medlin), State and
federal agencies (SARDI, DEEDI QLD, DAFWA, Vic DPI, TIA, and CSIRO), agribusiness
(Landmark and Elders), and universities.
Disclaimer
The information contained in this BFDC user manual is based on knowledge and understanding at the time of writing —
March 2012. The information contained in this publication is provided as general information only and is not a substitute
for a fertiliser recommendation derived from a decision support system. Users should obtain any appropriate professional
advice relevant to their particular circumstances.
The BFDC Database has been created using information provided by third parties. The State of New South Wales, the
authors and publisher take no responsibility for the accuracy, currency or reliability of any information included in the
Database. To the full extent permitted by law, the State of New South Wales excludes all liability arising from or connected
to the use of or reliance on any material contained in the BFDC Database, including without limitation any interference
with or damage to a user’s computer system, software or data.
First published: March 2012
Edited: Hot Tin Roof Communications
Design and layout: Megan Hele Design
© The State of New South Wales through the NSW Department of Primary Industries, an office of the
NSW Department of Trade and Investment, Regional Infrastructure and Services.
ISBN: 978 1 74256 269 8
Making Better Fertiliser
Decisions for Cropping
Systems in Australia
BFDC Interrogator
user manual
Instructions for using the BFDC Interrogator for examining
State and regional calibration relationships and soil test criteria
for single-year trials
Graeme Watmuff
Geographic Web Solutions
Doug Reuter
Reuter and Associates
Simon Speirs
NSW Department of Primary Industries
Ben White
making BETTER FERTILISER DECISIONS FOR CROPPING systems IN AUSTRALIA
BFDC
4
user manual
making BETTER FERTILISER DECISIONS FOR CROPPING systems IN AUSTRALIA
Contents
Obtaining access to the BFDC Database ........................................................................................... 6
What is a calibration relationship? ......................................................................................................... 7
Standardisation of soil test data ............................................................................................................. 8
Interrogation procedure .............................................................................................................................. 8
Examining data in the calibration relationship ............................................................................. 20
Longer-term trials ....................................................................................................................................... 23
Appendices .................................................................................................................................................... 24
Appendix 1: Standardisation of soil test values .................................................................................................... 24
Appendix 2: Soil pHCaCl2 diagnostic ........................................................................................................................ 25
Appendix 3: Relationships between PBI and PRI and PBC sorption tests ............................................. 26
Appendix 4: Classification of PBI status .................................................................................................................. 27
Appendix 5: Conversion of exchangeable potassium (mg/kg) to Colwell K (mg/kg) ..................... 28
Appendix 6: Approximate relationship between Australian Soil Classification
and Great Soil Groups ....................................................................................................................................................... 29
References ...................................................................................................................................................... 30
The Better Fertiliser Decisions Framework
will make accessible all available fertiliser trial
data across all Australian cropping regions.
Its success relies on you.
BFDC
5
user manual
making BETTER FERTILISER DECISIONS FOR CROPPING systems IN AUSTRALIA
Obtaining access to the National
BFDC Database
To obtain access to the BFDC Database
and Interrogator, users need to
successfully complete a training course.
Please visit www.bfdc.com.au for more
information.
People attending the BFDC training courses will
be given a temporary username and password to
access the BFDC Interrogator.
Simon Speirs, NSW DPI
After completing the course participants need
to respond to the automated email they receive
for ongoing access. The automated email is
initiated through participant enrolment at the
training course. Access via a more permanent
username and password will normally be granted
to those who have demonstrated responsible
competency during the training course.
BFDC
6
user manual
making BETTER FERTILISER DECISIONS FOR CROPPING systems IN AUSTRALIA
What is a calibration relationship?
The BFDC Database contains data for more
than 5000 soil test–crop response relationships
carried out from the early 1960s to recent times.
Relative yield (RY) is defined as
(Y0/Ymax) × 100, where Y0 is the
crop yield with no nutrient applied
and Ymax is the maximum yield
achieved in the trial after applying
a specified nutrient.
The BFDC Interrogator (see Figure 1) is designed
to create calibration relationships between a
specific soil test (specified for depth of sampling
and reporting units) and crop responses to an
applied nutrient. The crop response to rates of
applied nutrient is measured as the percentage
relative yield (RY %).
Yield increase can also be shown for a selection
of trials. Yield increase to applied nutrient,
defined as Ymax – Y0, is plotted against soil
test values. This BFDC Interrogator option is
typically more variable than plots presented
using RY %, because growing season rainfall has
large and variable effects on grain yield. A critical
calibration relationship cannot be determined for
yield increase using the BFDC Interrogator.
Figure 1. The BFDC Interrogator window
BFDC
7
user manual
making BETTER FERTILISER DECISIONS FOR CROPPING systems IN AUSTRALIA
Standardisation of soil test data
For several soil tests, data held in the
BFDC Database has been converted to valid
equivalents to ensure the BFDC Interrogator has
the capacity to generate additional calibration
relationships or include a greater number of trials
in a specific calibration plot. These conversions
are defined in Appendices 1 to 5.
Interrogation procedure
After logging in go to the top of the page and
select ‘annual trials’. This will take you to the
main trial page with a map displaying all trial
locations.
Remember, the more criteria you
set, the smaller the trial set derived
from the first query.
Initial selection
The soil test–crop response page enables you to
make an initial selection of trials using the search
criteria available (see Figure 2, page 9). The
initial criteria you specify can include any one
of the following:
You can group soil types and crop types by
selecting multiple options in the drop-down
menu (hold the Shift or Control key down to
select the options you are seeking).
l
Crop type or types (for example, wheat and/or
barley, canola and/or rape)
l
Nutrient (nitrogen, phosphorus, potassium or
sulphur)
l
Season (winter or summer crops)
l
Farming system (dryland or irrigated)
l
Soil type or types (Australian Soil Classification)
l
Year or range of years
l
Geographic region.
BFDC
8
user manual
making BETTER FERTILISER DECISIONS FOR CROPPING systems IN AUSTRALIA
Navigating the map
Defining a geographic region
To navigate the map, draw a ‘zoom box’ over the
geographic area of interest (hold the left mouse
button down and drag the cursor across the
map). Other navigation tools are available by first
choosing from the various options listed in the
‘Map tools’ drop-down menu located below the
map of Australia.
Using the ‘Draw polygon’ tool, you can also
select trials within a user-specified region.
To draw the polygon, make sure the ‘Draw
polygon’ option in the ‘Map tools’ menu is
selected. Click on the map at positions that
enclose your area of interest (you will probably
want to zoom in first). The first ‘click’ creates
a point for the polygon and successive ‘clicks’
draw additional points and connecting lines.
Do not allow polygon lines to cross over each
other. To complete the polygon, simply click on
the text ‘complete’ at bottom of map toolbar
(see Figure 2). This will link the first point to the
last point.
To clear the polygon at any stage, click ‘clear’.
To go back one step, click ‘undo’.
Figure 2. Soil test-crop response trials window
BFDC
9
user manual
making BETTER FERTILISER DECISIONS FOR CROPPING systems IN AUSTRALIA
Starting the Interrogation process
To run any selected query, click on the link
(see Figure 2, page 9): ‘trials that satisfy the
selection criteria above’ (in red type on lefthand side of screen). A new Interrogation form
will appear indicating the number of trials that
satisfy the initial query parameters and the trial
positions will be plotted on the map as coloured
dots (initially colour-coded for ASC soil types —
assuming your data set has them) (see Figure 3).
Figure 3. Soil test — crop response calibrations window
BFDC
10
user manual
making BETTER FERTiLiSER DECiSiOnS FOR CROPPing SySTEmS in aUSTRaLia
The polygon that defines the geographic area can be drawn in the soil test–crop
response trials window before starting the interrogation process or in the soil test–crop
response calibrations window:
a) In the soil test–crop response trials window, choose the trials by clicking the link ‘trials that
satisfy the selection criteria above’. This will include only those trials that satisfy the nonspatial criteria and are found to fall within the polygon.
b) In the soil test–crop response calibrations window, the initial selection is based on the nonspatial criteria only. This allows the user to make a geographic sub-selection of the initial trial
set. To do this, draw the polygon as earlier described and click ‘refresh’ (see Figure 4).
Figure 4. using the polygon tool in the soil test-crop response
calibrations window
BFDC
11
USER manUaL
making BETTER FERTILISER DECISIONS FOR CROPPING systems IN AUSTRALIA
Obtaining a summary of trial data
To list summary descriptive and statistical
information about each trial in the initial
selection, click ‘list selection summary
information’ (see Figure 5).
Figure 5. Listed information for soil test-crop response data statistics
BFDC
12
user manual
making BETTER FERTILISER DECISIONS FOR CROPPING systems IN AUSTRALIA
Viewing an individual trial
To obtain detailed information about a particular
trial, click the ‘trial number’ in the summary table
(see Figure 6).
Figure 6. Trial report
BFDC
13
user manual
making BETTER FERTILISER DECISIONS FOR CROPPING systems IN AUSTRALIA
Mapping trials
Clicking any one of the three ‘map’ links allows
you to plot other colour-coded information
about the trials on the map. These include
% RY, Ymax and ASC (see Figure 7). To see what
the colour codes mean for each parameter,
click ‘Legend’ below the map.
Figure 7. Mapped Australian Soil Classification for each of the
selected trials
BFDC
14
user manual
making BETTER FERTILISER DECISIONS FOR CROPPING systems IN AUSTRALIA
Developing a calibration relationship
Refine a calibration relationship by selecting
filter options in the drop-down menus under the
section of the page entitled ‘Refine your trial
selection for determining a data relationship’
(see Figure 8).
To develop a calibration relationship for trials
that fit your initial selection criteria, first select
the soil test of interest and sampling depth.
When developing a calibration relationship:
a) Always start with a large data set (for
example, Colwell P at 0–10 cm) and
study the calibration relationship before
applying any filters.
b) Not all trials include data for all soil test
methods, nor do all trials have soil test
data for the different depths indicated in
the drop-down menu.
c) A calibration curve cannot be fitted to
yield increase data.
(Continued page 16) ....... u
Figure 8. Filter options available from the soil test–crop response
calibrations window
BFDC
15
user manual
making BETTER FERTILISER DECISIONS FOR CROPPING systems IN AUSTRALIA
u (Continued from page 15)
Note: If a trial report does not include
data in a given filter, the trial will
automatically be excluded from a
calibration plot.
Refinement criteria act as data filters and
include:
l
Maximum soil test value (limits maximum soil
test value in plot).
Note: One very high soil test will cause other
data points in the calibration plot to be
compressed towards the Y axis.
When satisfied with the chosen options, click
one of the two ‘plot graph’ options:
l
Growing season rainfall (mm) (limits plot to
a)Plot calibration by crop
a user-specified range).
b)Plot calibration by soil type.
l
Ymax (t/ha) attained (limits plot to a
user-specified range).
The calibration relationship (soil test value
against % RY) will be displayed either for the
selected crop type(s) or soil type(s).
l
Soil pH (limits plot to a user-specified
pH range).
l
Soil organic carbon (limits plot to a user-
specified organic carbon range for the topsoil).
l
Topsoil texture (limits plot to a specific soil
texture).
l
Tillage system (limits plot to a specific tillage
system).
l
Stubble management (limits plot to a specific
stubble management system).
l
Phosphorus Buffering Index (PBI) (plots to a
specific PBI range).
l
Previous year’s land use (limits plot to a specific
land use).
l
Trial stress factor rating (excludes data from
stressed trials).
Use of these filters is optional. Applying one or
more of them will typically exclude trials from a
calibration plot.
BFDC
16
user manual
making BETTER FERTILISER DECISIONS FOR CROPPING systems IN AUSTRALIA
Deriving soil test criteria
A calibration relationship will be plotted by crop
or by soil type where the data rules are met. The
calibration relationship will show the soil test
critical values and ranges at 80, 90 and 95% RY.
These will be displayed on the screen with the
calibration relationship (see Figure 9).
(Continued page 18) ....... u
Figure 9. Soil test–crop response calibration relationship determined
from 189 South Australian nitrogen treatment series for barley
BFDC
17
user manual
making BETTER FERTILISER DECISIONS FOR CROPPING systems IN AUSTRALIA
u (Continued from page 17)
Critical level — the point above which for the level of significance applied, RY is likely to be at
least (or larger than) the nominated value.
Confidence range — based on the level of significance applied to the soil test–crop response
curve, it represents the range of soil test values for which RY is likely to be at the nominated
value. If the confidence range of two different calibrations are discrete (they do not intersect)
the critical levels are different. For two calibrations where the confidence ranges overlap to a
small degree, the critical levels still may be significantly different, but as the degree of overlap
increases so too does the probability of the critical levels being the same.
Correlation co-efficient (R-value) — the correlation co-efficient is the measure of how well the
calibration line fits the observations.
Range of soil test values — provides information about the lower and upper soil test values for
the experiments included in the calibration.
Slope RY (50–80) — the value and range for this parameter is the slope (rate of change)
of the calibration line between 50% and 80% RY as soil test value increases. A high value for
this parameter suggests that increases in yield are large for increments of soil test value. This
parameter provides information from which inferences about risk and economic gain from
nutrient addition can be made. Generally this parameter is of most use in comparisons
between calibrations sets.
Importantly, a calibration relationship cannot be obtained if one of the following rules is not
applicable:
a)A calibration relationship must have more than eight trials to be statistically valid.
b) A calibration relationship must have an R-value greater than 0.15.
c) A calibration relationship must have at least three trials in the 85–95% RY region of the curve.
Fewer trials suggest a ‘dumbbell’ data distribution with a lack of data in the area of the most
used critical levels.
d) The 95% confidence range must be less than half the estimate of the 95% RY.
You can create a permanent record of your
calibration relationship and soil test criteria by
printing the graph (click ‘print’ below the graph).
Selecting this option will present the graph in a
format that can be saved or printed from your
internet browser.
BFDC
18
user manual
making BETTER FERTiLiSER DECiSiOnS FOR CROPPing SySTEmS in aUSTRaLia
Deriving a new calibration plot
To develop a calibration plot using another set
of trials or using different criteria (for example,
different soil types or different soil tests, etc) first
close the calibration window by clicking the ‘U’
at top of graph window.
DO NOT select the toolbar ‘back’
button — this will take you back to
the home page.
Then select the ‘<<back’ option on the left-hand
side of the page. Start deriving a new calibration
plot by selecting another set of trials (for
example, other crop type(s) and/or soil type(s)
you wish to examine). Repeat the process as
described above.
✗
Notes
BFDC
19
USER manUaL
✓
making BETTER FERTILISER DECISIONS FOR CROPPING systems IN AUSTRALIA
Examining data in the calibration
relationship
Impact of subsoil nutrient status
This filter is useful where trials have soil test
data for multiple sampling depths (for example,
0–10 cm, 10–20 cm, etc) and it is specific to
potassium and sulphur nutrient trials (see
Figure 10). For example, crops growing on soil
with adequate levels of potassium or sulphur in
the subsoil may not respond to potassium or
sulphur fertiliser applications, even though the
surface soil layer itself may be nutrient deficient.
You may explore this effect using the input boxes
under the heading ‘Subsoil nutrient effect’.
By experimenting with different subsoil nutrient
levels, you can discover the subsoil test value
above which there is little point in applying
nutrient.
To do this, choose a surface soil sample depth
and a suitable soil test (for example, Colwell K)
as usual in the boxes under ‘Choose soil test
and sample depth’.
(Continued page 21) ....... u
Figure 10. Filter option using subsoil nutrient status
BFDC
20 user manual
making BETTER FERTILISER DECISIONS FOR CROPPING systems IN AUSTRALIA
u (Continued from page 20)
Under ‘Subsoil nutrient effect’, choose a subsoil
sample depth and enter a value for this soil test
that you think should be an adequate nutrient
level for this depth. Then ‘click’ the ‘plot by
subsoil nutrient level’ link to show which surface
samples have corresponding adequate or
inadequate subsoil nutrient levels. The plot will
display subsoil status in different colours (see
Figure 11).
A calibration relationship cannot
be developed using the ‘Subsoil
nutrient effect’ filter.
Figure 11. Data displayed using the ‘Subsoil nutrient effect’ filter
BFDC
21
user manual
making BETTER FERTiLiSER DECiSiOnS FOR CROPPing SySTEmS in aUSTRaLia
Outliers
you may observe some trial outliers in the
relationship generated. These are one or more
data points in the calibration relationship that
appear to be somewhat abnormal (displaced)
when compared with the main body of data
points.
The trial report will be displayed and includes all
data and meta data that has been entered for
the particular trial, including the statistically fitted
treatment series graph for crop yield against
nutrient rate applied. The trial report will also
display the individual mean treatment crop yields.
you can investigate outliers by clicking on the
data point in the calibration relationship or other
presentation of the data (see Figure 12).
For trials where data for grain protein, grain
nutrient or oil concentrations are entered, these
parameters will also be displayed in the trial report.
Figure 12. Displaying trial report for an outlier
51505
By investigating an outlier, you may find:
l The fitted statistical relationship for crop yield and rate of nutrient applied does not seem
correct and a different statistical fit for estimating Y0 and Ymax may be more appropriate.
l A crop stress factor (for example, drought, disease or weeds, etc) may have limited yield
response to applied nutrient.
l The soil type for the outlier may be atypical.
There is no provision for arbitrarily removing outliers from the plot. If you are convinced any
of the trial data should be excluded from the BFDC Database or that some data may require
reviewing, then contact us at www.bfdc.com.au
BFDC
22
USER manUaL
making BETTER FERTILISER DECISIONS FOR CROPPING systems IN AUSTRALIA
Longer-term trials
Limited data for long-term trials has been
entered into the BFDC Database. All longterm trial data entered is used in soil test–crop
response calibrations only where each individual
year can be treated as a single experiment.
Notes
BFDC
23
user manual
making BETTER FERTILISER DECISIONS FOR CROPPING systems IN AUSTRALIA
Appendix 1
Standardisation of soil test values
The following soil test standardisations have been incorporated into the BFDC Database
for access by the BFDC Interrogator, without compromising the original data.
Converting soil test data sampled to 0–7.5 cm
into 0–10 cm depth by dividing the 0–7.5 cm
values by 1.14 (Coad et al. 2010; K Peverill (pers.
comm.). Thus, calibration plots can then be
developed for 0–7.5 cm, 0–10 cm (unadjusted)
and for 0–10 cm (adjusted).
All historical phosphorus sorption tests have
been converted to the modern phosphorus
buffering index (PBI) — (Burkitt et al. 2002) —
see Appendix 3. PBI categories (from extremely
low to very high) have also been defined as
filters for calibration plots — see Appendix 4.
Converting soil test data from consecutive
depths (for example, 0–7.5 cm and 7.5–15 cm)
where both soil test and soil bulk density have
been recorded for each depth. These provide
data for soil tests (nutrient concentration and
content) to a converted depth of 15 cm.
Soil carbon:nitrogen (C:N) ratios have been
derived, using organic carbon (%) and total soil
nitrogen (%) soil test values.
Estimates of total soil mineral nitrogen
available for crop growth (mineral nitrogen
at sowing plus nitrogen mineralised during
crop growth from organic matter). The BFDC
Database contains some estimates for ‘in-crop
mineralisation’, either measured in situ or via
various laboratory incubation tests. For these
trials, calibration plots for total soil mineral
nitrogen available for crop growth can be
compared to mineral nitrogen reserves measured
at sowing. However, in-crop mineralisation
estimates are integral parameters of fertiliser
nitrogen decision support systems (for example,
Payne and Ladd 1993).
Soil test units for soil cations have been
converted to mg/kg from cmol(+)/kg and
meq/100 g. The latter two units are equivalent.
Exchangeable or extractable potassium (K)
(mg/kg) = cmol(+)/kg × 391
Exchangeable potassium (mg/kg) soil tests
have been converted to extractable Colwell
K (mg/kg) excluding vertosols with 2:1 clay
lattices — see Appendix 5.
Soil pH tests in the National Database have
been converted to pH CaCl2 (1:5 soil:solution
ratio) — see Appendix 2 for pH interpretations.
Users can specify pH ranges they want
to examine as an additional filter for say,
interpreting a phosphorus (P) calibration plot.
BFDC
24
user manual
making BETTER FERTILISER DECISIONS FOR CROPPING systems IN AUSTRALIA
Appendix 2
Soil pHCaCl2 diagnostic
Soil pH CaCl2 ranges
<4
Diagnostic interpretation
Highly acidic
4–4.5
Acidic (possibly aluminium [Al] and manganese [Mn]
toxicity and molybdenum [Mo] deficiency)
4.5–5
Acceptable for acid-tolerant species
5–6.5
Optimal pH for plant growth
6.5–7.5
>7.6
Neutral to slightly alkaline. Often high in magnesium
[Mg] and calcium carbonate (CaCO3).
Alkaline and includes sodic and salty soils
(see Table 7.2 from Slattery et al. 1999)
BFDC
25
user manual
making BETTER FERTILISER DECISIONS FOR CROPPING systems IN AUSTRALIA
Appendix 3
Relationships between PBI and PRI
and PBC sorption tests
State
No. soils
Regression
100R2
WA*
133
PBI = -0.013 (PRI)2 + 2.64 (PRI) + 15.1
93
Aust.**
290
PBI = 11.63 PBC (Ozanne and Shaw)
98
Aust.***
290
PBI = 10.78 PBC (Ozanne and Shaw) +12
97
Source: * Bolland and Windsor (2007); **PBI adjusted for Colwell P (Burkitt et al. 2002);
*** PBI unadjusted for Colwell P (Burkitt pers. comm.)
BFDC
26
user manual
making BETTER FERTILISER DECISIONS FOR CROPPING systems IN AUSTRALIA
Appendix 4
Classification of PBI status
Phosphorus
sorption status
PBI
PBC
(O and S)
PRI
Extremely low
<15
Very very low
15–35
<10
1–2
Very low
36–70
10–50
2–20
Low
71–140
50–100
20–50
Moderate
141–280
100–200
50–100
High
281–840
200–300
100–150
Very high
>840
>300
>150
<1
BFDC
27
user manual
making BETTER FERTILISER DECISIONS FOR CROPPING systems IN AUSTRALIA
Appendix 5
Conversion of exchangeable potassium (mg/kg)
to Colwell K (mg/kg)
A large body of data from the National Soil
Fertility Project carried out on cropping soils in
Western Australia, South Australian, Victoria and
New South Wales (Colwell 1979) were used to
correlate and compare exchangeable potassium
(Tucker 1974) and Colwell K (Colwell and Esdaile
1968) values.
The relationship was curvilinear for some low
potassium soils from WA and slightly curvilinear
at higher soil potassium levels.
A conversion ratio of 1:1 has been incorporated
into the BFDC Database for all analysed soils,
except the 2:1 clay lattice soils.
Overall, the comparisons showed strong linear
correlations, supporting a conversion ratio of 1:1.
No comparative data was available for the Skene
K test used mainly in Victoria.
BFDC
28
user manual
making BETTER FERTILISER DECISIONS FOR CROPPING systems IN AUSTRALIA
Appendix 6
Approximate relationship between Australian Soil
Classification and Great Soil Groups
Australian Soil Classification (ASC)
Great Soil Groups
Northcote
Factual Key
Calcarosols: soils that are usually calcareous
throughout the soil profile (often highly
calcareous).
Solonised brown soils, grey-brown and
red calcareous soils, mallee soils, highly
calcareous sands, lithosols, rendzina
Gc1, Gc2, Um1,
Um5 soils
Chromosols: soils with a strong texture contrast
between the topsoil and subsoil. Subsoils are
not strongly acid and are not sodic.
Non-calcic brown soils, some red-brown
earths red and brown podzolic soils, red
and brown duplex soils
Many forms of
duplex (D) soils
Dermosols: soils with structured subsoils that
lack a strong texture contrast between the
topsoil and subsoil.
Red gradational soils, prairie soils,
chocolate soils, some brown, red and
yellow podsolic soils, kraznozem, rendzina,
chenozem, terra rossa
Wide range of
Gn3 soils, some
Um4 soils
Ferrosols: soils with a subsoil that contains a
high content or free iron oxide and which lack a
strong texture contrast between the topsoil
and subsoil.
Krasnozems, euchrozems, chocolate soils
Gn3, Gn4, Uf5,
Uf6 soils
Kandosols: soils that lack a strong texture
contrast between the topsoil and subsoil, having
at best a weakly-structured subsoil and not
calcareous throughout.
Red, yellow and grey earths, calcareous
red earths, earthy sands, brown podsolic
soils or lithosols
Gn2, Um5 soils
Kurosols: soils with a strong texture contrast
between the topsoil and strongly acid subsoil.
These soils can have high levels of magnesium,
sodium and aluminium in the subsoil.
Many podsolic soils and soloths
Many strongly
acid duplex
soils
Organosols: soils dominated by organic
material.
Neutral to alkaline soils, and acid peats
Organic soils
Podosols: soils with a subsoil dominated by the
accumulation of compounds of organic matter,
aluminium and/or iron.
Podsols, humus podsols, and peaty
podsols, lateritic podsols
Many Uc2,
some Uc3, Uc4
soils
Rudosols: includes soils with little pedological
organisation. These soils are usually ‘young’ in
the sense that soil-forming factors have little
time to pedologically modify parent rocks or
sediments. The component soils can vary widely
in texture and depth; many are stratified and
some are highly saline.
Lithosols, alluvial soils, calcareous and
siliceous sands, some solonchaks, deep
gravelly soils
Uc1, Um1, Uf1
soils
Sodosols: soils with strong texture contrast
between topsoil and subsoil horizons. These
soils are not strongly acid but are sodic and
have an ESP greater than 6.
Solodized solenetz and solodic soils, some
soloths and red-brown earths
Many duplex
soils
Tenosols: soils with generally weak pedological
organisation in the subsoil.
Lithosols (shallow stony soil), siliceous and
earthy sands, alpine humus soils and some
alluvial soils, some terra rossa, brown earths
Many Uc and
Um classes
Vertosols: clay soils with shrink–swell properties
that exhibit strong cracking when dry. Some of
these soils also show gilgai microrelief.
Black earths, black, grey, brown and red
(cracking) clays
Ug5 soils
Source: Adapted from Isbell 1996, Peverill et al. 1999 and Hall et al. 2009.
BFDC
29
user manual
making BETTER FERTILISER DECISIONS FOR CROPPING systems IN AUSTRALIA
References
Bolland, MDA & Windsor, DP 2007 ‘Converting
reactive iron, aluminium and phosphorus index
(PRI) to the phosphorus buffering index (PBI)
for sandy soils of south-western Australia’,
Australian Journal of Soil Research 45: 262–265.
Coad, JR, Burkitt, LL & Gourley, CJP 2010
‘Influence of sampling depth on extractable
nutrient concentrations, pH, phosphorus
buffering index of pasture soils in south-eastern
Australia’, Australian Journal of Soil Research 48:
355–360.
Colwell, JD 1979, National Soil Fertility Project,
Volume 1, CSIRO, Australia.
Colwell, JD & Esdaile, RJ 1968, ‘The calibration,
interpretation, and evaluation of tests for the
phosphorus fertiliser requirements of wheat in
northern New South Wales’, Australian Journal
of Soil Research 6: 105–120.
BFDC
Moody, PW & Bolland, MDA 1999 ‘Phosphorus’,
in Soil Analysis — an Interpretation Manual:
187–220, CSIRO Publishing.
Payne, RA & Ladd JN 1993, ‘Soil organic matter
and nitrogen management in dryland cropping
systems. 2. Nitrogen requirements for dry land
cereal crops’, Primary Industries SA Technical
Report 212.
Slattery, WJ, Conyers, MK & Aitken, RL 1999,
‘Soil pH, aluminium, manganese and lime
requirement’, in: Soil Analysis — an Interpretation
Manual, 103–128, CSIRO Publishing.
Tucker, BM 1974, ‘Laboratory procedures for
cation exchange measurements on soils‘, Division
of Soils Technical Paper 23, CSIRO, Australia.
30 user manual
making BETTER FERTILISER DECISIONS FOR CROPPING systems IN AUSTRALIA
Notes
BFDC
31
user manual
For more information
NSW Department of Primary Industries
161 Kite Street, Orange NSW 2800
Locked Bag 21, Orange NSW 2800
T + 61 2 6391 3100
F +61 2 6391 3336
w www.bfdc.com.au
Department of
Agriculture and Food
EH GRAHAM
CENTRE
for Agricultural Innovation
TASMANIAN
INSTITUTE OF
AGRICULTURE
REUTER AND ASSOCIATES


![[LCD-XN ZF]BN68-03717E](http://vs1.manualzilla.com/store/data/006789174_1-e4a37780c8bcc95cae35d40d224ae2f1-150x150.png)