1
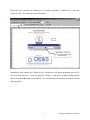
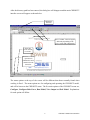
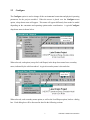
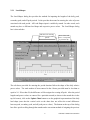
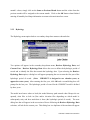
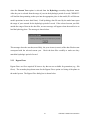
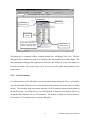
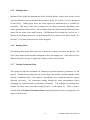
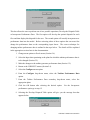
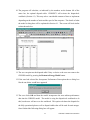
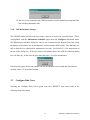
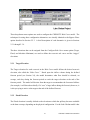
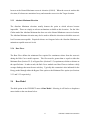
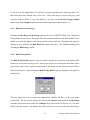
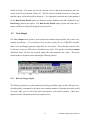
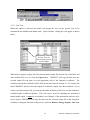
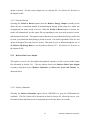
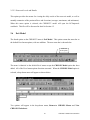
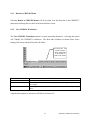
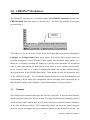
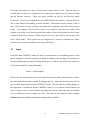
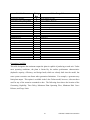
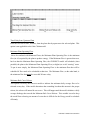
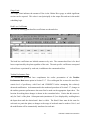
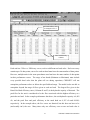
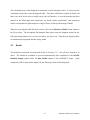
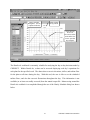
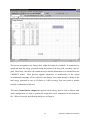
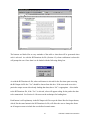
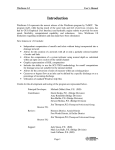
CHEOPS™ Model
Documentation
Lake Chelan Project
Reservoir Operations and Energy
Simulation Model
September, 1998
Developed by:
© Copyright 1998 Duke Engineering & Services
1.0 Introduction
1.1
Purpose
DE&S created the CHEOPS™ hydropower system simulation model as an accurate and easy-touse tool for evaluating a wide range of physical changes (e.g.; turbine upgrades) and operational
constraints (e.g.; minimum flows) associated with relicensing or upgrading single and multiple
development hydro systems.
One strength of the CHEOPS™ model is the degree of
customization each version contains. The model is tailored to meet the demands of the particular
system being modeled. The unique CHEOPS™ program architecture provides a platform for
investigating each project specific feature under scrutiny.
Most CHEOPS™ configurations, including the Lake Chelan model, are essentially a
combination of two models; the Rule Curve model, and the Energy model. The Rule Curve
model examines the seasonal reservoir operation that minimizes spill and maximizes head for the
system. The Energy model uses the Rule Curve output and maximizes the value of the energy
generated (usually prioritizing peak energy, then total energy) on a daily basis.
1.2
Model Architecture
The CHEOPS™ system utilizes a combination of Visual Basic subroutines in a Microsoft Excel
environment. Individual subroutines, linked to Excel worksheets, drive the model elements
including: water budgeting to meet operational constraints, water shifting from off-peak to peak
periods to maximize generation value, and determining unit dispatch solutions.
For each
application, we assemble the model from a library of standard modules based on the unique
physical and operational characteristics of the river system or powerplant under consideration.
The model is assembled with hydrology, storage capacity, operating constraints, and equipment
characteristic data specific to the system. The project configuration for each simulation is
accomplished through a series of menus and drop-down dialog boxes in Microsoft Excel. These
menus and options will be discussed in detail in Section 2.0.
2
CHEOPS™ Model Documentation
1.3
System Requirements and Run Time
Computer requirements and the subsequent run times will vary according to the complexity of
the model associated with the number of plants in the system. DE&S recommends a minimum
Pentium 166 MHz processor with 32 MB of RAM.
1.4
CHEOPS™ User-Manual
The screenshots displayed throughout this document were taken using both Excel 7.0 and
Excel97 for Windows 95. The arrows and captioned text are for descriptive purposes only; they
will not appear while running the model.
A moderate level of Excel experience has been assumed in this manual; however, those users
experienced in Excel will find much of this document to be simplistic. The features and
techniques involved with using CHEOPS™ are described well enough that relatively
inexperienced Excel users will still be able to use the basic model, while more experienced users
will gain some insight into the more advanced model features.
3
CHEOPS™ Model Documentation
2.0 Model Operation
As was mentioned in Section 1.1, the CHEOPS™ model is composed of two models which
interact on a limited basis. Much of the project physical data and operations constraints are used
by both models, but some of the input data is not shared. The following sections will describe
the methods for configuring and running the models.
It must be kept in mind that the
CHEOPS™ model, as a whole, is used to analyze the entire river system, but each model piece
(Rule Curve model and Energy model) does not necessarily examine each plant in the system.
The Rule Curve model is limited in its analysis to those plants with seasonal storage reservoirs.
The Energy model examines only those plants with generation capabilities.
2.1
Setup
The CHEOPS™ model is composed of many files. All files must be kept in the same directory.
The files can be categorized as either standard CHEOPS™ files, resident in all versions of
CHEOPS™, or project specific files. Listings of each category of files and a brief description of
their function follows:
Files - Standard
Name
Type
Function
Cheops.xls
Excel Workbook
Dispatch.xls
Output.xls
Details.xls
RCOutput.xls
RCDurations.xls
RCTempOutput1.dat
1991_out.dat *
Excel Workbook
Excel Workbook
Excel Workbook
Excel Workbook
Excel Workbook
Tab delimited text file
Tab delimited text file
Model Interface - Contains configuration and operational
menus linked to macros that drive the model.
Creates turbine dispatch and output tables.
Summarizes model output by plant, month, and year.
Summarizes and charts the detailed output for specified week.
Summarizes and charts rule curve output.
Used to display flow and head duration curves.
Reservoir Rule Curve output for Plant 1.
Raw model output. The file name will contain the year of the
hydrology data.
Files - Project Specific
Name
Inflow1.dat
Type
Function
Tab delimited text file
Daily average inflow data for Plant 1 Used as natural inflow input
for Rule Curve model or as accretion flows in Energy model
depending on the reservoir.
The function of each sheet will be explained in more detail later in this document.
4
CHEOPS™ Model Documentation
Microsoft Excel provides the platform for all model operations.
Within Excel, open the
Cheops.xls file. The following screen will appear.
Dialog Box - enter the
directory path containing
the model files.
Immediately after opening the Cheops.xls file, a dialog box will appear prompting the user for
the model path directory. Enter the path (for example, c:\bin\projects\Chelan Cheops\model)
and click on the OK button or hit ENTER. This will show the model where to look for all data
and output files.
5
CHEOPS™ Model Documentation
After the directory path has been entered, the dialog box will disappear and the main CHEOPS™
interface screen will appear as shown below.
CHEOPS™
menu bar
Excel 7 toolbar. This will appear
differently depending on the
user’s version and configuration.
Sheet tabs.
Click on them
to activate.
Status bar. Various
operations in
CHEOPS™ can be
monitored on the
Status bar.
The menu options at the top of the screen will be different than those normally found when
working in Excel. The menu options are for configuring and operating the CHEOPS™ model,
and will be known as the CHEOPS™ menu. The five main options of the CHEOPS™ menu are;
Configure, Configure Rule Curve, Run Model, View Output and Exit Model. Explanations
for each option will follow.
6
CHEOPS™ Model Documentation
2.2
Configure
The Configure option is used to change all the environmental constraints and physical operating
parameters for the projects modeled. When the mouse is placed over the Configure menu
option, a drop-down menu will appear. This menu will appear differently from model to model
depending on the constraints and operating options under consideration. A typical Configure
drop-down menu is shown below.
Arrowhead indicates
a secondary dropdown menu.
When selected, each option (except for Load Shapes) in the drop-down menu has a secondary
menu, indicated by the solid arrowhead. A typical secondary menu is shown below.
Secondary dropdown menu.
When selected, each secondary menu option, as well as the Load Shapes option, leads to a dialog
box. Each dialog box will be discussed in detail in the following sections.
7
CHEOPS™ Model Documentation
2.2.1 Load Shapes
The Load Shapes dialog box provides the method for inputting the lengths of the daily peak,
secondary peak, and off-peak periods. It also provides the means for entering the value of power
associated with each period. All Load Shapes input is variable by month. In other words, each
month may have a different load shape and respective power values. The Load Shapes dialog
box is shown below.
Edit boxes for entering
duration of corresponding
period.
Power Value edit
boxes. Correspond
to period of day.
The edit boxes provided for entering the period duration follow the shape of the daily relative
power values. The total number of hours entered in the 6 boxes provided must be less than or
equal to 24. If less than 24, the difference will be assigned to evening off-peak. After the period
lengths and power values are entered for a particular month (as shown in the month box in the
top left corner), click on the Update Chart button to see the graphical representation of the daily
load shape (note that the vertical scale on the chart does not reflect the actual differences
between peak, secondary peak, and off-peak power values). The buttons at the top of the dialog
box allow quick scrolling through the months and a convenient method of assigning the previous
8
CHEOPS™ Model Documentation
month’s values; simply click on the Same as Previous Month button and the values from the
previous month will be assigned to the current month. Click on the OK button when finished
entering all monthly load shape information to return to the main interface screen.
2.2.2
Hydrology
The Hydrology menu option leads to a secondary drop-down menu as shown below.
Two options will appear in the secondary drop-down menu; Retrieve Hydrology Data, and
Current Year. Retrieve Hydrology Data allows the user to define the hydrologic period of
record and to identify the files that contain the hydrology data. Upon selecting the Retrieve
Hydrology Data option, a dialog box will appear prompting the user to enter the first year of the
hydrologic period of record. (Note: CHEOPS™ is designed to use calendar years, as
opposed to water years) After entering the first year, click OK and a second dialog box will
prompt for the last year. The hydrologic period of record for the CHEOPS™ model is defined
by these years.
The model now knows where to look (the model directory path entered when Cheops.xls was
opened), what files to look in (flow and/or elevation files depending on which model is
subsequently run), and how much data is there (the hydrologic period of record). The next
dialog box that will appear in the succession of boxes following the Retrieve Hydrology Data
selection, will ask for the current year. This dialog box is a duplicate of the one that will appear
9
CHEOPS™ Model Documentation
when the Current Year option is selected from the Hydrology secondary drop-down menu.
After the year is selected from the range of years in the hydrologic period of record, CHEOPS™
will load the data pertaining to that year into the appropriate place in the model (We will discuss
model operations in more detail later). Each hydrology data file used by the model must span
the range of years entered for the hydrologic period of record. If the selected current year falls
outside the range of data in the data files, an error message will appear when the model tries to
load the hydrology data. The message is shown below.
This message alerts the user that, most likely, the years in one (or more) of the data files does not
correspond with the selected current year. Check the data files carefully to make sure they
match the hydrologic period of record.
2.2.3
Bypass Flows
Bypass flows are flows required 24 hours a day that are not available for generation (e.g.; fish
flows). The secondary drop-down menu for the Bypass Flows option is a listing of the plants in
the model system. The Bypass Flow dialog box is shown below.
10
CHEOPS™ Model Documentation
OK button
Plant being
assigned flows
Day column
edit box
Arrow indicate drop-down
edit box. Use this to limit
entry to valid input range.
Bypass Flow
column edit box
The dialog box is composed of three columns; Month, Day, and Bypass Flow (cfs). The Day
and Bypass Flow columns are made up of edit boxes that correspond to the month column. The
only limitation on changing the bypass flows allowed by the dialog box is only one change can
be made per month. The bypass flows can be set for each of the plants being modeled in the
same manner.
2.2.4
Level Fluctuations
Level Fluctuations are the allowable reservoir elevation change during the day, or, put another
way, the allowable difference between the maximum and minimum elevations achieved during
the day. The secondary drop-down menu under the Level Fluctuations options lists the plants in
the model system. The dialog box for Level Fluctuations is identical to the Bypass Flows box
except the third column is for Level Fluctuations. The manner in which it is used is identical.
See Section 2.2.3 for instructions on using the dialog box.
11
CHEOPS™ Model Documentation
2.2.5
Minimum Flows
Minimum Flows define the instantaneous flows which the plant’s releases must always exceed
(note the difference between minimum flows and base flows; see Section 2.3.5 for a description
of base flows). Unlike bypass flows, the water required for minimum flows is available for
generation. This may or may not be enough flow for energy generation, depending on the
turbine performance characteristics. The secondary drop-down menu under the Minimum Flows
option lists the plants in the model system. The Minimum Flows dialog box, and its use, is
identical to the Bypass Flows box except minimum flows are entered in the third column. See
Section 2.2.3 for instructions on the use of the dialog box.
2.2.6
Ramping Rates
The Ramping Rate option allows the user to define the ramping rates below the project. The
Lake Chelan model is not currently configured to allow for ramping rates. If this option is to be
added in the future, the type of ramp rates (cfs/hour or ft/hr) must be known.
2.2.7
Turbine Performance Data
This option provides the mechanism for changing the turbine-generator performance for the
projects. Through this procedure the user can investigate the benefits of turbine upgrades or the
benefits of additional units. This option is considerably more complicated than the options
discussed previously.
We recommend reading through the entire documentation before
attempting any turbine-generator performance evaluations. The technique for making these
changes will make more sense after reading Section 3.2 and Section 4.1. When a plant is
selected from the Turbine Performance Data secondary drop-down menu, a message box will
appear as shown below.
12
CHEOPS™ Model Documentation
This box allows the user to perform one of two possible operations, Develop the Dispatch Table
or Incorporate Performance Data. The first option will develop the optimal dispatch for each
flow and then display this dispatch for the user. The second option will actually incorporate new
performance data into the model. Before activating either of these options the user must first
change the performance data on the corresponding input sheets. The correct technique for
changing turbine performance data is outlined in the steps below. The details will be explained
in the appropriate sections later in the documentation.
1. Change menu options to Excel menus (Section 2.6).
2. Select the Input sheet pertaining to the plant for which the turbine performance data is
to be changed (Section 3.2).
3. Make the changes to the turbine-generator performance data (Section 3.2).
4. Return to the CHEOPS™ menus (Section 2.6).
5. Select the Configure menu option.
6. From the Configure drop-down menu, select the Turbine Performance Data
option.
7. From the Turbine Performance Data secondary drop-down menu, select the
appropriate plant.
8. Click the OK button after selecting the desired option.
For the Incorporate
performance option go to step 12.
9. Selecting the Develop Dispatch Table option will give you the message box that
appears below.
13
CHEOPS™ Model Documentation
10. The program will calculate, as indicated by the numbers on the bottom left of the
status bar, the optimal dispatch table. CHEOPS™ will activate the dispatch.xls
workbook (Section 4.1). This may take a considerable amount of time to implement
depending on the number of units and the speed of the computer. The details of what
the model is doing here will be explained in Section 4.1. The screen will look similar
to that shown below.
11. The user can print out the dispatch table if they so desire or the user can return to the
CHEOPS model by pressing the Return to Energy Model button.
12. If the user had selected the Incorporate Performance Data option then a dialog box
like the one below would have appeared.
13. The user clicks OK and then the model incorporates the new turbine performance
data into the CHEOPS model. The model is using the dispatch.xls workbook to do
this, but the user will never see the workbook. This option calculates the dispatch for
the fully operational plant as well as dispatch tables that will be used for unit outages.
Once finished the following dialog box will appear.
14
CHEOPS™ Model Documentation
14. The user is now returned to the CHEOPS interface but the model has incorporated the
new turbine performance data.
2.2.8
Unit Maintenance Outages
The CHEOPS model will allow the user to take a unit out of service for a specified time. This is
accomplished with the Maintenance Schedule option from the Configure drop-down menu.
The Maintenance Schedule dialog box, and its use, is identical to the Bypass Flows box except
the number of unit that is out for maintenance is entered in the third column. Note that only one
unit is allowed to be scheduled for maintenance at a time. See Section 2.2.3 for instructions on
the use of the dialog box. If the user enters a unit number that is not valid the following dialog
box will show up. In this case the user stated that Unit 3 is out for maintenance.
Note that like bypass flows, unit outages can only be changed once a month and if no units are
out then enter a “0” in the third column.
2.3
Configure Rule Curve
Selecting the Configure Rule Curve option from the CHEOPS™ main menu leads to the
following drop-down menu.
15
CHEOPS™ Model Documentation
These drop-down menu options are used to configure the CHEOPS™ Rule Curve model. The
techniques for using these configuration alternatives are virtually identical to the Bypass Flows
option described in Section 2.2.3. A brief description of each alternative is given in Sections
2.3.1 through 2.3.4.
The three elevations that can be assigned from the Configure Rule Curve menu option (Target,
Flood, and Absolute Minimum) are used to define the reservoir rule curve and the “trigger”
elevations.
2.3.1
Target Elevation
The Target elevation for each reservoir in the Rule Curve model defines the desired reservoir
elevation, also called the “Rule Curve.” Based upon the inflow volume during the defined
forecast period (see Section 2.6), the model determines what flow should be released, on
average, each day during the forecast period to reach the target elevation at the end of the
forecast period. The model will deviate from the target to accommodate the forecasted inflows
(for example, it will drawdown briefly if it “sees” a large inflow during the forecast); however, it
is always trying to arrive at the target at the end of the defined forecast.
2.3.2
Flood Elevation
The Flood elevation is usually defined as the elevation at which the spillway becomes available
or the dam overtops, depending on the physical configuration. For the Lake Chelan model it has
16
CHEOPS™ Model Documentation
been set at the Normal Maximum reservoir elevation (1100 ft). When the reservoir reaches this
elevation, all releases are maximized to try and return the reservoir to the Target elevation.
2.3.3
Absolute Minimum Elevation
The Absolute Minimum elevation usually denotes the point at which releases become
impossible. There are simply no release mechanisms available at this elevation. For the Lake
Chelan model the Absolute Minimum has been set at the Normal Minimum reservoir elevation.
The Absolute Minimum elevation may also be used to define the elevation at which the reservoir
level becomes unacceptable. Required releases are foregone below the Absolute Minimum to
maintain acceptable reservoir levels.
2.3.4
Base Flows
The Base Flow defines the minimum flow required for continuous release from the reservoir
during the Rule Curve model sequence. This flow must be greater than or equal to either the
Minimum flow (Section 2.2.5) or Bypass flow (Section 2.2.3) requirement, whichever dictates at
the specified time. In other words, the Rule Curve module uses Base Flows to indicate a daily
average discharge that must be met each day. Typically this constraint is also indicated for the
Energy model through either the Bypass Flow option or the Minimum Flow option (see Sections
2.2.3 and 2.2.5 respectively).
2.4
Run Model
The third option in the CHEOPS™ menu is Run Model. Selecting it will lead to a drop-down
menu similar to the one shown below.
17
CHEOPS™ Model Documentation
Four options will be available from this drop-down menu; Run Reservoir, Run Energy, Run
Reservoir & Energy, and Run Weekly Details. Each will be discussed below.
2.4.1
Run Reservoir
The Run Reservoir option executes the CHEOPS™ Rule Curve model. It uses the natural
inflow data for each reservoir with seasonal storage, as well as the user defined elevations
(Sections 2.3.1 - 2.3.3), to schedule daily releases from each reservoir. Releases are constrained
by the hydraulic capacity of each outlet at the reservoir.
The reservoirs analyzed by the Rule Curve model are examined in succession. Each reservoir’s
releases and resulting elevations are determined by the natural inflows, prescribed elevation
constraints, and physical outlet characteristics associated with that particular reservoir. In some
cases, scheduled releases from one reservoir are one component of inflows to another reservoir.
When the Run Reservoir option is selected the following dialog box will appear.
18
CHEOPS™ Model Documentation
The checkbox is asking if the user would like the model to “carry over” the end-of-year
elevations to the beginning of the next year. In other words, there are two different ways to run
the reservoir model. The first way to run the reservoir model is with no discontinuities in the
model calculated reservoir elevations. If the reservoir ends one year at a particular elevation,
then it will begin the next year at the same elevation. This option allows the user to examine the
effects each year has on the surrounding years. This is the preferred reservoir model execution
for evaluating rule curve alternatives, and the impacts each will have on spill and refill. The
second option for running the reservoir model is to start each year at the target elevation. This
option is used when each year is to be looked at individually. This is the suggested execution
method for all energy evaluations (except those using an entire period of record).
The CHEOPS™ Rule Curve model produces numerous output files. Each of the three types will
be discussed below. Subsequent sections (Section 2.5) will describe options that import these
output text files into convenient charts and tables.
RCTempOutput.dat
The RCTempOutput.dat files are used to store the daily flow and elevation data generated for
each plant.
19
CHEOPS™ Model Documentation
Year
Day of Year
Outflow
Inflow
Target elevation
Model calculated
elevation
Sections 4.4 and 4.5 will illustrate methods for viewing these results in graphical and tabular
format.
2.4.2 Run Energy
This option runs the CHEOPS™ model. It will calculate the energy that can be produced by
each plant, during the period considered, while meeting the physical and environmental
operating constraints for the system. It uses the output from the Rule Curve model to calculate
the project generation. Note: The Energy model will use whatever rule curve output is currently
in the model directory for its calculations (it uses the files Elevation1.dat, and Flow1.dat). When
the Run Energy option is selected a dialog box will appear as shown below.
20
CHEOPS™ Model Documentation
Edit boxes to define
the period of data to
be analyzed by the
model for this run.
Checkbox
“overrides” the
years selected in
the edit boxes.
Using the two edit boxes (Beginning year, and Ending year), the user is able to define the period
of hydrology data to be used by the model during this run. We recommend using the drop-down
edit boxes (indicated by the arrows) to avoid any hydrology data errors. Both the beginning year
and ending year will be included in the run. To run a single year, enter the same year for both
beginning and ending. The checkbox at the bottom is used to run the three representative years;
Wet, Dry and Median, in succession. With this option checked, the model will ignore the years
selected in the edit boxes, and it will instead run the three representative years (for the Chelan
model these years are: 1956-Wet, 1979-Dry, and 1960-Median).
Click the OK button to begin the model run. The model’s progress can be followed on the status
bar, where the date will scroll through the period selected. When the model has finished
running, it will have saved the model output, for each year included in the period of record, in a
separate file. For example, if two years of data were included in the model run, 1975 and 1976,
then the model will have saved two data files containing the output; 1975_out.dat and
1976_out.dat. The data files contain daily values by plant for numerous categories. A sample of
an output data file is shown below.
21
CHEOPS™ Model Documentation
As can be seen, the output data file is difficult to interpret and does not contain any totals. For
this reason they have limited value to the user. These files may be viewed using any word
processor with the ability to view Text format, or you may use the Retrieve Energy Output
option in the View Output drop-down menu which is discussed in the Section 2.5.1.
2.4.3
Run Reservoir & Energy
Selecting the Run Reservoir & Energy option will run the CHEOPS™ Rule Curve model and
Energy model in succession. The output files (Elevation.dat, and Flow.dat) from the Rule Curve
model are used as the inputs for the Energy portion of the model run. Essentially this option is
identical to first selecting the Run Reservoir option and, after it has finished running, then
selecting the Run Energy option.
2.4.4
Run Weekly Details
The Run Weekly Details option is used to examine, in detail, the operations of each plant in the
model over a selected seven day period. An overview of how to use this powerful feature will be
given below, and a more rigorous examination of the output created with this option will be
found in Section 4.2. Upon selecting the Run Weekly Details option a dialog box will appear as
shown below.
This box allows the user to specify the starting date (Month, and Day) of the week under
examination. The year can be changed by selecting the Current Year option in the Hydrology
secondary drop-down menu within the Configure drop-down menu (see Section 2.2.2 for more
details using this feature). By default, the model will use the last year used in the latest Energy
22
CHEOPS™ Model Documentation
model execution. The model will run the selected week of data and automatically place the
results in the Excel workbook, Details.xls. This file, and the methods involved in viewing the
detailed output, will be discussed in Section 4.2. It is important to note that the results generated
by the Run Weekly Details option are identical to those numbers used and calculated by the
Run Energy (annual run) option. The Run Weekly Details simply retains and charts the 15
minute schedule for each plant during the specified week.
2.5
View Output
The View Output menu option is used to import the annual output data files into a more userfriendly environment. As was discussed in a previous section, the two CHEOPS™ modules
(Rule Curve and Energy) generate output files in a text format. These files have limited value
for the user as they are difficult to read and have no totals. The options in the View Output
drop-down menu will take the specified output files and summarize the results. This menu
option leads to a drop-down menu offering the following choices.
2.5.1
Retrieve Energy Output
The following options are used to summarize the Energy module output in three different ways,
which hopefully corresponds to the three most common methods of utilizing the model; period
of record, single year; as well as the three representative years model execution. These three
options are better illustrated in the screen capture below.
23
CHEOPS™ Model Documentation
2.5.1.1 One Year
When this option is selected, the model will prompt the user for the specific year to be
summarized into monthly and annual totals. Upon selection, a dialog box will appear as shown
below.
All files of type *.dat will
be listed. Select the
desired annual output file
and click Open.
When the box appears, simply select the desired annual output file from the list of data files and
either double-click on it, or click the Open button. CHEOPS™ will copy the data from the
selected output file and paste it to the appropriate cells of the Output.xls workbook. The
worksheets inside this workbook will be discussed in some detail in Section 4.3. To return to the
main CHEOPS™ interface from the Output.xls workbook, simply close that workbook. If you
want to save that summary file you must use the Save As feature of Excel to save the Output.xls
workbook under a different filename. This will create a new file containing the summarized
annual model output. It must be saved under a new filename, if the summarized totals are to be
saved, because CHEOPS™ will copy the data from the selected output file to the Output.xls
workbook, erasing the old totals in the process, when the Retrieve Energy Output - One Year
24
CHEOPS™ Model Documentation
option is selected. For this reason, Output.xls is a read-only file. See Section 4.3 for more on
the Output.xls file.
2.5.1.2 Period of Record
Selecting the Period of Record option from the Retrieve Energy Output secondary menu
allows the user a convenient method of summarizing the Energy model output for a model run
encompassing the entire period of record. When the Period of Record option is chosen, the
model will automatically use the output file corresponding to each year in the period of record,
and summarize the totals. This option requires that the user has performed an Energy model run
for each year included in the hydrologic period of record. The model sequentially looks for, and
opens, each output file in the period of record. That span of years is defined through the use of
the Retrieve Hydrology Data, as was described in Section 2.2.2. See Section 4.3 for more on
the Output.xls file.
2.5.2
Retrieve Rule Curve Output
This option is used to view the tabular and graphical summaries of the reservoir model output
files discussed in Section 2.4.1. The two options listed in the Retrieve Rule Curve Output
secondary drop-down menu (Retrieve Durations and Reservoir Levels and Details) are
discussed below
2.5.2.1 Retrieve Durations
Selecting the Retrieve Durations option directs CHEOPS™ to open the RCDurations.xls
workbook. This file, which will be discussed in detail in Section 4.4, allows the user to view
flow and elevation duration curves for each plant involved in the Rule Curve model.
25
CHEOPS™ Model Documentation
2.5.2.2 Reservoir Levels and Details
This option provides the means for viewing the daily results of the reservoir model, as well as
monthly summaries of the pertinent flows and elevations (averages, maximums, and minimums).
When this menu option is selected, the CHEOPS™ model will open the RCOutput.xls
workbook. This file will be discussed in detail in Section 4.5.
2.6
Exit Model
The fourth option on the CHEOPS™ menu is Exit Model. This option returns the menu bar to
the default Excel menu options, with one addition. The new menu bar is shown below.
Additional
menu option
The menu is identical to the default Excel menu except the CHEOPS Model option has been
added. All of the Excel menu options function as normal. When the CHEOPS Model option is
selected, a drop-down menu will appear as shown below.
Two options will appear in the drop-down menu; Return to CHEOPS Menus and View
CHEOPS Worksheets.
26
CHEOPS™ Model Documentation
2.6.1
Return to CHEOPS Menus
Selecting Return to CHEOPS Menus will do just that; reset the menu bar to the CHEOPS™
main menu and bring the user back to the main interface screen.
2.6.2
View CHEOPS Worksheets
The View CHEOPS Worksheets option is a more interesting alternative. Selecting this option
will “Unhide” the CHEOPS™ worksheets. The sheet tabs available are shown below, and a
listing of the sheets and their function will follow.
New sheet tabs. The
number of Input
sheets will depend
on the number of
plants in the model.
SHEET
Interface
Common
Input
FUNCTION
The main CHEOPS™ interface sheet.
The model input data that does not vary by plant. Load shapes and power values,
for example.
Model input data for each plant. Each plant in the model will have a separate Input
sheet.
A detailed description of each sheet will follow in Section 3.0.
27
CHEOPS™ Model Documentation
3.0 CHEOPS™ Worksheets
The CHEOPS™ worksheets are accessed through the View CHEOPS Worksheets option in the
CHEOPS Model drop-down menu (see Section 2.4.2). The sheet tabs available for activation
are shown below.
CHEOPS™
worksheets
These sheets are, for the most part, storage sheets for the data that has been entered through the
Configure and Configure Rule Curve menu options. Most of the values on these sheets are
accessible through the various CHEOPS™ menu options and drop-down menu options. If a
dialog box is available for making the changes to a specific project parameter, we recommend
using it, rather than entering the data directly on the sheet, to avoid confusion and inevitable
errors. However, there are a couple of configuration options that are only available through
direct modification of the CHEOPS Input sheets. These options are only for experienced users
of the CHEOPS™ model.
We recommend reading through the entire documentation and
experimenting with the dialog box configuration options thoroughly before attempting any of
these advanced configuration techniques. A detailed description of each sheet follows.
3.1
Common
The Common sheet contains model input data relevant to all plants. It stores the data filenames
and directory path where these files are located. The dates which define the hydrologic period of
record are kept on the Common sheet, as well as the current year associated with the data that is
on the Flow and Reservoir sheet. The Common sheet tracks and directs the model’s progress
from year to year, and triggers the type of simulation (annual, weekly detailed, etc.) to run. The
28
CHEOPS™ Model Documentation
load shape data and power values are kept on the Common sheet as well. There are only two
variables that will need to be changed on the Common sheet, and they are; the Forecast Length
and the Forecast Accuracy.
These two model variables are used by the Reservoir model
exclusively. The Forecast Length (found in cell B22) defines the number of days the model is
able to look ahead for determining a release schedule. This number must be between 1 and 14
days. The Forecast Accuracy is simply a percentage that is applied to each inflow in the forecast
period. For example, if the Forecast Accuracy was defined as 90% then the model would
multiply each inflow in the forecast period (the number of days being defined by the Forecast
Length) by the Forecast Accuracy. These options were set at 4 days and 100% for all runs of the
Lake Chelan model. These options are not designed for a rigorous examination of inflow
forecasts, but are used to internally time-average inflow data.
3.2
Input
Each plant in the CHEOPS™ model will have its own Input sheet. For modeling purposes, each
plant is numbered. Generally speaking, the plants are numbered in ascending order starting with
the plant furthest upstream and proceeding downstream. With only one plant in the model the
Lake Chelan model has a short plant listing.
Plant 1 - Chelan (Input1)
Most of the data on the Input sheets is accessible from the previously discussed menu options,
but some data on these sheets can only be changed directly. Again, this is not for novice Excel
users or those inexperienced with the CHEOPS™ model. The procedure for making changes on
the Input sheet is not difficult, but the CHEOPS™ model is very sensitive to the locations, and
types, of values it uses. A list will follow describing the locations of the input data, and whether
or not a dialog box exists to change the value. After the list, descriptions of those variables
without dialog boxes and the methods for changing them will follow.
29
CHEOPS™ Model Documentation
Variable Name
Generation Capability
Time Delay from Upstream Plant
Minimum Plant Operating Flow
Minimum Rule Curve Release
Gorge Limit
Head Loss Coefficients
Turbine Performance Data
Reservoir Storage
Tailwater Elevation
Bypass Flows
Minimum Flows
Base Flows
Ramp Rates Up
Ramp Rates Down
Level Fluctuations
Unit Maintenance
Flood Elevation
Absolute Minimum Elevation
Target Elevation
Outlet Characteristics (Priority 1)
Outlet Characteristics (Priority 2)
Outlet Characteristics (Priority 3)
Dialog
Box
N
N
N
N
N
N
Y
N
N
Y
Y
Y
Y
Y
Y
Y
Y
Y
Y
N
N
N
Cell or Range Reference
A7:E7 (Range of Cells)
A10 (Column A, Row 10)
A13
E13
I13
A18:F18 (Range of Cells)
See Below
A256:B279
D256:E279
A284:D295
A302:D313
G302:J313
A320:E331
A338:E349
A356:D367
A374:D385
A392:D403
A410:D421
A428:D439
A465:B485
D465:E485
G465:H485
Generating Capability
This table designates the maximum output the plant is capable of producing at each unit. Under
most operating conditions, the plant is limited by the turbine performance characteristics
(hydraulic capacity, efficiency, and design head) which are already built into the model, but
some system scenarios can dictate other generation limitations. For example, a generator may
limit plant output. This option is available in the Lake Chelan model; however, it has not been
used for any of the scenarios examined to date. The following sheet shows the location of the
Generating Capability, Time Delay, Minimum Plant Operating Flow, Minimum Rule Curve
Release, and Gorge Limit.
30
CHEOPS™ Model Documentation
Time Delay from Upstream Plant
Enter the flow travel time, in hours, from the plant directly upstream to the selected plant. This
option is not applicable to the Lake Chelan model.
Minimum Plant Operating Flow
Not to be confused with Minimum Flows, the Minimum Plant Operating Flow is the minimum
flow (in cfs) required by the plant to produce energy. If the Minimum Flow is greater than zero,
but less than the Minimum Plant Operating Flow, the CHEOPS™ model will schedule (when
possible) the plant at the Minimum Plant Operating Flow (or higher) to avoid “wasting” water.
To put it more simply, the Minimum Plant Operating Flow is the minimum flow that will be
scheduled if flow needs to be scheduled at that time. The Minimum Flow, on the other hand, is
the minimum flow that must be exceeded 24 hours a day.
Minimum Rule Curve Release
This option is used by the reservoir model to indicate the minimum daily average flow to be
released on any day. If the model determines that something less than this amount is the proper
release, the release will instead be set to zero. This will happen until the model calculates a daily
average discharge that exceeds the Minimum Rule Curve Release. This variable is used to keep
the model from releasing an amount of water that is difficult for the Energy model to schedule
efficiently.
31
CHEOPS™ Model Documentation
Gorge Limit
The Gorge Limit indicates the amount of flow in the Chelan River gorge at which significant
erosion can be expected. This value is used principally in the output files and not in the model
scheduling logic.
Head Loss Coefficients
The cells for entering plant head loss coefficients are shown below.
The head loss coefficients are labeled common or by unit. The common head loss is for head
losses experienced by the plant regardless of the unit. The unit specific coefficients correspond
to head losses experienced by each unit, in addition to the common head loss.
Turbine Performance Data
The information presented here compliments the earlier presentation of the Turbine
Performance Data menu option in Section 2.2.7. We would again like to stress the need for a
certain level of proficiency with Excel and CHEOPS™ before attempting this relatively
advanced modification. As demonstrated in the numbered procedure of Section 2.2.7, changes to
the turbine-generator performance data must first be made on the appropriate Input sheet. The
location for making those changes is shown in the screenshot below. Notice that this screen is
only for Unit 1 of the plant. Subsequent units (maximum of 5) are displayed by scrolling down
the Input sheet until the desired unit’s data is visible. The Head Values must be the same for
each unit at a particular plant, so changes to the range of net heads must be made to Unit 1, and
the modification will be automatically transferred to each unit.
32
CHEOPS™ Model Documentation
Net Head Values; must
be changed at Unit 1.
Flow and Efficiency
columns.
Each unit has 5 Flow vs. Efficiency curves, each at a different net head value. Each curve may
contain up to 50 data points; curves for each net head must have the same number of data points.
However, multiple units in the same powerhouse need not have the same number of data points
in their performance curves. The range of net heads (Minimum to Maximum) must include
every possible head value that the plant will see during operations, CHEOPS™ will not
extrapolate performance above or below the specified head range. The model is also not able to
extrapolate beyond the range of flows given at each net head. The largest flow given in the
Rated Net Head efficiency curve (Columns E and F) is the hydraulic capacity of that unit. The
peak flow for the unit is considered to be the flow associated with the highest efficiency at a
particular net head. In the example performance data above, the unit hydraulic capacity is 4,882
cfs, and the peak flow and peak efficiency at the rated head are 4,307 cfs and 88.96%
respectively. In the example above, the five curves are identical, but this does not have to be
(and usually isn’t) the case. Many times only one efficiency curve at one net head value is
33
CHEOPS™ Model Documentation
known, but a range of heads is required by the model. Two options exist in this case; the first is
to copy the same curve over to other head vales and assume no change in performance with head
(oftentimes an acceptable approximation), the second option is to synthesize other curves, for
other net heads, based on the known values. The description in this section corresponds to steps
1 and 2 of the procedure outlined in Section 2.2.7.
Reservoir Storage; Tailwater Elevation; and Ramp Rating Curve
These three model inputs are similar in their presentation and requirements; therefore, we will
discuss them concurrently. The location of these data tables is shown below.
Value must be at least 1
cfs. A zero will cause a
model error.
The Lake Chelan model has an
additional monthly tailwater
table. The rating curve above is
not used in this model.
The tables are fairly self-explanatory. The Reservoir Storage table contains reservoir elevations
(ft) and the corresponding reservoir storage value (acre-ft). The Tailwater Elevation table (rating
curve) stores Flow (cfs) vs. Elevation (ft) data for the Tailwater. An important requirement for
the tailwater rating curve is that the smallest flow allowed defining the curve is 1. A zero will
cause a run-time error. Note: the Lake Chelan model has a monthly average tailwater table that
34
CHEOPS™ Model Documentation
is used for determining the tailwater level for each day. The tailwater vs flow rating curve is not
used in any model calculations at this time. The Ramp Rating table is used only for plants that
have their ramp rates defined by river stage per hour and day(ft/hr and ft/day). The data points
for this curve should be river stage versus flow data where the ramp rates are measured. The
Lake Chelan model is not currently configured to handle a ramp rating table. This may be added
at a later date if desired and if the ramp rates in question require a rating table.
That concludes Section 3, CHEOPS Worksheets. Each sheet in the Cheops.xls workbook that is
available for activation has been explained. Section 4.0 will take a detailed look at the other files
that comprise the CHEOPS™ model.
35
CHEOPS™ Model Documentation
4.0 Supplementary Model Files
This section will examine those files, other than the main Cheops.xls file, that together make up
the CHEOPS™ model. The other files include; Dispatch.xls, Details.xls, RCDurations.xls,
RCOutput.xls, and Output.xls. Each file, and the sheets that comprise it, will be explained
below.
4.1
Dispatch.xls
The Dispatch.xls workbook has been discussed briefly in a previous section. It was mentioned,
and one sheet was displayed, in Section 2.2.7, the Develop Dispatch Table option in the Turbine
Performance Data menu option. For explanation purposes, that screen will be duplicated
below.
As can be seen, this screen corresponds to the Flows sheet of the Dispatch.xls workbook. In the
normal course of model operations, this workbook is only accessed when a change has been
made to a particular plant’s turbine performance data. That is the only time that this workbook
36
CHEOPS™ Model Documentation
needs to be opened, and it will occur automatically when the plant is chosen from the Turbine
Performance Data secondary drop-down menu. The actions taken at this point are described as
steps 9 through 14 in Section 2.2.7, but the consequences of those actions were not explained.
When new turbine performance data is entered on the Cheops.xls Input sheet, it doesn’t serve
any function until it has been “incorporated” into the model. The Dispatch.xls workbook is the
vehicle for this incorporation. Clicking on the Incorporate Performance Data option will use the
new turbine data to create a table of energy outputs vs. turbine flow for the plant over a range of
gross heads (progress can be followed once again on the status bar). Before the output vs. flow
table can be created, the model must determine the optimal unit dispatching. The Incorporate
Performance Data option does this process without the user seeing Dispatch.xls or the dispatch
table. But, the unit dispatch table can be seen on the Flow sheet after clicking on the Develop
Dispatch Table button. Activating the Performance Chart worksheet within the Dispatch.xls
workbook will display a chart of the output vs. flow table that was just created by the model.
The curves correspond to each head in the range of gross heads used in formulating the table.
An example of this chart is shown below.
Each curve
corresponds
to a net head.
37
CHEOPS™ Model Documentation
The remaining sheet of the Dispatch.xls workbook is the Performance sheet. It carries out the
calculations required to create the dispatch table. This sheet is difficult to explain in detail, and
there is no need for the user to modify any of the cell formulas. It uses the data that has been
entered on the Plant Input sheet (head loss, net heads, turbine performance, and generation
limits) to interpolate the plant output at a range of flows for the specified range of heads.
When the new dispatch table has been viewed, click on the Return to Model button found on
the Flows sheet. The Incorporate Performance Data option runs this dispatch routine for the
fully operational plant case as well as cases where one unit is out. Then the new dispatch tables
are automatically integrated into the energy model.
4.2
Details
The Details.xls workbook was discussed briefly in Section 2.3.3. We will now examine it in
detail. The Details.xls workbook is accessed automatically after completion of the Weekly
Detailed Output option under the Run Model option of the CHEOPS™ menu.
Upon
completion of the weekly details model run, the following screen will be displayed.
38
CHEOPS™ Model Documentation
Hourly Schedule
Dialog Box. (will be
explained in detail)
Plant and date
being charted.
Chart showing
Reservoir
Elevations, Inflow,
and Turbine flow
for the specified
day and plant.
The Details.xls workbook is extremely valuable for analyzing the day-to-day decisions made by
CHEOPS™. Within Details.xls, a chart can be accessed displaying each day’s operations for
each plant for the specified week. The charts show reservoir elevations, inflow, and turbine flow
for the plant at all times during the day. With this tool, the user is able to see the scheduled
turbine flows, and also the reservoir fluctuations throughout the day. This information is not
available (or at least not readily accessed) from the annual output file. Maneuvering around the
Details.xls workbook is accomplished through the use of the Hourly Schedule dialog box shown
below.
39
CHEOPS™ Model Documentation
Date edit box.
Exit options. Save & Exit
will prompt for filename.
Exit Details will exit without
save (you will lose results).
Sheet activation buttons. Plant
buttons activate Plant summary
sheets (which show hard
numbers). Chart buttons will
move to the corresponding
chart display sheet.
The Hourly Schedule dialog box uses the date and sheet activation buttons to decide which sheet
and data to display. For example, if the user wanted to see the hourly schedule on April 15, 1991
charted for Plant 1, they would highlight 4/15/91 in the Date edit box, and click the Chart sheet
activation button adjacent to the Plant 1 button. After looking at the chart, perhaps a question
arises as to the exact turbine flow, or reservoir elevation at a certain time of day; the user could
then press the Plant 1 sheet activation button to view the actual numbers used in the chart.
4.3
Output.xls
The Output.xls workbook is accessed automatically when the Retrieve Energy Output option is
selected from the View Output drop-down menu. Section 2.5.1 illustrates the procedure for
opening the Output.xls file from within the main CHEOPS™ interface. When the file is opened
the following screen will appear. (This screen will appear slightly different depending upon how
the user accessed the Output.xls file)
40
CHEOPS™ Model Documentation
This screen corresponds to the Energy sheet within the Output.xls workbook. It summarizes by
month and plant the energy generated during the periods of the day; peak, secondary, and offpeak. Most likely, this sheet will contain the most valuable information to be obtained from the
CHEOPS™ model.
Most physical upgrade alternatives or modifications to the system
environmental constraints will be reflected in the Energy sheet either through a change in the
total energy generated by one or all plants or a shift in energy from one period to another
(usually a combination of the two).
The button (Name Run for Output) that appears on the Energy sheet is used to indicate what
model configuration was used to generate the output that is now summarized in the Output.xls
file. When it is pressed, the following dialog box will appear,
41
CHEOPS™ Model Documentation
Type in a
description of the
scenario used to
generate the output.
The description typed into this box will be added to the footer of pertinent sheets in the file. This
feature is only of value if the file is going to be printed or saved as another file name.
Other sheets in the Output.xls workbook include Reservoirs, Benefits, and the Plant Summary
sheets (one sheet for each).
Also, sheets have been provided, including ThreeYear and
ComptoBase, which are only used when the Output.xls file is accessed from the Wet, Dry,
Median option in CHEOPS™. The Reservoirs sheet displays the average daily discharge,
maximum reservoir elevation, and minimum reservoir elevation by month and plant.
The
Benefits sheet takes the energy generation totals by month and plant for each period and
multiplies them by the appropriate power value to arrive at a dollar figure for each period by
month and plant. Its format is nearly identical to the above-mentioned Energy sheet. The Plant
Summary sheets show the same information that can be found in the model output data file (eg.
1991_out.dat). These sheets receive the data from the output data file when the Retrieve
Energy Output option is selected. Once the data is in an Excel sheet, it can be manipulated and
summarized much more easily.
The Reservoirs, Benefits, and Energy sheets are logical
breakdowns of this data.
If the entire period of record is to be summarized, then the user would obviously want to select
the Period of Record option. The Output.xls file will look slightly different. It will have the
same sheets as was described above for the One Year summary, but will also include Energy
summary sheets labeled by year. In other words, when the Period of Record summary is
performed, Energy summaries are created for each plant by month and period and placed on a
sheet within the Output.xls workbook named for the year of data summarized.
If the user has made a run of the Energy model for the three representative years and would like
to summarize that output, the Wet, Dry, Median option should be selected. This will make
42
CHEOPS™ Model Documentation
available two other sheets mentioned earlier; ThreeYear, and ComptoBase. ThreeYear shows
the results for each year (wet, dry and median) as would be found on the Energy and Benefits
sheets if each year was looked at individually. The ComptoBase sheet shows the difference for
each year for the scenario just run to the Base case.
To save the summarized data, for all summary options, simply use the Save As option in the
Excel menus (you may need to select the Return to Excel Menus option in the Exit Model
drop-down menu) to save the file with a new file name. The alternative to always saving the
summarized data to a new file name, and thus cluttering hard drives with both data files and
Excel files, is store the data in the output text files automatically generated by CHEOPS™ and
use the Retrieve Energy Output option, and the appropriate output data file, when the
summarized data is desired. This alternative is a bit more time consuming, but does save
substantial hard drive space if many annual runs are made.
Very few (if any) modifications will ever need to be made to the Output.xls file. If further
number manipulation is desired, save the Output.xls file containing the appropriate data under a
new file name and make the changes in the new file to avoid making any unnecessary changes to
the Output.xls workbook.
4.4
RCDurations.xls
This file is used to create and view the plant flow and elevation duration curves. It uses the
RCTempOutput*.dat text output files created by the reservoir model to generate these curves.
When the Retrieve Durations option (discussed previously in Section 2.5.2.1) is selected from
the CHEOPS™ main interface, the RCDurations.xls file is opened and the following screen will
appear.
43
CHEOPS™ Model Documentation
Select to change the footer on
all charts to define the scenario
that was used to create the
output. Used when printing of
the results is desired.
The buttons on the RCDurations.xls Interface sheet are self-explanatory. If, for example, the
user desired to see the flow duration curves for the plants involved, they would simply click on
the button stating “View Reservoir Flow Duration Curves.” If the user wants to see monthly
elevation duration curves the click on the button stating “View Reservoir Monthly elevation
Duration Curves.” Once that button is clicked, the following dialog box will appear.
This dialog box is asking if the user would like to load new model generated output data into the
RCDurations.xls workbook.
The first time this file is accessed from the Cheops.xls main
interface, “Yes” should be selected after each button is selected. The only time that “No” is an
appropriate response is if the user has already loaded the data for one of curves, and now wants
44
CHEOPS™ Model Documentation
to view those same curves again (presumably after looking at one of the other output options).
The following screen shots shows an annual elevation duration curve.
Select Plant
dialog box.
A tabular duration curve is generated simultaneously with the actual duration curve charts. This
table is made visible each time one of the duration curve charts is generated. It can be found on
the sheet named DCTables. However, both duration curve charts must be generated if this table
is to reflect all the new rule curve output. In other words, when the View Reservoir Flow
Duration Curve option is selected from the Interface sheet, and new input data is loaded, the flow
portion of the DCTables is updated to reflect that new data. The View Reservoir Elevation
Duration Curve button must be pressed from the Interface sheet if the elevation portion of the
table is to be updated as well. To return to the Interface sheet select the Interface tab at the
bottom of the Excel sheet.
The monthly charts display a chart for each month and a chart for a user selected range of
months. The user selects a range with the following dialog box.
45
CHEOPS™ Model Documentation
The monthly option will then load in the data display the 12 months and the selected range of
months. Again to return to the Interface sheet select the Interface tab. The monthly options do
not update the DCTables Sheet.
The “Name Run for Output” button is used to update the footers on all the charts generated to
indicate which scenario was being evaluated. This option need only be selected if the charts are
to be printed.
4.5
RCOutput.xls
The RCOutput.xls file is used to graphically view the results of the Reservoir model. A variety
of options are available in this workbook as is shown in the screen below.
46
CHEOPS™ Model Documentation
The buttons are labeled for an easy reminder of the table or chart that will be generated when
each is selected. As with the RCDurations.xls file (Section 4.4), when each button is selected it
will prompt the user if new data is to be loaded with the following dialog box.
As with the RCDuration.xls file, when each button is selected for the first time upon accessing
the RCOutput.xls file the “Yes” should be chosen from this box. If the user needs to revisit a
particular output screen after already loading that data, then a “No” is appropriate. Also similar
to the RCDurations file, if the “Yes” is selected, a box will appear asking for the path to the data
to be summarized. See Section 4.4 for more on the techniques for loading data.
Each button is self-explanatory in the RCOutput.xls file except the Name Run for Output button,
which, like the same button in the RCDurations.xls file, will allow the user to change the footer
on all output screens to include the user-defined scenario name.
47
CHEOPS™ Model Documentation