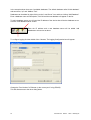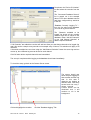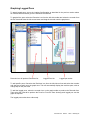
1
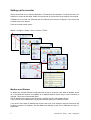
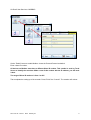
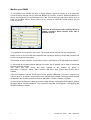
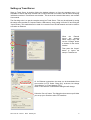
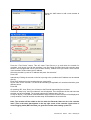
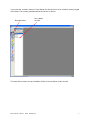
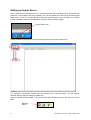
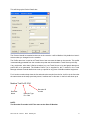
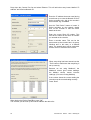
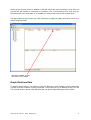
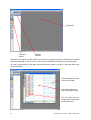
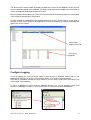
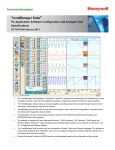
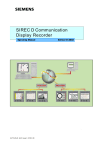
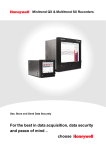
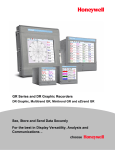
Application Note 9
Modbus Communications for
X Series Recorders and TrendServer
Modbus is a communications protocol that is supported by the X Series Recorders over either
Ethernet or RS485. It will allow the transfer of data from the recorder to Trend Server, allowing real
time graphing and logging of data to a database on the PC.
To use Modbus you will need to have Trend Server PC application software installed on your PC. All
X-Series recorders, SX, QX and QXe are fitted with Ethernet ports as standard. The SX and QX have
RS485 as standard, the QXe has to have the optional Comms Expansion Board fitted to use RS485.
Note:
Paragraphs in italics only apply if using Modbus over RS-485
Text in “inverted commas” indicates this text is the text shown on the applications buttons.
43-TV-07-34 Issue 1 GLO January 07
1
Setting up the recorder
Set up the recorder for the required application. The setup will be imported to Trend Server later, so it
needs to be correct at this stage. Details for recorder set up can be found in the product User manual.
If Modbus is to be used over Ethernet then the Ethernet port must be configured. First connect the
recorder to the local network.
From the recorder screen press….
MENU > Configure > Setup > Edit .> Comms > TCP/IP
Modbus over Ethernet
As default the recorder Ethernet configuration will be set up as shown, with Static IP address turned
off. In this state the recorder will negotiate an IP address with the server and no user involvement is
required. This is the recommended option.
The IP address will be shown in the second line (160.221.36.25 in the example above).
Take a note of the IP address this may be required when setting up Trend Server later.
If you wish to use a static IP address then click the red cross. It will change to a green tick and you will
be able to enter the IP address, Sub Net Mask and Gateway, these can be obtained from your IT
department.
2
43-TV-07-34 Issue 1 GLO January 07
Hit “Back” then Services > MODBUS
Hit the “Enable” button to enable Modbus. Leave the Port and Protocol as default.
Enter a slave ID number.
All devices on Modbus must have a different Slave ID number. This number is used by Trend
Server to identify the recorders. Make a note of this number with the IP address, you will need
it later.
The range of Slave ID numbers is from 1 to 255
That completes the setting up of the recorder. Press “Finish” the “Commit”. The recorder will re-boot.
43-TV-07-34 Issue 1 GLO January 07
3
Modbus over RS485
To use Modbus over RS-485 the setup is slightly different. Ignore the setting up of IP addresses.
Follow the menus through until you reach the Modbus set up menu, as above. Enable the Modbus as
above, but change the port from Ethernet to RS- 485. This will bring up other menu options such as
baud rate and Byte options. These need to be set correctly to match the RS-485 settings you are
using on your PC.
The Slave ID must be set; this is used by the PC to
identify recorders. Each recorder must have a
different slave ID.
To complete the set up hit finish and commit. The recorder will re-start with the new configuration.
Details on how to set up the RS-485 parameters and connection details for the RS-485 connector can
be found in the product user guide.
The recorder set up is complete. Connect the recorder to the Ethernet or RS-485 network as required.
To check that the recorder Ethernet settings are correct, the IP address can be used to browse the
recorder in internet explorer.
First check that web access has been enabled in the recorder by going to:
Main Menu > Configure > Setup > Edit > Comms > Services > Web. This will show a tick if web is
enabled.
Copy the IP address, from the TCP/IP menu into the Internet address bar, (no www. is required) e.g.
160.221.36.25 or xs-nnnnnn, where nnnnnn is the recorder serial number. The serial number and the
IP address of the recorder can both be found in: Main Menu > Status > System > General.
Hit return and if the Ethernet is working correctly a page offering 3 languages should appear. Select a
language and hit “Submit preference”. Your recorder’s web page should appear. If this appears the
Ethernet is working correctly.
4
43-TV-07-34 Issue 1 GLO January 07
Setting up Trend Server
Start up Trend Server by double clicking the desktop shortcut, or from the programs menu. It is
advisable to ensure that each recorder has a unique Recorder ID number; this will make identifying
individual recorders in Trend Server much easier. This is set in the recorder Ident menu, see recorder
User manual.
The first thing to do is to get the recorders setup into Trend Server. This may be achieved by saving
the setup at the recorder to Compact Flash or USB memory, then putting it into the PC and using the
“Import” button. This method has to be used for a recorder on an RS-485 network and can be used for
a recorder on Ethernet.
When
the
External
appears
Import
box
select “Setup only” and
use the “Change” button
to browse for the device
location.
Then press the “Import”
button to import the
setup to Trend Server.
Or for Ethernet connections the setup can be downloaded from
the recorder via FTP. Select “Setup only” as shown, but change
“from directory” to “From Network (FTP)”.
When “From network” is selected the dialog box will change.
Select the “Set up” button. The dialog box that comes up will allow
you set up your recorder to allow FTP transfers.
43-TV-07-34 Issue 1 GLO January 07
5
Press the “Add” button to add a new recorder to
the list.
Press the “Find Device” button. This will cause Trend Server to go and check the network for
recorders. It will give a list of all the recorders it can find, listing Recorder Name (the recorder name
shown in the top right hand corner of the recorder screen), network name (xs-nnnnnn, where nnnnnn
is the recorder’s serial number) and IP address.
Select the recorder by name or IP address and press “Use selection”.
Press “OK”
Alternatively if finding the recorder in the list is proving to be a problem the IP address can be entered
directly:
Enter the IP address from the recorder that you noted earlier.
Give a name for the recorder. This should be something recognisable; all recorders should be given
different names.
Press OK
On pressing “OK”, then “Done” you will return to the External Import dialog box as above.
Check that “setup only” and “from Network” are still selected. Then drop down the list and select the
recorder you have just added. The recorder name and IP address are in the list.
Finally hit “Import”, Trend Server will download the setup from the recorder and this will be displayed in
a setup window. Press OK and this recorder setup will be added to the recorder list.
Note: The recorder will be added to the list under the Recorder Name as set in the recorder
itself. (This is the name that appears in the top right corner of the recorder screen when in
normal logging mode) NOT the name you gave the recorder when setting up the FTP.
6
43-TV-07-34 Issue 1 GLO January 07
If you press the “recorder” button on Trend Server this will show a list of all recorders currently logged
with a setup. The recorder just added will be the last one on the list.
Recorder button
Last added
recorder
This name will be used to set up the Modbus Profile in Comms Server for the recorder.
43-TV-07-34 Issue 1 GLO January 07
7
Setting up Comms Server
When Trend Server is installed onto a PC, Comms Server will also be installed. When Trend Server is
started up, Comms Server will also be started. The icon will appear in the tool tray at the bottom right
hand corner of your PC. Comms Server controls the communications to the recorders. It is used to
control what data is stored in what data base, and how often the data is logged.
Comms Server Icon
Double click the Comms Server icon; this will bring up the Comms Server Set up box.
For connection via ethernet. Double click the ethernet icon in the left column. This will activate
ethernet, the red cross will change to a black tick.
Now the recorder must be added. To do this click the “add new device” button, The first in the row of
three.
Add New
Device
8
43-TV-07-34 Issue 1 GLO January 07
This will bring up the Device Details box.
The Protocol should be matched to that set on the recorder. It will be Modbus-X by default so leave it
at that unless you changed it on the recorder.
The Profile name box is used to tell Trend Server how to access the data on the recorder. This profile
is automatically generated from the recorder setup that was downloaded to Trend Server previously.
If any equipment, other than X-Series recorders is to use Trend Server to log and graph data then a
profile has to be generated. The Modbus Profile Tool is supplied for this, a section in the Trend
Manager software manual details how to set up a profile for any piece of Modbus enabled equipment.
For X-series recorders drop down the list and select the recorder from the list. It will be in the list under
the same name as the setup previously saved, “modbus test” in this case. In the list it will show up as
Modbus Test Ez ID:1234
Recorder
Name
Recorder ID
number
Recorder Type
Ez = QXe
NOTE:
The Recorder ID number is NOT the same as the Slave ID Number
43-TV-07-34 Issue 1 GLO January 07
9
Drop down the Comms Port list and select Ethernet. This will add other entry boxes labelled “IP
address” and X-Series Network ID.
Enter the IP address that was noted during
recorder set up or enter the Network ID for X
Series recorders only; this is the recorder’s
serial number. Eg. xs-999999.
Use the “Find Device” button to locate XSeries recorders on the network, double
click on the recorder to add the device
details to the box.
Enter the correct Slave ID number. This
must be the same as the Slave ID number
you entered on the recorder.
Enter a recorder name. This can be the
same name as the recorder has in its setup,
“Modbus test” in this case, or a different
name. The entered name will be used within
Comms server to reference the recorder.
When every thing has been entered use the
“Test” button to make sure that everything is
set up correctly.
Because we are using Modbus-X, the
Modbus-X column gives correct readings;
the Modbus column returns incorrect
readings. (Vice-versa if using Modbus)
If the column shows the correct reading the
recorder must be communicating correctly.
Press “Done”
When back to the Device Detail Box, press “OK”.
The recorder you have set up will now be added to the device list.
10
43-TV-07-34 Issue 1 GLO January 07
Setting up the Comms Server for Modbus on RS-485 follows the same procedure, but the PCs com
port that the 485 interface is connected to is selected in the “Communications Port” drop down list.
Everything else is the same (there is no IP address to enter) and test should still work the same.
The status lights will not be active yet. This is because no logging or graphs have been set up so no
data is being requested.
New device added, ensure
the” active” box is ticked
Graph Real-time Data
To graph real-time data on Trend Server, press the “Real-time” button located on the left hand side.
This will list all the recorders currently connected. The recorder set up on Modbus will be in the list.
The recorder will be in the list under the name that you gave it when entering the device details.
43-TV-07-34 Issue 1 GLO January 07
11
Graph area
Real-time
button
Modbus
recorder
Either click and drag the recorder name from the list to the graph area, this will add all the recorders
pens onto the graph, or click on “pens”, to list the pens available and drag the pens onto the graph.
As soon as the pens are on the graph they should start to update in real-time. The graph will be split
into two as below.
The blue background area
is the real time data.
The white background
area is the historical data.
The pen scales have an
orange strip to show these
are Real-time pens
12
43-TV-07-34 Issue 1 GLO January 07
The white area for historical data will display the data that is stored to the database. At this point we
have no data being stored to the database, it is simply being acquired and graphed, and if the graph is
closed any data downloaded via Modbus will be lost.
More information about graphing on Trend Server and the options for arranging pens etc. are available
in the X Series User Manual for this product.
To store the data to a database the pen logging needs to be set up in Comms Server. If your graph is
still open Comms Server should be showing that the recorder is operating by displaying flashing green
lights in the “Active column”
Green Lights
means comms OK
Pens being
graphed
Configure Logging
To set up logging you must first decide where to store the data. A database must be set up. The
database can either be on the PC running Comms Server, or on another networked device.
There will be a database already set up by default on your PC when Trend Server was loaded. This
will be called “Initial database”.
To set up a database on the PC click the “Database Servers” icon, this will expand to show “local
Servers” i.e. databases on that PC. Click “local servers” to expand out to show all databases.
43-TV-07-34 Issue 1 GLO January 07
13
In the example shown there are 3 available databases. The default database called “Initial database”
and two others, “ap” and “Modbus Test”.
Databases can be added by right clicking on the “Local Server” icon and then clicking “Add Database”.
Enter a database name and description, click OK and the new database will appear on the list.
To add a database server you will need the IP address of the device that will be the database server.
Click the “new database server” button.
Enter the IP address and a new database server will be added. Add
databases to this server as above.
To configure logging click the middle of the 3 buttons. The logging Configuration box will appear.
Change the “Port Number” to Ethernet (or the correct port if using RS-485).
This will allow access to the other dialog boxes.
14
43-TV-07-34 Issue 1 GLO January 07
Drop down the “Device ID Number”
list and select the recorder from the
list.
The “Connected Database Servers”
list is greyed out in the example
above, but if other database servers
had been configured they would be
in the list.
“Database Currently Logging To” –
from the list select which database
you want to log this recorder to.
The “Channels available to be
logged” list shows all the recorder
channels that can be stored to the
database. Either “Add All Channels”
or use “Add Channel Selection” to
add the required channels.
If “All Channels” are added the next box will ask how often you want these channels to be logged (log
rate), this can be a sample every second to one sample every 24 hours. This selection will apply to all
channels.
If channels are added one at a time using the “Add Channel Selection” button the same log rate box
comes up, but a different log rate can be set for each channel.
Click OK when all the required channels have been added.
The set up is complete and the logging to the database should start immediately.
To check the setup, go back to the Comms Server screen.
The screen should now
show the pens logging for
that recorder and their log
rate. In this case 2
channels are logging at
different rates, one every
second and one every 1
minute, 1 second.
Comms Server can be
minimised now, it will
continue to run in the
background.
Click and highlight the recorder.
Click the “Database logging” Tab
43-TV-07-34 Issue 1 GLO January 07
15
Graphing Logged Pens
To graph logged pens, set up the Logging Configuration as described in the previous section above
for Comms Server and then go to the Trend Server software.
To graph all the pens select the Recorder icon from the left side toolbar and select the recorder from
the list. Now hold down the left mouse button and drag the recorder onto the graph area.
Recorder icon will produce Recorders list
Logged Pens list
Logged pen scales
To add specific pens, first select the Real-time icon from the left side tool bar and select the recorder
and drag the recorder onto the graph area. This will automatically display the real-time pens, with an
orange strip on the pen scale.
To add the logged pens, select the recorder icon on the graph toolbar to produce the Recorder lists.
Then select the Pens tab to produce the Pens list. From the Pens list drag each logged pen onto the
graph as required.
The logged pens scales have a blue strip.
16
43-TV-07-34 Issue 1 GLO January 07