1
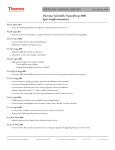
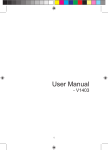
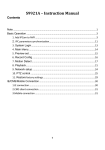
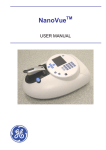
PO Box 188 Saffron Walden CB10 9BA United Kingdom Tel: +44 (0) 131 2080522 Fax: +44 (0) 207 1173239 [email protected] www.picodrop.com Picodrop Microlitre Spectrophotometer Version 1.06 User Manual All product and brand names used in the document are trademarks or registered trademarks of their respective holders. Copyright © 2008 Picodrop Ltd. Registered in England no.05505772. VAT: GB 881 3758 91 Table of Contents Page Number Safety Warnings and Precautions 3 Potential Safety Hazards 4 Instrumentation Overview 6 On Receipt of Your Instrument 7 Instrument Setup 8 Software Installation 10 General Use 12 Blanking 13 Nucleic Acid Measurements 14 Protein Measurements 16 UV/Vis Measurements 17 Microarray Dye Measurement 18 Maintenance 19 Trouble Shooting 20 2 of 2 Safety Warnings and Precautions Please read this section before operating the spectrophotometer. Operators of this instrument must be trained in both general laboratory safety practices and the specific safety requirements of the spectrophotometer. If the equipment is used in a manner not specified by the manufacturer, the protection provided by the equipment may be impaired. All functions performed within the context of preparing, performing and completing a run should be done with caution and care, and with general respect both to the instrumentation and to associated chemicals, samples and other devices. Ensure that anyone involved with the operation of the instrument is instructed in both general practices for laboratories and specific safety practices for this instrument. Always place the instrument in a location where, if necessary, the mains power supply can be disconnected immediately. Symbols and Conventions The following chart is an illustrated glossary of the symbols that are used in this manual. CAUTION This symbol indicates a potential risk and alerts you to proceed with caution CAUTION This symbol indicates the presence of high voltage and warns the user to proceed with caution 3 of 3 Potential Safety Hazards Electrical Standard electrical safety precautions should be applied. Ensure that the proper voltage is supplied before turning the instrument on for the first time. The device must be connected to a grounded socket. Do not touch any switches or outlets with wet hands. Switch the instrument off at the mains supply before disconnecting the AC power cord. Unplug the instrument prior to cleaning up any major liquid spills and prior to servicing any of the electrical or internal components. Only qualified personnel should perform electrical servicing. Hazardous Substances You must observe the relevant safety regulations when handling pathogenic material, radioactive substances or other substances hazardous to health. Operating Environment Please ensure that the ventilation slots of the device remain free to vent at all times. A space of at least 10cm should be left around the spectrophotometer. The ambient temperature should be between 10°C and 30°C, the humidity between 0% and 95%. 4 of 4 Solvent Compatibility The Picodrop Spectrophotometer unit is compatible with the following solvents : Please note that the UVpette Tips should not be used with concentrated solutions of Phenol and Chloroform. Acetic Acid (dilute) Acetone Acetonitrile Benzene Butanol Carbon Tetrachloride Chloroform DMSO Ethanol Ether HCl (dilute) Hexane HNO3 (dilute) Isopropanol Methanol N-Propanol Sodium Hydroxide Sodium Hydroxide Sodium Hypochlorite (bleach), Toluene, INCOMPATIBLE SOLVENT: Hydrofluoric Acid and derivatives 5 of 5 Instrument Overview The Picodrop® is a microlitre spectrophotometer that provides the user with the facility to recover their sample after measurements have been taken. It is a full spectrum (230 – 850nm) spectrophotometer which allows for measurements of common laboratory samples, such as DNA, RNA and protein, in small volumes, with a high degree of accuracy and precision. Samples are contained within patented UVpette™ pipette tips. There is no possibility for cross contamination or carry over on a sample platform. Precious samples can be handled within a sterile environment and are completely recoverable. A 2.5µl sample is drawn up directly into the UVpette™ using a P10 pipette. The pipette is placed into the holder, which positions the tip through a light beam, emitted from a fibre optic cable connected to the tip holder. The light source is a pulsed xenon lamp and the light path through the tip is 1mm. A spectrophotometer analyses the light after it passes through the sample, via a 1dimensional CCD array detector contained within a second fibre optic cable, on the opposite side of the holder. The instrument is controlled using Picodrop software run from a PC/laptop. The user can choose to see the data in real-time, or read and store the data in a tab-delimited Microsoft Excel format. ONLY USE PIPETTE TIPS MANUFACTURED BY PICODROP LIMITED Consumable re-order details: Ref# PET01 Interchangeable P10 pipette tip block (only supplied as replacement spare part) Ref# UVTIPB P10 UVpette pipette 96 boxed tips, UV transparent to 230nm Ref# UVTIPG P10 UVpette pipette tips 2,000 loose bagged, UV transparent to 230nm Ref# PCAL01 PicoCal UV/Vis 260nm Calibration Standard fluid, 75ul tube Ref# PCAL01-GLP PicoCal UV/Vis 260nm Calibration Standard fluid, 750ul tube – GLP/NIST Traceable certified 6 of 6 On Receipt Of Your Instrument List of items included with your Picodrop Spectrophotometer: 1. 2. 3. 4. 5. 6. 7. 8. 9. 10. Picodrop Spectrophotometer Unit Pipette Holder 1.5mm Allen Key (for maintenance) P10 Pipette (Optional) Box of 96 UV-Irradiated UVpette tips USB Cable 2 Fibre Optic Cables with Connectors 12V Power Cable and Transformer Software Disk User Manual Site The spectrophotometer should be placed on a rigid, flat, clean surface. Make sure that the instrument is completely stable. Adequate ventilation is important. Make sure there is sufficient space so that the rear and side air slots are not covered and to allow cooling air to circulate freely around the instrument. There should be no paper under the device as this may block the ventilation path. The unit should always have at least 10cm distance to the next wall or neighbouring instrument. Picodrop Ltd spectrophotometer instrumentation is developed for operation in laboratories in which there is normal ambient temperature and no explosive atmosphere. The ambient temperature should be between 10°C and 30°C, the humidity between 0% and 95%. Connect to the electricity and check that the LED light on the front of the unit is illuminated. For best results allow unit to ‘warm-up’ for 10 minutes before measuring samples, this allows the lamp to stabilise. Note the unit can be left connected and switched on all the time. This will not damage the unit and only uses power to illuminate the LED. The flash lamp is not operating unless a sample measurement is made. 7 of 7 Instrument Set Up Hardware installation (If not already pre-assembled) The pipette holder has been dismantled and disconnected for shipment. Fix the pipette holder to its round base by simply screwing it on. Figure 1. Assembling the pipette holder. Locate the 2 Silver fibre optic cables (one is connected to the front of the instrument). The fibres have SMA connectors at each end. Remove the rubber protectors. Connect the cable coming from the front of the instrument to either one of the SMA connectors at the base of the pipette holder. Push the connector into the socket and hand-tighten the nut to hold the connector in place. Do not use tools to tighten the fixing nut. 8 of 8 Figure 2. Connecting the cable to the pipette holder. Connect one end of the second fibre to the detection connector at the front of the instrument and the other end to the socket on the pipette holder. Figure 3. Fully Assembled Picodrop 9 of 9 Computer Requirements (minimum) Microsoft Windows XP Service Pack 2 Operating System 512Mb RAM 2.8GHz Pentium 4 or 1.6GHz Core Solo or Core Duo A DirectX 9 compatible graphics card with at least 64Mb of on-board RAM, e.g. Nvidia 5900 or better 200Mb of free disk space. One dedicated USB2 port (i.e. not on a hub, whether internal or external) Software Installation Please install the software before connecting the instrument to the PC: Insert the installation disk in the CD drive. Please click on the ‘Setup’ file. The software will install automatically, leaving the user with a shortcut on the desktop to the Picodrop interface. Instrument Start Up Connect the instrument to the PC by inserting the USB2 cable into the socket at the rear of the Picodrop. Power up the spectrophotometer by connecting the 12V power supply to the input jack. The orange light at the front of the Picodrop will indicate that the instrument is on. Start the program by double-clicking on the ‘Picodrop’ icon on the Desktop. 10 of 10 Picodrop Software Application Tabs Sample ID Input Reading button Real time reading button Store/Save Sample Blanking button Sample Type Result Display Reference wavelength (in nm) Figure 5. Picodrop software – Main Screen Function Buttons & Text Boxes: Application Tabs - allows the user to switch applications. Sample ID Input - allows automatic sample numbering, or custom input. Read button - pressed each time a measurement is required. Real time reading button (On/Off) - displays the measurements taken in real time. Store result - saves the current read results. Results are stored to a temporary file. Save stored results - saves data in the temporary file permanently. The data is stored in MS EXCEL format compatible with spreadsheets. Blanking button - allows the user to take a blank reading of buffer or water prior to sample reading. Sample Type selector: User selects the specific pre-set nucleic acid or protein setting. Result Display - Sample concentration determined from the absorbance reading. AutoRange – Automatically rescales the y-axis limit to suit the maximum absorbance. AutoSave – Automatically SAVES read results to the MS EXCEL spreadsheet after each measurement thereby removing need to press ‘Store sample’ after each measuresment. 11 of 11 General Use Correct Pipetting Procedure: Vortex sample briefly (5-20secs) Spin down samples briefly (10-15secs in a microfuge). Using a P10 pipette and a UVpette™ tip, pipette your sample. A minimum volume of 2.5ul is recommended. To minimise solution on the outside of the tip, avoid submerging the tip too far below the sample meniscus. Wipe off excess liquid from outside of tip with a dry tissue, this is particularly important if using viscous protein solutions. Do not place UVpette tips or your sample too close to heaters or the fan of the PC as heating the tips or sample may result in a rapid contraction in volume once the tip is placed the cooler pipette holder. This sample contraction will result in a space or bubble being visible at the bottom of the tip. This space will interfere with sample measurement. It is preferable that the sample, tip and pipette holder are allowed to equilibrate to room temperature for 5 minutes before commencing measurement. Figure 6. Recommended pipetting procedure 12 of 12 Blanking the Picodrop Before sample measurements are made, it is necessary to measure a blank solution to set the background absorbance to zero. The blank solution is usually the reagent, which you have used with your samples. Select a new tip and pipette 2.5ul of blank solution. Carefully insert the whole pipette and tip into the holder as illustrated below: a b c Figure 7a-c. Correct insertion of the pipette/tip assembly into the holder Click on the Blanking button on the software main screen. The indicator light on the front of the instrument will flash whilst the measurement is being taken. Blanking is complete when the sample button changes colour, from grey to green. To check that the blanking is acceptable i.e. with an Absorbance at 260nm < 0.05, at the wavelength of interest, click on ‘Start Reading’. A line at the bottom of the screen represents the blanking over the entire spectrum. Note: It is important to repeat the blanking at regular intervals e.g. after 5 minutes or 10-20 measurements. 13 of 13 Nucleic Acid Measurements Select the ‘Nucleic Acids’ application tab. Select the sample type (dsDNA, ssDNA, RNA) Tick the Auto Range box if you want the axis of the graph to set limits automatically. Blank the Picodrop Insert the pipette with sample and press the ‘Start Reading’ button. After a few seconds the concentration (in ng/ul) will appear in the bottom right hand window and the spectrum will be plotted. Click on the ‘Store Sample’ button and either continue with measurements or save the stored results by clicking on the ‘Save Stored Samples’ button. Figure 8. Example of dsDNA measurement Measuring Nucleid Acid Concentration: The "absorbance" of a chemical is a product of its (concentration) x (optical path length) x (extinction coefficient, E). Nucleic acids have a peak absorbance in the ultraviolet range at about 260 nm. When the spectrophotometer has a path length of 1 cm, absorbance = "optical density" (O.D.), and O.D. = E x concentration. Extinction coefficients vary with the type of nucleic acid. Double stranded DNA (dsDNA) has an E = 20 g-1cm-1L). Depending on the reference you read, the E for single stranded DNA 14 of 14 (ssDNA) is 20 or 30 g-1cm-1L, while E for RNA is 25 g-1cm-1L. Extinction coefficients can be used to estimate the concentration of a sample dissolved in a known aqueous volume, or to calculate the number of grams or moles of nucleic acid according to the following formulas: Determining Concentrations: A260 O.D. =1 Unit for dsDNA = 50 µg/ml = 50 ng/ul A260 O.D. =1 Unit for ssDNA = 33µg/ml = 33 ng/ul A260 O.D. =1 Unit for RNA = 40 µg/ml = 40 ng/ul The A320 is used to subtract absorbance due to particles in suspension. 15 of 15 Protein Measurements Select the ‘Proteins’ application tab. Select the sample type (e.g. BSA) Tick the Auto Range box if you want the axis of the graph to set limits automatically. Blank the Picodrop. Insert the pipette with sample and press the ‘Start Reading’ button. After a few seconds the concentration (in mg/ml) will appear in the bottom right hand window and the spectrum will be plotted. Click on the ‘Store Sample’ button and either continue with measurements or save the stored results by clicking on the ‘Save Stored Samples’ button. Figure 9. Example of BSA measurement Note: When using viscous samples, it is important to ensure that the sample does not adhere to the outside of the tip. Simply wiping the outside of the tip with a piece of clean dry tissue will normally avoid this potential problem. 16 of 16 Sample Types: A general reference setting based on a 0.1% (1 mg/ml) protein solution producing an Absorbance at 280 nm of 1.0 A (where the pathlength is 10 mm). Bovine Serum Albumin reference. Unknown (sample) protein concentrations are calculated using the mass extinction coefficient of 6.7 at 280 nm for a 1% (10 mg/ml) BSA solution. IgG reference. Unknown (sample) protein concentrations are calculated using the mass extinction coefficient of 13.7 at 280 nm for a 1% (10 mg/ml) IgG solution. Lysozyme reference. Unknown (sample) protein concentrations are calculated using the mass extinction coefficient of 26.4 at 280 nm for a 1% (10 mg/ml) Lysozyme solution. User-entered mass extinction coefficient (L gm-1cm-1) for a 10 mg/ml (1%) solution of the respective reference protein. Molar Extinction Coefficients vs. Absorbances for 1% Solutions Application of a molar extinction coefficient in the calculation yields an expression of concentration in terms of molarity: A / εmolar = molar concentration However, many sources, including the reference cited above, do not provide molar extinction coefficients. Instead, they provide absorbance (A280nm) values for 1% (= 1 g/100 ml) solutions measured in a 1 cm cuvette. These values can be understood as percent solution extinction coefficients (εpercent) having units of (g/100 ml)-1 cm-1 instead of M-1cm-1. Consequently, when these values are applied as extinction coefficients in the general formula, the units for concentration, c, are percent solution (i.e., 1% = 1 g/100 ml = 10 mg/ml). A / εpercent = percent concentration If one wishes to report concentration in terms of mg/ml, then an adjustment factor of 10 must be made when using these percent solution extinction coefficients (i.e., one must convert from 10 mg/ml units to 1 mg/ml concentration units). (A / εpercent) 10 = concentration in mg/ml The relationship between molar extinction coefficient (εmolar) and percent extinction coefficient (εpercent) is as follows: (εmolar) 10 = (εpercent) × (molecular weight of protein) Still other sources provide protein absorbance values for 0.1% (= mg/ml) solutions, as this unit of measure is more convenient and common for protein work than percent solution. This variation in reporting style underscores the importance of carefully reading stated values to be sure that the unit of measure is understood and applied correctly. Examples A. Proteins and Protein Mixtures with Unknown Extinction Coefficients If no extinction coefficient information exists for a protein or protein mixture of interest, and a rough estimate of protein concentration is required for a solution that has no other interfering substances, assume εpercent = 10. Most protein extinction coefficients (εpercent) range from 4.0 to 24.0.5 Therefore, although any given protein can vary significantly from εpercent = 10, the average for a mixture of many different proteins likely will be approximately 10. Note: the Picodrop software assumes the user enters the εpercent value cited above. Our software will convert Absorbance at 280nm into mg/ml of protein using the formula:Protein Concentration in mg/ml = (Abs at 280nm corrected to 10mm pathlength/εpercent) x 10. 17 of 17 UV/Vis Operation Select the ‘UV Visible’ application tab. Select the reference wavelengths. Blank the Picodrop Insert the pipette with sample and press the ‘Start Reading’ button. After a few seconds the result will appear in the bottom right hand window and the spectrum will be plotted. Click on the Store Sample button and either continue with measurements or save the stored results by clicking on the Save Stored Samples button. Figure 10. 18 of 18 Microarray Dye Measurements Select the ‘Microarray’ application tab. Select the dyes using the scroll arrows beside the Dye 1 and Dye 2 text boxes Blank the Picodrop. Insert the pipette with sample and press the ‘Start Reading’ button. After a few seconds the result will appear in the bottom right hand window and the spectrum will be plotted. Click on the Store Sample button and either continue with measurements or save the stored results by clicking on the Save Stored Samples button. Figure 11. 19 of 19 Maintenance Cleaning Picodrop spectrophotometers are designed to require a minimum amount of maintenance by the user. They can be cleaned using water or a mild laboratory-cleaning agent e.g. ethanol or general lab cleaner The instrument should not come into contact with aggressive solutions. Ensure that no liquid enters the spectrophotometers. For safety reasons, the device must be switched off and disconnected from the power supply prior to cleaning. ‘Quick Clean’ procedure for sample holder: In the event that sample leaks from a pipette tip or dust reduces the light transfer through the pipette holder simply unscrew the black cable fibres from each side of the silver pipette holder (no tools required – screw should be only hand tight). Unscrew the circular base from the tube section. Unscrew the single screw on the tube to release the main tube from the bottom tip holder. Either soak the holder in hot water with detergent for 30mins and air or drip dry or alternatively simply wash with an ethanol or similar solvent. Reassemble and retest instrument. 20 of 20 Trouble Shooting If you should obtain an unexpected erroneous result you should remove the pipette from the holder and immediately inspect the tip to check that the sufficient sample remains in the tip. The liquid column should be at least 2mm in height and should be continuous from the end of the tip - i.e. no air gap at the bottom. Leakage from the tip can occur if the tip is not securely attached to the pipette of if the end of the pipette tip is pushed against the side of the pipette holder when placing the tip in the location hole. Re-sample and check the liquid column in the tip both before and after sampling. If this is satisfactory and the result is still not good, increase the sample volume to say 3ul and do the visual checks before and after measurement. If results are not satisfactory follow the ‘Quick Clean’ procedure detailed on the previous page. If the results are still not good, then the following ‘service’ cleaning procedure should be adopted as detailed below: 1. Detach the Silver fibres by unscrewing from each side of the silver pipette holder. 2. Use the '1.5mm Allen' key (as supplied) to loosen the 2 fibres by turning the two sunken screws in the front of the bottom of part of the pipette holder and then pull gently the two lens holder screws from each side of the holder. 3. Check whether either lens, at the end of each cable, is wet. This happens when excess sample is picked up on the outside of the tips. 4. Wash each lens with pure water and dry with tissue. 5. Use a cotton tip soaked in acetone to clean and dry the lenses. 6. Remove the round base from the holder by unscrewing. 7. Thoroughly rinse the metal base unit in pure water and then allow to air dry. 8. Re-assemble unit and repeat tests as detailed above. 21 of 21