1
CONTENTS
Page
2
3
3
4
5
Section
Unpacking, Positioning and Installation
Essential Safety Notes
Symbols used in Manual
Keyboard
Display Panel
6
6
7
8
10
12
17
20
21
22
25
26
OPERATION
Introduction
Measurement modes
- Absorbance
- Concentration
- Nucleic Acids
- Reaction Rate
- Scan
- Transmission
Instrument Utilities
Print Out
Messages
28
ACCESSORIES
34
MAINTENANCE
39
APPENDIX
43
SPECIFICATION
Issue 05 - 01/2000
English
1
Unpacking, Positioning and Installation
r
Inspect the instrument for any signs of damage caused in transit. If any
damage, inform your supplier immediately.
r
Ensure your proposed installation site conforms to the environmental
conditions for safe operation :
Indoor use only
Temperature 10ο C to 40ο C
Maximum relative humidity 80 % up to 31οC decreasing linearly to 50%
at 40οC
r
The instrument must be placed on a hard flat surface, for example a
laboratory bench or table, which can take the instrument weight (13 kg)
such that air is allowed to circulate freely around the instrument.
r
Ensure that the cooling fan inlets and outlets are not obstructed; position at
least 2 inches from the wall.
r
This equipment must be connected to the power supply with the
power cord supplied and MUST BE EARTHED (GROUNDED). It can be
used on 100-240V supplies. The instrument rear panel is shown on the
inner back cover of this manual.
r
Switch on the instrument and check that the display works (see
OPERATION).
r
The instrument is delivered with a stored baseline. This is required to
correct for the wavelength/ energy profile of the light source. A new
baseline should be stored when a lamp is changed or if the instrument is not
used for a long time (several weeks); refer to Maintenance for details.
r
To enter laboratory name, operator name and/or instrument asset number
details at this stage, refer to Appendix, Entry of alphanumeric characters
for print out.
If this equipment is used in a manner not specified or in environmental conditions
not appropriate for safe operation, the protection provided by the equipment may
be impaired and instrument warranty withdrawn.
2
English
Issue 05 - 01/2000
Essential Safety Notes
There are a number of warning labels and symbols on your instrument. These are
there to inform you where potential danger exists or particular caution is
required. Before commencing installation, please take time to familiarise yourself
with these symbols and their meaning:
Caution (refer to accompanying documents).
Background colour yellow, symbol and outline black.
WARNING
WARNING
U.V. RADIATION IS HARMFUL
TO YOUR EYES
U.V. RADIATION
HOT
IF POWER IS RESTORED WITH
TOP COVER REMOVED, EYE
PROTECTION MUST BE WORN
Accessories - Care should be taken when handling all heated accessories.
- Ensure that the cell compartment lid is closed when operating cell
changers and the sipper.
- It is essential that the baseplate plug supplied with single cell
accessories is fitted to optimise air flow and prevent light ingress.
Symbols used in Manual
Please Note
∨
∨
∨
Display Panel
sample
Warning
Key Press
Key Press
Abs
Absorbance
λ
Wavelength
Insert cell containing
reference into cell
holder.
Issue 05 - 01/2000
∨
Insert cell containing
sample into cell
holder.
English
3
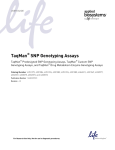
Keyboard
mode
4
5
6
wave
1
2
3
set ref
0
.
C
sample
run
stop
∨
9
∨
8
∨
7
∨
function
enter
print
Ignoring the numeric keypad, the keyboard is designed to be operated from top to
bottom and from left to right. Basic absorbance measurements are very easy to
make. In addition, a range of instrument utilities and instrument modes is accessible when the function or mode key is pressed; these options are described later.
∨
∨
Select measurement mode required using
∨ keys. Press enter
∨
mode
Select wavelength either from the numeric keypad or
by using
keys. Press enter
set ref
Set absorbance and transmittance readouts to 0.000 absorbance
units and 100 % T, respectively, on a reference solution.
sample
Select sample position in cell changer either from the numeric
keypad or by using
keys. Press enter
enter
Select options on the display.
run
Start measurements when operating from within the
measurement modes.
stop
Ends current programme.
function
Access to Set-up and Parameters.
print
Output information on the display panel to a parallel printer.
∨
∨
∨
∨
wave
4
C
Clears a numeric entry.
English
Issue 05 - 01/2000
Display Panel
The display panel has 20 characters divided up as indicated. Default start-up
values are shown, and represent a wavelength of 360nm in absorbance mode, with
cell position number 1 in the light path.
3 6 0
a
0 . 0 0 0
b
A
c
1
d
e
f
a)
Wavelength
Display of current wavelength in nm.
b)
Numeric Result
Display of absorbance, % T, concentration, absorbance ratio result.
c)
Unit of Measurement
Display of numeric result unit (A is Absorbance Units; %T is
% Transmission; C is concentration units).
d)
Mode of Operation
Display of instrument enhancement mode :
FC and SC are factor and standard concentration modes;
DNA, RNA, OLI are DNA, RNA, oligonucleotide quantification modes;
PRO is protein concentration mode;
RAT is absorbance ratio mode;
KNR is display of absorbance with time;
KND is display of change of absorbance with time;
SCN is scan to chart recorder.
e)
Temperature Indicator
Display of temperature status if a peltier heating accessory is in use.
ο
C is at temperature;
HI is over temperature or cooling down;
LO is under temperature or heating up.
f)
Sample Number
Display of sample number.
Issue 05 - 01/2000
English
5
OPERATION
Introduction
Your UV/Visible spectrophotometer is a simple to use, microprocessor controlled
instrument.
It works on the basis of light from either of the lamp sources being directed by a
motorised mirror through the monochromator inlet slit. This passes through one of
several (dependent on wavelength selected) filters mounted on a filter
quadrant; the filtered light is then directed onto the holographic grating which
produces light of the selected wavelength. The light then leaves the
monochromator via the exit slit, and mirrors focus and direct the light into the
sample compartment. This passes through your cell containing the sample of
interest and a defocussing lens to a solid state detector unit. The resulting signal is
then amplified and displayed.
Your spectrophotometer :
r
measures standard absorbance, concentration and transmittance.
r
has stored parameters for DNA, RNA and oligonucleotide quantification
and purity checking, as well as for protein contamination measurement in
nucleic acid solutions.
r
measures absorbance ratios.
r
measures change of absorbance with time and can either print the numerical
data or output the absorbance time plot to a chart recorder (synchronised).
r
outputs a wavelength scan to a chart recorder (asynchronous).
r
can be connected to a standard centronics parallel printer for output
of results.
r
can be linked to a PC via its serial interface and used with the
SWIFT range of software application programs operating in the Windows
environment.
A range of accessories further enhances the capability of the instrument.
6
English
Issue 05 - 01/2000
mode
Measurement Modes
Concentration
↔
←
FACTOR CONCENTRATION
STANDARD CONC
↔
←
Reaction Rate
∨
∨
mode
∨
RATE - RAW DATA
RATE - DELTA DATA
↔
Scan
∨
↔
Absorbance
∨
mode
Select from the table below with
∨
The mode key gives access to the 6 operational modes; these are linked in a
continuous loop. After pressing mode, use the arrow keys to move up/down/left/
right in the matrix shown below. Each mode is described subsequently.
∨
enter
NucleicAcids
←
DNA
RNA
OLIGO
PROTEIN IMPURITY
ABS RATIO
Transmission
←
SCAN TO RECORDER
∨
enter
to choose required measurement mode.
By pressing the mode button within a measurement mode the user
can return to the previous step of operation.
The instrument can be switched off at any stage of operation.
A flashing cursor indicates an option which is currently selected.
Issue 05 - 01/2000
English
7
mode
Absorbance
Absorbance mode is the default after power on. It is used to perform simple
absorbance measurements on samples, and it measures the amount of light that has
been passed through a sample relative to a blank (this can be air).
The procedure is to select the appropriate wavelength, insert blank and set
reference on it, remove the blank, and insert the sample(s). If sample is pressed
and cell position 2 selected, the display will show the wavelength used and the
absorbance and cell position of the sample in the light path. If run is pressed the
sample absorbance is measured and the cell changer rotated sequentially to the next
position; the display therefore shows the wavelength used, and the absorbance and
cell position of the next sample, since it is now in the light path. The advantage of
using run is that if a printer is connected and RUN PRINT in Setup selected, then
there is automatic print out of the absorbance details of the sample just measured.
Using
sample
with 2 samples
mode
360 0.000 A
1
enter
wave
Wavelength =
546 Set λ
enter
set ref
sample
546 0.000 A
1
remove blank
546 1.200 A
1
Absorbance of sample 1
cell
2
cell position ?
2
Absorbance of sample 2
=
546 1.412 A
Using
8
run
enter
with 2 samples
360 0.000 A
1
enter
wave
Wavelength =
546 Set λ
enter
set ref
546 0.000 A
1
remove blank
546 1.200 A
1
Absorbance of sample 1
run
546 1.412 A
2
Absorbance of sample 2
run
546 0.000A
3
cell position 3 empty
English
Issue 05 - 01/2000
to set absorbance to 0.000 AU on a reference solution at all
wavelengths in the mode selected. During a standard operating
procedure, the user is prompted to insert a cell containing reference
into cell holder, by the message set reference . This is displayed
until the reference is inserted and set ref is pressed.
run
to start making measurements; sample number (and cell position)
are automatically incremented after measurement.
stop
to stop making measurements or return to Absorbance mode.
sample
increments sample number (and cell position if cell changer is
fitted).
∨
set ref
The above and following sequences of instructions apply to the 6 cell changer
which is supplied with the instrument. There are different self explanatory displays
if a single cell holder or sipper is installed.
and
can be put in sequentially if a 6 cell changer is fitted.
Issue 05 - 01/2000
English
9
mode
Concentration
There are two concentration modes, Factor and Standard.
Factor Concentration mode is used when a conversion factor is known; this is
required to convert the absorbance measurement for a sample at a specific
wavelength to a concentration, by a simple multiplication of absorbance x factor.
Standard Concentration mode is used when a sample of known concentration is
available; by measuring the absorbance of this at a specific wavelength, the
conversion factor is calculated (see above), and this can be applied to other
samples of unknown concentration. This is equivalent to a one point calibration,
and assumes that a sample of zero concentration has zero absorbance.
FACTOR CONCENTRATION
Concentration of unknown = Absorbance x factor
mode
Set Wave =
360
Factor =
10.00
run
360 12.00 C
stop
360 1.200 A
Set λ
Factor
(0.01< 99999) ?
enter
enter
set ref
Set Reference
10
enter
FACTOR CONCENTRATION
FC
English
1
1
To show Abs reading
Issue 05 - 01/2000
STANDARD CONC
Concentration of unknown = Absorbance of unknown x Concentration of standard
Absorbance of standard
mode
STANDARD CONC
enter
Set Wave =
360
Set λ
set ref
Set Reference
Standard =
standard
unknown
run
enter
Concentration of
standard?
1.000
360 1.000 C
SC
1
360 0.800 C
SC
1
enter
Concentration of unknown
relative to standard
The calculated factor cannot be displayed.
Issue 05 - 01/2000
English
11
NucleicAcids
There are 5 modes for Nucleic Acid Quantification studies using absorbance
measurements at 260 and 280nm.
Mode
DNA
RNA
Oligo
Protein Impurity
Abs Ratio
DNA
Use
DNA quantification and purity checking
RNA quantification and purity checking
Oligonucleotide quantification and purity checking
Estimation of protein concentration in nucleic acid solutions
For general use, and for DNA, RNA and oligonucleotides if a
dilution factor is to be included
RNA
Oligo
Nucleic Acid Quantification
Concentration can be measured using absorbance at 260nm because it is
well established that a solution of DNA or RNA with an optical density of
1.0 (1.0 Absorbance Unit) has a concentration of 50 or 40µg/ml, respectively, in a
10mm pathlength cell*. Oligonucleotides, as a rule of thumb, have a
corresponding factor of 33µg/ml, although this does vary with base composition *.
Use Factor concentration mode if you wish to use a different factor.
Concentration = A λ260 * Factor
Nucleic Acid Purity Checking
Absorbance ratio can be used to establish the presence of impurities in a
sample preparation, relative to a pure sample. The two wavelengths of
interest to the Molecular Biologist are the absorbance maxima of the nucleic acid,
260nm, and the protein impurity, 280nm. A deviation from the expected
absorbance ratio of the two wavelengths for the pure substance indicates the
presence of impurity in the sample:
Absorbance ratio = Aλ260 / Aλ280
The A λ260 / Aλ280 absorbance ratio is known for the pure nucleotide (1.8 for pure
DNA, 2.0 for pure RNA), enabling rapid assessment of quality.
Background correction
A wavelength which is totally separate from these peaks, 320nm is sometimes
used to compensate for the effects of background absorbance due to, for
example, turbidity or high absorbance buffer solution.
Concentration =
(Aλ260 / Aλ320) * Factor
Abs ratio =
(Aλ260 - Aλ320) / (Aλ280 - Aλ320)
If your laboratory has not used background corrections before, set this option to
NO.
* Reference : Molecular Cloning, Maniatis et al.
12
English
Issue 05 - 01/2000
Summary
Nucleic Acid sample type
Factor, µg/ml
Aλ260 / Aλ280
ds DNA
RNA
Oligonucleotide
50
40
33
1.8
2.0
sequence dependent
Notes :
If you wish to use other factors, for example by incorporation of a dilution factor,
or other wavelengths, for example if the peak maximum is at 257nm or a
background wavelength at 350 nm, use Absorbance Ratio mode (ABS RATIO).
When using these modes with restricted aperture cells, for example the 7µl
ultramicrovolume cell, ensure that they are correctly filled by holding up to the
light. This is to avoid the possibility of beam clipping, and ensures that the results
obtained are reproducible.
Background compensation at 320nm is used to correct for high absorbance buffer
solution. It is also helpful if using low absorbance solutions in ultramicrovolume
cells.
If a printer is connected, the results, including absorbance values at 260,
280 and 320 nm (if selected), are printed out automatically. If a printer is
not connected, the absorbance values are displayed for a few seconds in turn
before showing the concentration and ratio results.
DNA
enter
DNA
Y/N
background?
∨
Background
∨
∨
Issue 05 - 01/2000
31.00 C
rat 1.750
enter
set ref
Set Reference
run
∨
mode
DNA
1 DNA concentration, µg/ml
DNA
1
English
A260/A280 ratio
13
RNA
enter
enter
RNA
Y/N background?
∨
Background
∨
mode
set ref
Set Reference
run
∨
28.00 C
rat 1.900
enter
RNA
1 RNA concentration, µg/ml
RNA
1
A260/A280 ratio
∨
OLIGO
enter
OLIGO
Factor =
33.000
Y/N
background?
∨
Background
enter
Factor?
∨
mode
set ref
Set Reference
run
∨
15.00 C
rat 1.600
OLI
1 Oligo concentration, µg/ml
OLI
1 A260/A280 ratio
USING A SINGLE CELL HOLDER ACCESSORY
A similar format is used for RNA and Oligo
∨
DNA
mode
DNA
enter
Insert Reference
enter
enter
Y/N
Background
set ref
Set Reference
run
∨
14
∨
enter
31.00 C
rat 1.750
DNA
1
DNA concentration, µg/ml
DNA
1
A260/A280 ratio
English
Issue 05 - 01/2000
PROTEIN IMPURITY
Protein Concentration in Nucleic Acids
For estimation of protein concentration in Nucleic Acid solutions, one can
automatically calculate the protein based on an equation derived by Warburg
and Christian for crystalline yeast enolase*. This uses absorbances at 280
and 260 nm, and is valid provided tyrosine and phenylalanine are present:
Protein (mg/ml) = 1.55*(Abs λ280 ) - 0.76*(Abs λ260 )
It is possible to calculate the coefficients in order to customise the equation
for a particular protein, by measuring absorbances at known concentrations
for both 260 and 280 nm; this generates a series of simultaneous equations
which need to be solved for x and y (the required coefficients). In cases
where x is calculated to have a negative coefficient, it should be set to zero;
a negative coefficient arises because there is no contribution to the protein
concentration due to the absorbance at 260 nm. The effects of background
absorbance can be compensated for, if required.
*
Reference : Warburg and Christian, Biochemisches Zeitung 310, 384 (1941).
Protein Conc =Factor 1 x (Abs λ280 - Absλ320) - Factor 2 x (Abs λ260 - Abs λ320 )
λ320 (background) is optional. Factors can be changed from defaults.
Set factor 2 = 0.00 for direct λ280 UV protein measurement. If BSA
(bovine serum albumin) is an acceptable standard, setting factor 1 = 1.115
will give linear results from 0 to 0.8 mg/ml.
enter
PROTEIN IMPURITY
Y/N background?
∨
Background
∨
mode
enter
Factor 1 =
1.550
Factor 1?
enter
Factor 2 =
0.760
Factor 2?
enter
set ref
Set Reference
run
Issue 05 - 01/2000
0.510 C PRO
1 Protein impurity (mg/ml)
English
15
ABS RATIO
DNA, RNA, Oligo modes will give quantification results in µg/ml directly if a
10mm pathlength cell and no dilution by using the conversion factors of 50, 40 and 33
respectively. To get results directly using a 5mm pathlength cell and/or a solution
which has had, for example, a 10 times dilution, the factor must be changed. To do
this, use Abs Ratio mode and set wavelengths accordingly.
If using 5mm pathlength cell, for DNA quantification, use Factor = 100
If using a 10mm pathlength cell for DNA quantification and 10 x dilution,
use Factor = 500
Wave 1 =
260 λ1 ?
enter
Wave 2 =
491 λ2 ?
enter
Background
Y/N
∨
If YES
enter
ABS RATIO
enter
Wave B =
320 λB ?
enter
Factor =
50.00
∨
mode
enter
Factor ?
set ref
Set Reference
run
∨
16
∨
rat 1.750
31.00
RAT
C
RAT
English
1 Absorbance Ratio
Concentration
1 [Abs at λ1 x Factor]
Issue 05 - 01/2000
Reaction Rate
Rate studies can be used to measure the change in absorbance of a sample
with time; a typical example is an enzyme kinetics reaction rate study at
340 nm. In this, the change in concentration of either one of the substrates
or one of the products of the reaction is monitored at a particular
wavelength. Another example is OD measurement in bacterial cell cultures at 600
nm.
Measurements such as absorbance (or concentration directly if an
appropriate factor is applied) as a function of time, either in minutes or
seconds, can be made with your instrument.
Delay time defines at what time into the assay the spectrophotometer starts
to collect data, thereby accounting for a lag phase.
Time Interval defines the time between each absorbance measurement.
Duration is the total length of time, including delay time if applicable, for
the assay.
The presentation of results can be either as actual absorbance (or
concentration) at each defined time interval/period (RAW DATA) or as
change of absorbance (or concentration) per unit time interval (DELTA
DATA). When DELTA DATA results are constant, the reaction is
proceeding at a linear rate.
RAW DATA results can be output to a chart recorder for a visual
interpretation of the change with time; both RAW and DELTA DATA can
be numerically output to a parallel printer.
Note that when in Rate Modes, data is sent as an ASCII stream to the serial
interface - this can be picked up by a PC with Windows installed. Use the
terminal emulator to pick up the datastream (settings are 19200 Baud, 1
stop bit, 8 data bits, 0 parity). After the reaction is finished, paste the results
into Excel and parse into separate column using Data>Parse command.
Issue 05 - 01/2000
English
17
display of actual absorbance with time (KNR).
RATE - RAW DATA
enter
RATE - RAW DATA
enter
sec/min
Seconds or Minutes?
Delay =
0
Delay Time (0≤ 999)?
enter
Interval =
1
Time Interval (1≤ 99)?
How much time including delay
(5*interval ≤10,000)?
enter
Chart off at end
Y/N
Factor =
1.000
600 0.375 A KNR
600 0.365 A
enter
enter
Factor?
enter
Set reference? If Yes
set ref
∨
Y/N
∨
Y/N
enter
∨
Chart post delay
Use chart recorder?
Start chart recorder after
delay?*
Stop chart recorder after
experiment?*
∨
Y/N
∨
Chart recorder
enter
∨
500
∨
=
Set reference
run
enter
∨
If NO
Set λ
Time unit
Duration
If YES
600
∨
Set Wave =
∨
mode
1
0 : 03 : 18
Display of raw absorbance * factor updated
every time interval.
* Output to the Amersham Pharmacia Biotech REC 101 chart recorder is
synchronised. Chart recorder cable (80-2105-95) is required. Suggested
chart recorder settings are 10mm/second, 200 mV full scale deflection
(output is 100 mV for 1.000 Abs unit), recorder on, zero suppress on zero,
set to internal.
The instrument will "beep" at every time interval if "sound is ON". To
change this, go to Set-up (See Instrument Utilities)
To abort an assay, press STOP.
It is not possible to perform parallel kinetics or multi samples, with this
mode. To do this, use the SWIFT -KIN software module which is
available for use on PC.
18
English
Issue 05 - 01/2000
RATE - DELTA DATA
600
sec/min
Seconds or Minutes?
enter
Delay =
0 Delay Time (0≤ 999)?
Interval =
1
Duration
=
Factor =
500
1.000
600 -0.010 A
Time Interval (1≤ 99)?
How much time including delay
(5*interval ≤ 10,000)?
enter
enter
enter
Factor?
Y/N Set reference? If Yes
600 0.375 A KND
enter
∨
Set reference ?
run
enter
∨
Time unit
Set λ
∨
Set Wave =
If NO
enter
RATE - DELTA DATA
∨
mode
display of change of absorbance with time (KND).
set ref
1
0 : 03 : 18
Display of absorbance difference * factor
updated every time interval.
The instrument will "beep" at every time interval if "sound is ON". To
change this, go to Set-up.
To abort an assay, press STOP.
Change in absorbance data can only be output to a parallel printer and not
to a chart recorder.
Issue 05 - 01/2000
English
19
Scan
An absorption spectrum can be obtained with your instrument by output to
chart recorder. Ensure chart recorder is connected, as scan data is not
visible without this. The Amersham Pharmacia Biotech REC 101 is recommended.
mode
enter
SCAN TO RECORDER
Start Wave =
360 Start λ?
enter
End Wave =
560 Finish λ?
enter
set ref
Set Reference
run
Scanning ....
Recorder at 500nm
560 0.209 A SCN
1
Chart position as scan is output
to recorder AFTER scan has
finished
Output to the Amersham Pharmacia Biotech REC 101 chart recorder is
asynchronous (the chart paper drive is controlled on/off
automatically). Chart recorder cable (80-2105-95) is required.
Suggested chart recorder settings are 10mm/second, 200 mV full scale
deflection (output is 100 mV for 1.000 Abs unit), recorder on, zero suppress
on zero, set to internal.
If you require post run data manipulation routines, the SWIFT-SCAN
software module is available for use on PC.
20
English
Issue 05 - 01/2000
Transmission
In transmittance mode the instrument measures the amount of light at the
specified wavelength that has passed through the sample and compares it
with that which has passed through the reference. This is displayed as a
percentage. The relationship between the concentration of the sample and
its transmittance at any given wavelength is not linear, and hence
transmittance mode is rarely used experimentally except for samples having
very high absorbances (low transmittances)
mode
Transmission
wave
Wavelength =
set ref
enter
546
Set λ
560 10.00 %T
1 remove blank
546 80.00 %T
1
Issue 05 - 01/2000
English
enter
21
Instrument Utilities
enter
Set a new DATE or TIME with
enter
↔
←
4090 V1.9 19960102
UV LAMP LIFE 27 H
VIS LAMP LIFE 27 H
TOTAL USE 27 H
BASELINE 19960102
DATE 19960102
TIME 11:16:32
LAB NAME
OPERATOR
INSTRUMENT
Set-up
↔
UV LAMP
NEW BASELINE
SAVE BASELINE
VIS LAMP
UV LAMP SAVE
SOUND
RUN PRINT
GLP PRINT OUT
RE-CALIBRATE
LAMP CHANGE AT
LOCK/UNLOCK
RESET LAMP LIFE
∨ ∨
Parameters
∨ ∨
Select On/Off and Y/N Options with
Service
This is reserved
for Service
Engineers
oo
∨
function
∨
Select from the table below with
∨
Settings which can be changed are stored until overwritten.
∨
enter
enter
enter
keypad
↔
Exit
←
Return to
absorbance
mode
Dates are shown in year, month, day format
22
English
Issue 05 - 01/2000
Parameters
Instrument parameters is a reflection of both the current instrument internal
parameters (EPROM version; lamp lives; date of baseline) and the user
definable documentation (time; date; laboratory; operator and instrument
names); this latter part should normally require one time user access only. All
parameters have battery back up.
4090 V1.9 19960102
UV LAMP LIFE 27 H
VIS LAMP LIFE 27 H
TOTAL USE 27 H
EPROM version and date of software
Indicates deuterium lamp usage in hours
Indicates tungsten lamp usage in hours
Indicates total instrument usage in hours
BASELINE 19960102
DATE 19960102
TIME 11:16:32
LAB NAME
OPERATOR
INSTRUMENT
Indicates date last baseline was run (saved or not)
Set current date in year, month, day
Set current time in hours, minutes, seconds
These are printed out, if GLP PRINT OUT is
set to Yes, for you to complete manually. Refer
to Appendix if you wish to enter your details
for printing out (page 41)
}
Set-up
Set up refers to instrument operating parameters, and include facilities for
switching lamps off, running a baseline, setting the instrument to work in GLP
mode, having automatic print on pressing RUN etc. These would normally be
set up one at a time, on different occasions, and once changed, the instrument
reverts to its default state (Absorbance measurement mode). Set up has battery
back up.
UV LAMP
Switch deuterium lamp on or off.
NEW BASELINE
Create a temporary baseline to correct for the wavelength/energy profile of the
spectrophotometers light source (s) (and reference if required). Ensure lamps
are warmed up (30 minutes for deuterium). A temporary baseline is lost at
instrument power down unless saved.
SAVE BASELINE
Save a temporary baseline to permanent memory. This can be the temporary
baseline created above.
VIS LAMP
Switch tungsten lamp on or off.
Issue 05 - 01/2000
English
23
UV LAMP SAVE
Cause instrument to power up and calibrate as usual, but then switch off the
deuterium lamp automatically (infrequent users of the UV range can benefit
from considerable increase in deuterium lamp life by use of this utility).
SOUND
Switch sound on or off when keyboard (and Sipper, if fitted) buttons are
pressed, and at intervals in Rate modes.
RUN PRINT
Prints what is currently shown on the display, sending it to the printer every
time RUN is pressed or when the display is updated (as in Reaction Rate).
GLP PRINT OUT
Print out a header at each calibration (or re-calibration) with information to
conform with GLP if a printer is connected (setting GLP to OFF does not
affect instrument calibration) - there is a 10 minute delay while the instrument
warms up. Pressing enter after calibration confirms that the instrument status
is acceptable. In addition, when run is pressed, the underlying readings and
results are printed out.
RE-CALIBRATE
Causes instrument to re-calibrate (see GLP PRINT OUT).
LAMP CHANGE AT
Set the cross over wavelength at which instrument changes from UV
(deuterium) to visible (tungsten) lamp; range is from 290 to 380 nm, default is
325 nm. Use only if there is critical detail at or around 325nm
∨
∨
LOCK/UNLOCK
Lock instrument into its current operating mode by entering a four digit
number. When instrument is locked, you can only cycle between Absorbance,
Locked Mode and % Transmission on using MODE
keys.
Unlock instrument from its current operating mode by entering the four digit
number used to lock it; if you forget the number, contact your local Technical
Specialist.
RESETS LAMP LIFE
Resets UV and/or visible lamp life to 0 hours when a new lamp is fitted and
creates new baseline. It also causes a reset of the maximum lamp energy, for GLP.
Service
Available for service engineer access only.
Exit
Returns instrument to normal operating condition, with new setup parameters in
place.
24
English
Issue 05 - 01/2000
Print Out
Your instrument will print out in 40 character format on any centronics compatible
parallel printer connected via the appropriate cable to the printer port on the rear
panel; simply press print
to print current display.
Set-up
∨
enter
RUN PRINT
∨
function
∨
a) Print instrument display every time it is updated or a measurement is run:
on/off
Example (Absorbance Ratio DNA)
concentration
ratio
31.00
rat
1.750
C
DNA
1
DNA
1
b) Print a header at the start of an experiment :
mode
print
for header print out on demand
Example (Absorbance Ratio DNA with GLP on)
Mode of use :DNA: concentration of DNA mode
DNA concentration = Abs 260nm * 50
units are: ug DNA / ml
DNA ratio Abs at 260nm / Abs at 280nm
GLP calibrated 19960917 at 15:12
GLP Calibration PASS
Instrument status accepted
Operator ................
Date 19960917
Time 12:03:50
rat
31.00 C
1.750
260
280
DNA
DNA
0.620
0.354
2
2
cell changer reset to cell 3
Issue 05 - 01/2000
English
25
Messages
The spectrophotometer goes through a multi step calibration sequence. If for any
reason the calibration is not completed satisfactorily, the messages displayed, if not
self explanatory, are either as follows or relate to a fault condition which requires a
service engineer from your local supplier. Other messages are displayed when an
accessory is installed.
Error Messages
Display
Possible Causes
Refer to Appendix
GLP Diagnostic Tests
GLP Calibration Fail
1pt
VIS calibrated
1pt
UV calibrated
Abs Non - Linear
(GLP on)
Remedy
Visible region only
calibrated
Check and replace
UV Lamp if necessary
UV region only calibrated
Check and replace
visible lamp if necessary
Instrument not at working
Let instrument reach
temperature
working temperature
Misalignment of filter quadrant Contact service engineer
Dirty Filters
Too much light
Too much light in sample
compartment
Close lid properly and
ensure baseplate plug
is in place (if relevant)
Beam Blocked !
Not enough light getting
to detector
Check light beam is
not blocked and cell
compartment empty
If using a sipper : remove
flowcell
Printer Error
RUN PRINT is ON, GLP
PRINT OUT is ON, printer is
off line or out of paper
Check printer state
No active printer
Connect or switch on printer
or deselect RUN PRINT
and GLP PRINT OUT
No Printer
26
English
Issue 05 - 01/2000
Heated accessory
unplugged
Temperature failed
Call Service
Plug in and/or press
sample
sample
Contact service engineer
and advise diagnostic
error code
E---
Waiting for GLP
Instrument warming up
Refer to Appendix
GLP Diagnostic Tests
< Min A
Abs value out of range
(<-3.OAU)
Detector seeing too
much light. Ensure
baseplate plug is fitted
Close lid properly
> Max A
Abs value out of range
(>+3.OAU)
Sample too concentrated. Something
blocking light path.
Vis mirror fail !
Detector did not see
enough energy during
calibration
Replace the visible
lamp
Accessory Messages
After installation of accessory, press
sample
sample
4 cell changer
4 position cell changer
6 cell changer
All 6 position cell changers
Single Cell Holder
All single cell holders,
except . . . .
Electric Cell
Electric Cell Holder
Thermostat holder
Peltier Cell Holder
Issue 05 - 01/2000
English
27
ACCESSORIES
All cell holders accommodate 10 mm pathlength cells as standard, unless stated
otherwise. Refer to Essential Safety Notes on page 3.
Multiple Cell Holder Accessories
Install by removing existing cell holder, replacing with the new one and turning the
central fixing screw until it is finger tight, followed by function Accessory
enter
4 position cell changer
80-2106-01
8 position water heated cell changer
80-2109-70
Accessory = 4 cell changer
Select automatic reference
Accommodates cells 10 - 50mm
pathlength.
Accessory = 8 cell changer
Select automatic reference
Requires a circulating bath.
Locate round extension of tube
restrainer into top of cell changer
thumb screw. O rings are to keep
tubing together. Replace front
blanking plug with that supplied after
threading tubes through it.
6 position Peltier heated cell changer
80-2106-04
Spare 8 position cell changer
80-2108-01
Accessory = 6 cell changer
Select automatic reference
Requires Temperature Control Unit
(80-2105-49).
Cell compartment socket 1
Accessory = 8 cell changer
Select automatic reference
28
English
Issue 05 - 01/2000
Single Cell Holder Accessories
Install by removing existing cell holder, replacing with the baseplate plug supplied
with the accessory, mounting so that the finger locks push backwards and the
arrow is on the front face, followed by:
sample
sample
Cell Holder, 10mm pathlength
80-2106-05
Cell Holder, 50mm pathlength
80-2106-07
Accessory = Single cell holder
Accessory = Single cell holder
Ultramicrovolume Cell Holder
80-2106-06
Microvolume Cell Holder
80-2106-09
Accessory = Single cell holder
Use with 5µl cell (80-2103-68) and
70µl cell (80-2103-69).
Use 2 axis adjust screws to obtain
maximum light throughput
Accessory = Single cell holder
Use with 50µl cell (80-2076-38)
Issue 05 - 01/2000
English
29
Cylindrical Cell Holder
up to 100mm pathlength
80-2106-10
Water Heated Cell Holder
10-40mm pathlength
80-2106-08
Accessory = Single cell holder
Accessory = Single cell holder
Requires circulation bath. Replace
front blanking plug with that supplied
after threading tubes through it.
HPLC Cell Holder
80-2106-11
Peltier Cell Holder
80-2106-13
Accessory = Single cell holder
Flowcell volume is 8µl
Pathlength is 2.5mm
Replace front blanking plug with that
supplied after leading the two tubes
through it.
Accessory = Thermostat holder
Set required Temp in range 20-49°C
using keypad.
Cell compartment socket 2.
Electrical Cell Holder
80-2106-12
Programmable Heated Cell Holder
80-2106-14
Accessory = Electric cell
Select temperature of OFF, 25, 30, 37°C
Cell compartment socket 2.
Accessory = Single cell holder
Temp range is 20-100°C
Used for Tm studies of DNA and
RNA denaturing. Requires PC and
Temperature Control Unit (80-210549). Cell compartment socket 1
30
English
Issue 05 - 01/2000
Other Accessories
Sipper
80-2106-15
The Sipper introduces either a sequence of samples for a single reading or a single
sample for a series of readings into the spectrophotometer. It is used together with
a single 10mm cell holder, either heated or non-heated. A flowcell together with
PTFE tubing and pump tubing is supplied with the Sipper. Separate user
instructions are supplied with the accessory.
Temperature Control Unit
80-2105-49
This is required to control the 6 position Peltier heated cell changer (80-2106-04)
and the Programmable Heated Cell Holder for Tm studies (80-2106-14).
Separate user instructions are supplied with the accessory.
Printer Stand
80-2106-60
Spare Baseplate blanking plug
80-2106-18
Spare dust cover
80-2106-19
Cell holder for 100mm pathlength
80-2107-14
Cell holder for use with magnetic stirrer
(magnetic stirrer required)
80-2108-10
Issue 05 - 01/2000
English
31
Lamps, Consumables and other items
Tungsten halogen lamp
Deuterium lamp
80-2106-16
80-2106-17
Pump head tubes (6) for Sipper
PTFE flowcell tubing with connectors
Replacement flowcell (including tubing)
Autosampler interface kit
80-2080-74
80-2055-13
80-2080-60
80-2104-96
Chart recorder cable
Recorder REC 101 single channel
80-2105-95
18-1001-42
Serial interface cable for connection to PC
(D9 male instrument to D9 PC)
80-2105-97
Serial interface cable for connection to PC
(D9 male instrument to D25 PC)
80-2106-51
Centronics parallel printer interface cable
80-2071-87
Separate information giving details on serial and parallel interface connections, if
required, is available from a Service Engineer with your local supplier, whom you
should contact for further details.
32
English
Issue 05 - 01/2000
SWIFT II Applications Software
SWIFT II comprises application modules for wavelength scanning, reaction
kinetics, quantification, multi wavelength, time drive and fraction analysis, and can
be used to enhance the software already included on the spectrophotometer.
Specific application packages consist of groups of modules for general analytical
purposes, biochemistry and molecular biology (SWIFT II - LAB), and for method
development and quality control (SWIFT II - METHOD).
80-2108-31 SWIFT II - LAB - for general analytical purposes
Wavelength scanning, Reaction Kinetics, Quantification, Time Drive
80-2108-31 SWIFT II - METHOD - for method development
Wavelength scanning, Reaction Kinetics, Quantification, Time Drive,
Multi Wavelength Fraction Analysis
Recommended PC for proper operation
For optimum performance, an IBM compatible 486 or greater personal computer
running Microsoft Windows 95 is required. The PC should have a minimum of
8MB RAM, 200Mb hard disk, a 1.44 MB 3.5 inch floppy disk drive, a serial
mouse installed, and free COMMS serial port and VGA graphics. Any printer
supported by Microsoft Windows 95 can be used. Contact your supplier for
further information.
Issue 05 - 01/2000
English
33
MAINTENANCE
After sales support - We supply support agreements which help you to fulfil the
demands of regulatory guidelines concerning GLP/GMP
o Calibration, certification using filters traceable to international standards
o Certificated engineers and calibrated test equipment
o Approved to ISO 9001 standard
Choice of agreement apart from break down coverage can include
o Preventative maintenance
o Certification
When using calibration standard filters, insert such that the flat surface is facing
away from the spring end of the cell holder
Observe all necessary precautions if dealing with hazardous samples or
solvents.
User maintenance is restricted to changing the instrument lamps and mains fuse.
For any other maintenance operation contact your local supplier.
34
English
Issue 05 - 01/2000
Lamp Replacement
Replacement lamps are available from your supplier using the following part
numbers:
Deuterium lamp
Tungsten lamp
80-2106-17
80-2106-16
(includes tungsten lamp as well)
The deuterium lamp is supplied fitted onto a plate; a new tungsten lamp is also
included.
Although deuterium lamps are covered by their own warranty, an
engineer’s call out fee is not, and users are advised to change their own
lamps. Lamp replacement is very easy, and the process has been
designed so that the user can do it without the need to call out a local
service engineer. No lamp alignment is required as the lamp select
mirror is automatically aligned for maximum lamp energy throughput
during the instrument calibration procedure.
The lamps become very hot in use. Ensure they are cool before
changing.
Do not touch the optical surfaces of either lamp with your fingers (use
tissue); if touched, the area should be cleaned with isopropanol.
Issue 05 - 01/2000
English
35
To replace a lamp proceed as follows:
1)
Switch off the instrument, remove sample from cell holder and disconnect
the power supply cord.
2)
Locate the lamp access cover on the left hand side of the instrument, push
down on the recess and pull the cover off.
3)
4)
Undo the fastening screw and remove the cover plate.
Slide the lamp plate out and unplug the cable connector.
p If the tungsten lamp has failed, the replacement should be inserted
onto the plate, pushing it all the way down into its holder.
p If the deuterium lamp has failed, insert the tungsten lamp onto the
plate as above and then replace the whole assembly with the new one.
5)
Reconnect the cable connector and slide the lamp plate in until it locates.
6)
Replace the black covering plate by re-tightening the fastening screw.
7)
Replace the lamp access cover.
8)
Reconnect the power supply cord and switch the instrument on.
9)
Reset lamp life to zero and take an original energy reading as appropriate
by:
Set-up
∨
RESET LAMPLIFE
enter
SAVE BASELINE Y/N
enter
∨
function
This is needed for your GLP PRINT OUT.
36
English
Issue 05 - 01/2000
Deuterium Lamp Warranty
Criteria for lamp replacement are that it must :
- be less that 15 months old AND
- have had less that 750 hours use.
Fuse Replacement
1)
Switch off the instrument and disconnect the power supply cord. The fuse
holder can only be opened if the power supply plug has been removed, and
is located between the power input socket and the on/off switch on the back
panel of the instrument.
2)
Slide open the fuse holder by pulling at the notch.
3)
Place fuses (2A, 5mm x 20mm, FST) into the fuse holder and slide back
into position.
4)
Reconnect the power supply cord and switch on the instrument.
Fuses are not normally consumed in an instrument's lifetime. If they blow
repeatedly contact your supplier.
Issue 05 - 01/2000
English
37
Cleaning and General Care
External cleaning :
r
Switch off the instrument and disconnect the power cord.
r
Use a soft damp cloth.
r
Clean all external surfaces
r
A mild liquid detergent may be used to remove stubborn marks.
Sample compartment spillages :
r
Switch off the instrument and disconnect the power cord.
r
The cell holders, baseplate and sample compartment are coated in a
chemical resistant finish. Strong concentration of sample, however, may
affect the surface, and spillages should be dealt with immediately.
r
Observe all necessary precautions if dealing with samples or solvents which
are hazardous.
r
There is a small drain hole in the sample compartment to allow excess
liquid to drain away. Liquids will drain onto the bench or table under the
spectrophotometer or if preferred, this drain hole can be connected to waste
using suitable tubing.
r
Remove the cell holder and clean separately.
r
Use a soft dry cloth to mop out the sample compartment. Replace the cell
holder.
r
Reconnect the power cord and switch on the instrument.
38
English
Issue 05 - 01/2000
APPENDIX
Good Laboratory Practice
Good laboratory Practice (GLP) concerns being able to trace experimental results
to an instrument, an operator and the time the result was obtained so that a laboratory can prove that the instrument was functioning correctly or not. Laboratory,
operator and internal instrument reference names can be entered on the
spectrophotometer
On calibration or re-calibration, the instrument checks the parameters and presents
the status for the customer’s acceptance prior to going into normal operation. If
GLP PRINT OUT is ON, a print out of the results of these tests is then done. The
date, time and operation are printed when parameters are printed. GLP requires that
the readings underlying any result shall be recorded, and GLP PRINT OUT is ON
performs this task automatically and prints the results.
GLP Diagnostic Tests
The integrity of the instrument for GLP purposes is quantified from :-
the calibration status of the instrument
the age and % energy of the lamps compared to their values when new
the wavelength accuracy by comparing to the 656nm deuterium line
the values of a built in absorbance filter compared to when the instrument was
manufactured (or last serviced by an accredited engineer).
the bandwidth at 656nm
the instrumental stray light
The expected values are given in parentheses on the GLP print out after calibration,
and the range of acceptance is defined in the technical specification of the
instrument.
In the unlikely event that the instrument fails calibration or goes out of
specification, a sequence of error messages will appear on the display, the final
message being "GLP CALIBRATION FAIL". These should be acknowledged
sequentially by pressing enter, and checking them with reference to the
MESSAGES section of the user manual. If a parallel printer is connected, doing so
will provide further information on the GLP print out.
The following should be checked :-
is the cell compartment lid closed properly
is a sample in the light beam - if so, remove it
is the baseplate plug in place (single cell accessory)
is the blanking plug at the front of the cell compartment in place
Issue 05 - 01/2000
English
39
Pressing enter after the message "GLP CALIBRATION FAIL" appears on the
display confirms that you have accepted the instrument status. This status does not
necessarily mean that the instrument cannot do the measurement required by the
protocol for your experiment, but having looked at the GLP print out you may wish
to contact your local service engineer for advice.
During calibration, if "GLP PRINT OUT" is on, the instrument will wait 10
minutes to allow working temperatures to be reached before completing
calibration. The display will show "Waiting for GLP"; press stop to abort
this if required.
40
English
Issue 05 - 01/2000
function
∨
Entry of alphanumeric characters for print out
Parameters
∨
LAB NAME
enter
OPERATOR
INSTRUMENT
When using the above utilities, the nature of the keyboard keys changes.
A title (40 characters maximum) made from an alphanumeric character string of
upper and lower case characters, numbers and punctuation marks may be entered.
abcdefghijklmnopqrstuvwxyz
,.; 1234567890-=/ \
ABCDEFGHIJKLMNOPQRSTUVWXYZ
<>: !@#'%^&*()_+? |
= space
∨
∨
∨
∨
∨ keys and selected using the
An individual character is chosen using the
PRINT key. The
key moves the cursor along the display. A complete name or
title is entered using the ENTER key.
Move cursor along the display
∨
Move within the character string
∨
mode
∨
Move to start of character string
("a")
wave
∨
Move 1/4 way down character string to
"x"
set ref
∨
Move 1/2 way down character string to
"A"
sample
∨
Move 3/4 way down character string to
"X"
function
print
enter
Delete the character at the cursor
Select the character at the cursor
Complete the alphanumeric entry
Issue 05 - 01/2000
English
41
GLP print out at instrument calibration (GLP PRINT OUT on) :
Example :
Laboratory
name
.................
Instrument Ref ..................
#
#
Ultrospec 2000 UV/Vis Spectrophotometer
Serial no
: 63035
Software
: 4090 V2.0 19951115
: Slave V1.7
Last serviced : 19960219
Instrument state at calibration
Calibrated 19960219 at 15:12
Calibration 2 point valid 190 - 1100nm
Bandwidth at 656nm
(3nm) : 2.6nm :
PASS
Wavelength (656nm) : 656.0nm :
PASS
Absorbance expected : read
at 220nm
(2.414) : 2.417 :
at 340nm
(1.986) : 1.992 :
at 500nm
(1.488) : 1.489 :
PASS
PASS
PASS
Stray light at220nm ( <0.025%T):
0.012%T :
PASS
UV Lamp : 101% of original energy
Vis lamp : 100% of original energy
*
*
Current instrument state
Accessory : six position cell changer
There are no reference readings made by the
cell changer
UV lamp... installed 19960219 at 10.03
total use 5 hours
baseline in use dated
19960219 at 15:01
stored baseline date
19960219 at 15:01
Vis lamp... installed
total use 41 hours
baseline in use dated
stored baseline date
19960320 at 10:03
19960219 at 15:02
19960219 at 15:02
The GLP and header print outs are obtained after instrument calibration, and
assumes a printer is connected and the GLP Print Out option is ON. The
instrument waits 10 minutes to allow the lamps to warm up properly.
# These are printed out for you to complete manually. See earlier if you wish to
enter your details for printing out.
* % of power of lamp measured at calibration relative to when the lamp life was
last set to zero.
42
English
Issue 05 - 01/2000
SPECIFICATION
Wavelength range
Monochromator
Spectral bandwidth
Wavelength accuracy
Wavelength reproducibility
Light sources
Detector
Photometric range
Photometric accuracy
Photometric reproducibility
Stability
Stray light
Analogue output
Digital output
Sample compartment size
Dimensions
Weight
Power requirements
Safety Standard
EMC emissions
EMC immunity
Mains harmonies
Susceptibility Standard
Quality System
190 - 1100nm
1200 lines/mmAberration corrected
concave grating
3nm
± 1nm
± 0.5nm
tungsten halogen and deuterium lamps
silicon photodiode
- 3.000 to 3.000A, 0.01 to 99999
concentration units, 0.1 to 200%T
± 0.5% or ± 0.003A to 3.000A, whichever is
the larger
within 0.5% of absorbance value
± 0.001A per hour at 340nm (tungsten lamp)
<0.025 %T at 220nm using NaI and <0.025
%T at 340nm using NaNO2
100mV per 1.000A
9 pin serial and Centronics parallel
210 x 140 x 80mm
500 x 360 x 190mm
13kg
90-265 V AC , ± 10%, 50/60Hz, 150VA
EN61010-1
EN 50 081-1 Generic emissions part 1
EN 50 082-1 Generic immunity part 1
EN 61000-3-2
IEC801
Designed and manufactured in accordance with
an ISO9001 approved quality system
Specifications are measured after the instrument has warmed up at a constant
ambient temperature and are typical of a production unit.
As part of our policy of continuous development we reserve the right to alter
specifications without notice.
Warranty
Your Supplier guarantees that the product supplied has been thoroughly tested to
ensure that it meets its published specification. The
warranty included in the conditions of supply is valid for 12 months only if the
product has been used according to the instructions supplied.
Your Supplier can accept no liability for loss or damage,
however caused, arising from the faulty or incorrect use of this product.
Biochrom Ltd, 22 Cambridge Science Park, Milton Road, Cambridge CB4 0FJ,
England.
Telephone: +44 1223 423723, Fax: +44 1223 420164
Issue 05 - 01/2000
English
43
44
English
Issue 05 - 01/2000