1
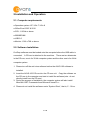
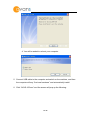
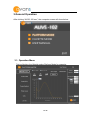
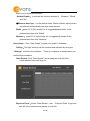
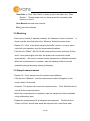
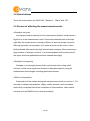
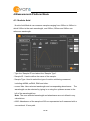
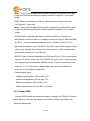
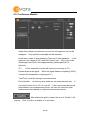
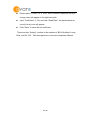
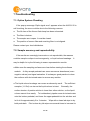
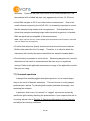
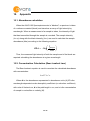
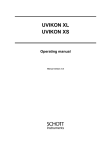
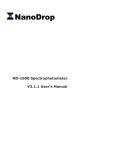
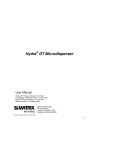
CuvDrop Micro-volume UV/Vis Spectrophotometer With Cuvette USER MANUAL Cat. No. : AUVS-102 SOFTWARE VERSION: AUVS-102 V1.1 1 / 39 Contents 1. Overview ................................................................................................... 4 1.1. Introduction ............................................................................................ 4 1.2. Structure ................................................................................................ 4 1.3. Measurements ....................................................................................... 4 2. Installation and Operation.......................................................................... 8 2.1. Computer requirements ......................................................................... 8 2.2. Software Installation. ............................................................................. 8 2.3. Precautions.......................................................................................... 11 3. General Operation ................................................................................... 12 3.1. Operation Menu ................................................................................... 12 3.2 Blanking ................................................................................................ 14 3.3 Sample measurement........................................................................... 14 3.4 Quick buttons ........................................................................................ 15 3.5 Factors of affecting the measurement results ....................................... 15 4. Measurement-Platform Mode .................................................................. 16 4.1. Nucleic Acid ......................................................................................... 16 4.2. Protein A280 ........................................................................................ 17 4.3. BCA ..................................................................................................... 19 4.4. Protein Bradford .................................................................................. 22 4.5. Protein Lowry ....................................................................................... 22 4.6. Cells..................................................................................................... 23 4.7. UV-VIS................................................................................................. 24 4.8. Fluorescent Dyes Measurement .......................................................... 26 4.9. Set up of the Calibration Parameters ................................................... 27 5. Measurement-Cuvette Mode ................................................................... 28 5.1. Conventional Module ........................................................................... 28 5.2. Continuous Module .............................................................................. 29 2 / 39 6. Check and Adjustment of Light intensity ................................................. 31 7. Troubleshooting....................................................................................... 33 7.1. Optics System Checking...................................................................... 33 7.2. Sample accuracy and reproducibility ................................................... 33 7.3. Unusual spectrum ................................................................................ 34 8. Maintenance and Warranty ..................................................................... 35 8.1. Cleaning .............................................................................................. 35 8.2. Parts that require replacements ........................................................... 35 8.3. Calibration of wavelength .................................................................... 35 8.4. Solvent Compatibility ........................................................................... 35 8.5. Decontamination of Measurement & Optical Surfaces ........................ 36 9. Specification ............................................................................................ 37 10. Appendix ............................................................................................. 39 10.1. Absorbance calculation...................................................................... 39 10.2. Concentration Calculation (Beer-Lambert Law) ................................. 39 3 / 39 1. Overview 1.1. Introduction CuvDrop is a full-spectrum spectrophotometer (200~ 900 nm) that measures 0.5μL sample with high accuracy and reproducibility. It utilizes a new sample retention technology that employs surface tension alone to hold the sample in place. No cuvettes or capillaries or other positioning instruments are required. It’s simple to operate and easy to clean by swiping with a laboratory wipe. Furthermore, CuvDrop can measure high concentration samples without dilution. Using this technology, CuvDrop has the capability to measure sample concentration up to 10,000ng/uL(absorbance 200Abs). CuvDrop has a built-in 37℃ thermostat that can be used to make time-based kinetic measurements under cuvette mode. 1.2. Structure Cuvette holder Quick button Power switch、 Upper platform USB port Pipetting pedestal 1.3. Measurements 1.3.1 Sample Retention Pedestal Measurements(Platform mode) 4 / 39 A 0.5 – 2.5μL(2μL is usually recommended) sample is pipetted onto the measurement pedestal. Press the button of either “Blank” or “Measure”. A pillar will protrude downwards and contact with the liquid sample causing the liquid to bridge the gap between the ends of the pedestal and pillar(please see the pictures below). CuvDrop can complete the measurement within 10 seconds. 1.3.2 Pedestal Sample Size Requirements Although sample size is not critical, it is essential that a liquid column is formed when using the pedestal option so that the path length between the upper and lower measurement pedestals is bridged with sample. The dominant factor determining the surface tension of a droplet is the hydrogen bonding of the lattice of water molecules in solution. Generally, all additives (including protein, DNA, RNA, buffer salts and detergent-like molecules) can reduce the surface tension by interfering with the hydrogen bonding between water molecules. Although 1μL volumes are usually sufficient for most sample measurements, increasing the sample size to 2μL will ensure proper column formation for samples with reduced surface tension. Field experience indicates that the following volumes are sufficient to ensure reproducibility: Aqueous solutions of nucleic acids: 2μL Purified protein: 2μL Bradford, BCA, Lowry or Protein Pierce 660 nm assays: 2μL Microbial cell suspensions: 2μL 5 / 39 It is best to use a precision pipettor (0-2μL) with precision tips to ensure that sufficient sample (1-2μL) is delivered. Lower precision pipettors(0-10 μL and larger) are not as good at delivering 1μL volumes to the measurement pedestal. If the user is unsure about the sample characteristics or pipettor accuracy, a 2μL sample volume is recommended. 1.3.3 Cuvette Measurements(Cuvette mode) CuvDrop will accept >3mm wide cuvettes and > 45mm tall cuvettes. When measuring samples using micro, semimicro, or ultra-micro cuvettes, we recommend using masked cuvettes. Masked cuvettes ensure that all light hitting the detector has passed through the sample. Unmasked cuvettes can allow light to hit the detector that has not passed through the sample. Expected differences between unmasked plastic cuvettes can lead to significant measurement error, especially at low concentrations. When measuring samples with analytical wavelengths in the UV (<340 nm), use cuvettes made of quartz, as these pass UV wavelengths. Although some manufacturers offer "UV-transparent" plastic disposable cuvettes, even the best of these are not transparent at wavelengths below 220 nm; most plastic and glass cuvettes block UV wavelengths entirely. Add the sample to the cuvette and ensure that the volume is sufficient(max. 300ul) to cover the light path. Insert the cuvette into the cuvette holder on the top of the machine. Press the button of either “Blank” or “Measure” to initiate a spectral measurement. 1.3.4 Cuvette Sample Size Requirements It is essential to ensure that the sample volume in the cuvette is adequate to allow the light to pass through a representative portion of the sample when making a measurement. The optical beam (2mm) is directed 8.5 mm above the bottom of the cuvette. Refer to the cuvette manufacturer for volume recommendations. CuvDrop has a built-in 37℃ thermostat that can be used to make time-based kinetic measurements. The Kinetics Editor is used to create, edit, save and view custom kinetic methods. The software does not support kinetics measurements using the pedestal mode. 6 / 39 1.3.5. Cuvette Protection Block Please remove the protection block of the cuvette slot when using the cuvette. Please put the protection block onto the cuvette slot when the cuvette is not in use. To the new instrument, the cuvette protection block is placed in the cuvette slot. 7 / 39 2. Installation and Operation 2.1. Computer requirements ● Operation system: XP / Win 7 / Win 8 ● Office Excel 2007 & 2010 ● CPU: 1.0GHz or above ● 200MB RAM ● USB 2.0 ● Monitor: 1366 x 768 or above 2.2. Software Installation. CuvDrop software must be loaded onto the computer before the USB cable is connected. A CD-rom is attached to the machine. There are two directories in the CD-rom, one is for 32-bit computer system and the other one is for 64-bit computer system. 1. Please turn-off the anti-virus software before the AUVS-102 software is installed. 2. Insert the AUVS-102 CD-rom into the CD-rom unit. Copy the software on the CD-rom to the computer and start to install the software(note : do not directly install from the CD-rom). 3. During the process of installation, the computer system will also install Microsoft .NET Framework4 and Microsoft visual C++. 4. Please do not install the software under “System Drive”, that is, C:Drive. 8 / 39 9 / 39 4. You will be asked to re-boot your computer. 5. Connect USB cable to the computer and switch on the machine, and then the computer will say “find new hardware” and automatically install. 6. Click “AUVS-102.exe” and the screen will pop up the following: 10 / 39 7. Please input the “20-digit serial number”, which is printed and stuck to the CD-rom, to the blank area as above. Then, you can start to use CuvDrop. 2.3. Precautions 1. Before the AUVS-102 software is installed in the computer, do not switch on the power(1 is on and 0 is off). And do not connect the USB cable to the computer. 2. Do switch off the power(0 is off) first before connecting or disconnecting the USB cable TO/OFF the computer. 3. Do not connect USB cable or do disconnect the USB cable to/off the computer either when booting or shutting down the computer. 4. Do turn off the power and disconnect the USB cable off the computer when AUVS-102 is not going to be used. 5. Do turn off the power and disconnect the USB cable off the computer before installing any kind of software in the computer. 6. The violation of all of the above precautions are deemed as misuse and not entitled to warranty. 7. The interval between each measurement must be more than 10~15 seconds. 11 / 39 3. General Operation After clicking “AUVS-102.exe”, the computer screen will show below : 3.1. Operation Menu Taking Nucleic Acid Module under Platform Mode for example : 12 / 39 Each icon is explained as below : □Button Enable: to activate the function buttons of “Measure”, “Blank” and “Up”. ☑Measure Auto Up: it is the default under Platform Mode, which means the pillar will automatically rise after measurement. Blank:pipet 0.5 -2.5μL(usually 2uL is suggested)blank buffer to the pedestal and then click “Blank”. Measure: pipet 0.5 -2.5μL(usually 2uL is suggested) sample to the pedestal and then click “Measure”. Save Graph:Click “Save Graph” to save your graph if necessary. Setting:The light intensity can be checked and adjusted by using the “Settings” module in the software. There is no sample is needed when you perform this procedure. Data Review: Click “Data Review” and a dialog box with all of the measurement values will pop up. Export to Excel:Under “Data Review”, click “Export to Excel” to get and view all of the measurement values in excel file. 13 / 39 Clear Data: Click “Clear Data” to clean up all of the data in the “Data Review”. Please make sure you have saved the necessary data before you click it. User Manual:browse user manual. Exit:leave the software 3.2 Blanking · Each time a module is opened (initiated), the “Measure” button is inactive. A blank must be done first before the “Measure” button becomes active. · Pipette 0.5~ 2.5μL of the blank sample (the buffer, solvent, or carrier liquid used with your samples) onto the measurement platform. · Click the icon “Blank”. AUVS-102 will measure the solution with both 0.5mm and 0.1mm path lengths, and then the system will record both results automatically. No need to re-blank unless samples are in different solutions. · When the measurement is complete, wipe the blanking buffer from both pedestals using a laboratory wipe(e.g.Kimwipe). 3.3 Sample measurement · Pipette 0.5~ 2.5μL sample onto the measurement platform. · Click the icon “Measure”, and the measurement result will appear on the screen within 10 seconds. · Autosave:The system will record the measurements. Click “Data Review” to see all of the measured values. · When the measurement is completed, wipe the sample from both pedestals using a laboratory wipe. · Repeat the measurement till all samples are measured. Click the button “Export to Excel” and all data would be exported into a new Excel table. 14 / 39 3.4 Quick buttons There are three buttons on AUVS-102, “Measure” , “Blank” and “UP”. 3.5 Factors of affecting the measurement results ● Samples carryover Any sample residue retained on the measurement platform would cause a slight error in the measurement result. Clean both pedestals with a lab wipe right after the measurement is usually sufficient to prevent sample carryover. Although generally not necessary, 2μL water aliquots can be used to clean both pedestals after particularly high concentration samples. After measuring a large number of samples, however, it is recommended that the areas around the upper and lower pedestals should be cleaned thoroughly. ● Samples homogeneity Samples in un-homogeneous solution, particularly when using small volumes, would cause significant deviation in data generated by using all measurement technologies including spectrophotometer. ● Effect of evaporation Evaporation of the sample during the measurement would account for 1- 2% increase in sample concentration. Highly volatile solvents, such as hexane, would likely evaporate before the completion of measurement. Less volatile solvents such as DMSO can be used successfully. 15 / 39 4. Measurement-Platform Mode 4.1. Nucleic Acid Nucleic Acid Module can measure samples ranging from 220nm to 340nm in which 260nm is the main wavelength, and 230nm, 280nm and 340nm are reference wavelength. · Type the “Sample ID” and select the “Sample Type”. · Sample ID : Used to define the name of the sample. · Sample Type: Used to select the type of nucleic acid being measured, including dsDNA, ssDNA, RNA and other. · xxxnm/ Abs: User-selected wavelength and corresponding absorbance. The wavelength can be selected by typing in or using the up/down arrows to the left of the wavelength box. Note: The user-selected wavelength and absorbance are not utilized in any calculations. · A260: Absorbance of the sample at 260 nm represented as if measured with a conventional 10 mm path. 16 / 39 Note : This is 10X the absorbance actually measured using the 0.5mm path length and 50X the absorbance actually measured using the 0.1mm path length. · A280: Sample absorbance at 280 nm represented as if measured with a conventional 10 mm path. Note : This is 10X the absorbance actually measured using the 0.5mm path length and 50X the absorbance actually measured using the 0.1mm path length. · 260/280: Ratio of sample absorbance at 260 and 280 nm. The ratio of absorbance at 260 and 280 nm is used to assess the purity of DNA and RNA. A ratio of ~1.8 is generally accepted as “pure” for DNA; a ratio of ~2.0 is generally accepted as “pure” for RNA. If the ratio is appreciably lower in either case, it may indicate the presence of protein, phenol or other contaminants that absorb strongly at or near 280 nm. · 260/230: Ratio of sample absorbance at 260 and 230 nm. This is a secondary measure of nucleic acid purity. The 260/230 values for “pure” nucleic acid are often higher than the respective 260/280 values. They are commonly in the range of 1.8~ 2.2. If the ratio is appreciably lower, this may indicate the presence of co-purified contaminants. · Concentration: ng/μL - dsDNA concentration= 260 nm Abs × 50 - ssDNA concentration= 260 nm Abs × 33 - RNA concentration= 260 nm Abs × 40 - Other concentration= 260 nm Abs × Constant 4.2. Protein A280 Protein A280 Module can measure samples ranging from 220nm to 340nm in which 280nm is the main wavelength, and 230nm, 260nm and 340nm are reference wavelength. 17 / 39 · Type the “Sample ID” and select the “Sample Type”. · Sample ID: Used to define a name of sample. · Sample Type: Used to select the type of protein being measured. - 1 Abs= 1 mg/ml: A general reference setting based on a 0.1% (1 mg/ml) protein solution producing an Absorbance at 280 nm of 1.0 A (where the path length is 10 mm). - BSA: Bovine Serum Albumin reference. Unknown (sample) protein concentrations are calculated using the mass extinction coefficient of 6.7 at 280 nm for a 1% (10 mg/ml) BSA solution. - IgG: IgG reference. Unknown (sample) protein concentrations are calculated using the mass extinction coefficient of 13.7 at 280 nm for a 1% (10 mg/ml) IgG solution. - Lysozyme: Lysozyme reference. Unknown (sample) protein concentrations are calculated using the mass extinction coefficient of 26.4 at 280 nm for a 1% (10 mg/ml) Lysozyme solution. - Other: User-entered mass extinction coefficient (L gm-1cm-1) for a 1% (10 mg/ml) solution of the respective reference protein. 18 / 39 · xxxnm/ Abs: User-selected wavelength and corresponding absorbance. The wavelength can be selected by typing in or using the up/down arrows to the left of the wavelength box. Note : The user-selected wavelength and absorbance are not utilized in any calculations. · A280: Sample absorbance at 280 nm represented as if measured with a conventional 10 mm path. · A260: Sample absorbance at 260 nm represented as if measured with a conventional 10 mm path. · A260/280: Ratio of sample absorbance at 260 and 280 nm · Concentration: mg/ml - Concentration (1Abs= 1 mg/ml) = A280× 10 - Concentration (BSA) = A280× 10/ 6.7 - Concentration (IgG) = A280× 10/ 13.7 - Concentration (Lysozyme) = A280× 10/ 26.4 4.3. BCA BCA Module can measure samples ranging from 400nm to 750nm. The default detecting wavelength is 562nm. 19 / 39 Taking the popular BCA kit for example, with reference to the kit protocol, prepare and allocate N(N≤7) standards depending on certain ratio. CW1is set as the detected wavelength(detected wavelength requested by the kit). AUVS-102 will measure and record the absorbance value of each sample. Building standard curve: Click the right-middle icon, “Calibration”, the following screen will show up. 20 / 39 In the left-hand side, there are 7 blank rows for the users to key in different absorbance and concentration values which simultaneously correspond to the X-Y axis diagram in the middle. The user can proportionately dilute their samples of known concentration and then measure their individual absorbance. The maximum rows for the user to key in is 7. After the user fills up all of the blanks, a simulated curve can be seen in the middle. Save Graph:Click “Save” to save the graph. Load: Click “Load” to find the previously saved graph. Confirm : After a loaded graph is selected, click “Confirm” to go back to the ”Protein BCA” module. At this moment, the icon of “Calibration” in the right middle will be brightened. A graph can be previewed under the icon of “Calibration”. Click the icon of “Calibration” again, the screen will exit the screen of building standard curve. After the standard curve is set up and plotted, when the user measures the same-type samples, the fields of “CW” and “Conc” in the right part will automatically show the corresponding absorbance value and concentration of the same-type samples. 21 / 39 4.4. Protein Bradford The wavelength range for Bradford is between 575nm and 750nm. 575nm(wavelength 1) is the main wavelength. The default wavelength in the software is 595nm and 725nm. The user can select his own wavelength. Taking the popular kit of Protein Bradford for example, with reference to the kit protocol, prepare and allocate N(N≤7) standards depending on certain ratio. CW1is set as the detected wavelength(detected wavelength requested by the kit). AUVS-102 will measure and record the absorbance value of each sample. The way of building standard curve is same as Protein BCA. 4.5. Protein Lowry The wavelength range for Protein Lowry is between 400nm and 750nm. The default wavelength in the software is 650nm and 725nm. CW1, 650nm, is the main wavelength. The user can select his own wavelength. 22 / 39 Taking the popular kit of Protein Lowry for example, with reference to the kit protocol, prepare and allocate N(N≤7) standards depending on certain ratio. Wavelength 1 is set as the detected main wavelength(detected wavelength requested by the kit). AUVS-102 will measure and record the absorbance value of each sample. The way of building standard curve is same as Protein BCA and Protein Bradford.. 4.6. Cells The “Cells” module displays the sample spectrum from 200 nm to 850 nm. Two cursors can be set to the wavelengths of interest. The user can select his own wavelength. 23 / 39 AUVS-102 will measure each sample with both 0.5mm and 0.1mm path lengths, and then automatically pick the appropriate one to normalize to a 1 mm path. The results will show in the fields of “CW1” and “CW2”. The way of building standard curve is same as Protein BCA and Protein Bradford. After the standard curve is set up and plotted, when the user measures the same-type samples, the fields of “CW” and “Conc” in the right part will automatically show the corresponding absorbance value and cell density of the same-type samples. 4.7. UV-VIS The “UV-VIS” module allows the AUVS-102 to function as a conventional spectrophotometer. Sample absorbance is displayed on the screen from 200 nm to 850 nm and cursors permit the measurement of individual peaks. 24 / 39 · Sample ID: Used to define a name of sample. · 0.5mm curve: Show the curve of absorbencies measured by 0.5mm path length(in blue color). · 0.1mm curve: Show the curve of absorbencies measured by 0.1mm path length(in yellow color). · CW1: User-selected wavelength and corresponding absorbance. The wavelength can be selected by typing in or using the up/down arrows to the left of the wavelength box. The absorbance is related to the curve that selected to show. · CW2: User-selected wavelength and corresponding absorbance. The wavelength can be selected by typing in or using the up/down arrows to the left of the wavelength box. The absorbance is related to the curve that selected to show. 25 / 39 You can choose to display the curve of 0.5mm, 0.1mm, or both curves. Note: If both curves are shown, the absorbance and the curve showed on the screen are related to 0.5mm path. Data Review : Click “Data Review”, each corresponding absorbance value of ranging from 200nm to 850nm can be exported to an excel file. There is also function of building standard curve in UV-VIS module. The way is same as Protein BCA and Protein Bradford. 4.8. Fluorescent Dyes Measurement The “UV-VIS” module of AUVS-102 can be used to measure the absorbance of fluorescent dyes as well. It can eliminate potentially flawed sample and improve research effectiveness in microarray application. Based on the general form of the Beer-Lambert equation, you can calculate fluorescent dye concentrations with the measured absorbance. The table of extinction coefficients for each dye is below: Dye Type Extinction Coefficient Measurement (liter/ mol-cm) Wavelength (nm) Cy3 150000 550 Cy5 250000 650 Alexa Fluor 488 71000 495 Alexa Fluor 546 104000 556 Alexa Fluor 555 150000 555 Alexa Fluor 594 73000 590 Alexa Fluor 647 239000 650 Alexa Fluor 660 132000 663 Cy3.5 150000 581 Cy5.5 250000 675 26 / 39 4.9. Set up of the Calibration Parameters There is “Parameter Setting” function in the AUVS-102 software pack. The user can use this function to calibrate the measurement values. K1 is the calibration parameter of low absorbance value (smaller than or equal to 10Abs(10mm)). It is recommended to use 4~8Abs(10mm) standard sample or so for calibration, e.g., double strand DNA 250ng/ul. K2 is the calibration parameter of high absorbance value (bigger than 10Abs (10mm)). It is recommended to use 20~40Abs (10mm) standard sample or so for calibration, e.g., double strand DNA 1000ng/ul). When you click “load” icon, you can find the original parameter for this UVS-99. For example, when AUVS-102 is used to measure certain standard sample and the real sample value is 100, however, the measured value is 80, lower then 100. Then the user can change the calibration parameter to 100/80=1.25. Note:Because the calibration parameters of each AUVS-102 are all different, please do take into account the original K parameter before editing the K parameter. Taking the above case for example, if the original K parameter is 0.9, then the new K parameter should be 0.9*100/80 = 1.125. 27 / 39 5. Measurement-Cuvette Mode 5.1. Conventional Module Conventional Module is very similar to the UV-VIS Module in Platform Mode. The light paths in UV-VIS module are 0.5mm and 0.1mm, however, the light path in Cuvette Module is 10mm. This is the biggest difference between them. The minimum volume of the standard cuvette is 300ul. Due to the different light path, compared to Platform Mode, the result will be with better precision and reproducibility if the measurement range of the Cuvette Mode is between 0.01~2 Abs. 28 / 39 5.2. Continuous Module Under this module, the detection curve of the full spectrum will not be displayed. Only specific wavelength will be detected. In the above chart, X-axis stands for Time and Y-axis stands for. In the right part, the values of CW1 and CW2 can be set. CW1 is the main wavelength and CW2 is the supplementary wavelength(CW2 is optional). 37℃: to tick means the cuvette will heat up to and stay at 37℃. Please observe the signal. When the signal flashes completely(100%), it means the temperature is staying at 37℃. Total Time: to set the timing for measurements. Point Number: to set the points within the set measurement time. It can only be input as 10, 20, 30, and 40. If the user knows the interval time between two measurement points, the user can count the total measurement time based on required measurement points. :After setting the point number, the icon of “Confirm” will pop up. Click “Confirm” to display X-Y axis chart. 29 / 39 Do blank first, then add sample and start measuring. The software will display each measurement point in real time. Click “Stop” button to re-start. 30 / 39 6. Check and Adjustment of Light intensity If an “un-smooth” or “ragged” absorption spectrum still appears after cleaning both pedestals, you should check the light intensity. checked and adjusted by using the module of the software. The light intensity can be (Setting) function in each There is no sample needed when you perform this procedure. The reproducibility of light intensity can be checked according to the spectra. If all intensity spectra nearly coincide, it indicates that the instrument works well with high reproducibility. The light intensity should be kept within 100~ 3500 for better reliability and stability, though the detection limit of intensity is 10 for AUVS-102. The intensity spectrum should be close to the reference spectrum and slightly lower. Below is the “Setting” screen of “Nucleic Acid Module” and “Protein A280 Module”. 31 / 39 Please select “0.5mm” or “0.1mm” and a reference spectrum curve(in orange color) will appear in its right-hand side. Input “Coefficient” (1~20) and click “Read Data”, the actual spectrum curve(in blue) color will appear. Click “Save” to save the set coefficient. There are also “Setting” function in the modules of BCA, Bradford, Lowry, Cells, and UV-VIS. But their spectrum curves are completely different. 32 / 39 7. Troubleshooting 7.1. Optics System Checking If the pop-up message “Optic signal error” appears when the AUVS-102 is self checking, the error could be due to the following reasons: ● The life time of the Xenon flash lamp has been exhausted. ● The fiber is broken. ● The sample arm is open. It must be closed. ● The position of source fiber and receiving fiber is not aligned. Please contact your local distributors. 7.2. Sample accuracy and reproducibility If the results are seemingly inaccurate or not reproducible, the reasons could be sample or aliquot non-homogeneity, or liquid column breakage. It may be helpful to try the following to ensure representative results: ● Make sure the sampling surfaces are clean before starting the software module. A dirty sample pedestal can cause erroneous absorbance (even negative values) and signal saturation. It is always a good practice to clean the surfaces with de-ionized water to remove any residue. ● The liquid column breakage can cause an abnormity result. The sufficient samples (1~2.5ul) can insure the liquid column is intact. Generally, the surface tension of protein solution is lower than other solution, so the liquid column cannot form easily. To troubleshoot, pipette some de-ionized water onto the bottom pedestal, and lower the upper pedestal into the solution and let it sit for approximately 2 to 3 minutes. Wipe with a clean lab wipe to dry both pedestals. Fold a clean dry lab wipe over several times to increase its 33 / 39 thickness. Press the lab wipe firmly down on the lower pedestal and “rub" the pedestal with a folded lab wipe very aggressively at least 15- 20 times. ● Heat DNA samples to 55°C and vortex before measurement. Due to the small volumes required by the AUVS-102, it is extremely important to ensure that the sample being measured is homogeneous. Field experience has shown that samples containing large molecules such as genomic or lambda DNA are particularly susceptible to this phenomenon. Note: Larger volumes used by cuvette-based spectrophotometers will minimize or mask the effect of sample non-homogeneity. ● Confirm that reference (blank) solution and solvent are the same material. Buffers often absorb in the UV range. Therefore, it is critical to blank the instrument with exactly the same material that the sample is suspended in. ● Confirm that your sample is not too dilute. Measuring samples at or near the detection limit will result in measurements that can vary in a significant amount. Refer to the applicable measurement range of the application module that you are using. 7.3. Unusual spectrum A sample that exhibits jagged absorption spectrum, but a normal shape, may be the result of detector saturation. This can be due to a dirty sample pedestal upon startup. Try cleaning both sample pedestals thoroughly, and restarting the software. A spectrum that is very “un-smooth” or “ragged” can also be caused by insufficient light intensity reaching the spectrometer. If you suspects that this is occurring, please refer to Section 6. Check and Adjustment of Light Intensity and adjust the intensity coefficient. 34 / 39 8. Maintenance and Warranty 8.1. Cleaning To prevent sample carryover, the most important thing is to keep the sampling arm and measurement pedestal clean. Upon completing each sample measurement, wipe the sample from both the sampling arm and measurement pedestal simply using an ordinary dry laboratory wipe. A final cleaning of both pedestals with de-ionized water is also recommended after the user’s last measurement. 8.2. Parts that require replacements In general, the only part that should periodically require replacement is the flash lamp. The flash lamp theoretically can last a minimum of 300K measures. There is no way to test the flash lamp to confirm its remaining life. When the flash lamp fails, the light output will become very erratic or stop altogether. Please contact your local distributor if this happens. 8.3. Calibration of wavelength The wavelength is auto-calibrated based on known peaks in the xenon lamp spectra each time the software is started. No calibration is required under normal use; please contact your local distributor if needed. 8.4. Solvent Compatibility The UVS-99 is compatible with most solvents typically used within sample solution in life science laboratories. However, all forms of Hydrofluoric Acid (HF) are incompatible, as the fluoride ion will dissolve the quartz fiber optic cable. 35 / 39 8.5. Decontamination of Measurement & Optical Surfaces If decontamination is necessary, a sanitizing solution, such as a 5.25% solution of sodium hypochlorite (freshly prepared bleach), can be used to ensure that no biologically active material is present on the measurement pedestals. The metal sample pedestals are made from stainless steel and are resistant to most common laboratory solvents. 36 / 39 9. Specification Minimum Sample Size 0.5μL Sample Number 1 Path Length 0.5mm (auto-ranging to 0.1 mm) Light Source(s) Xenon flash lamp Detector Type 3072- element linear silicon CCD array Wavelength Range 200 - 850 nm Wavelength Accuracy 0.3nm AUVS-102 1.3nm(FWHM at Hg546nm) Absorbance Precision 0.003 (1 mm path) Absorbance Accuracy 2% (at 0.74 at 257 nm) Absorbance Range 0.04 - 200 (10 mm equivalent) Detection Limit 2 ng/μL (dsDNA) Maximum Concentration 10,000 ng/μL (dsDNA) Measurement Time < 10 seconds Footprint 10x 22cm Weight 3 kg Sample Pedestal Material of Construction 316 stainless steel and quartz fiber Operating Voltage 12 vdc Operating Power Consumption 12 - 18 W Standby Power Consumption 5W Software Compatibility Windows 7 (32 bit and 64 bit), Windows Vista (32 bit), Windows XP (32 bit) Cuvette specifications Z-Height 10 mm Heating 37 ± 0.5 °C 37 / 39 Path Length 10mm Absorbance Range 0.005 - 2 Detection Limit 0.4 ng/μL (dsDNA) Maximum Concentration 100 ng/μL (dsDNA) Measurement Time <3 seconds Cuvette Dimensions 12.5 mm x 12.5 mm, up to 48 mm H Type Masked cuvette 38 / 39 10. Appendix 10.1. Absorbance calculation When the AUVS-102 Spectrophotometer is “blanked”, a spectrum is taken of a reference material (blank) and stored as an array of light intensity by wavelength. When a measurement of a sample is taken, the intensity of light that has transmitted through the sample is recorded. The sample intensity (Isample) along with the blank intensity (Iblank) are used to calculate the sample absorbance (Abs) according to the following equation: Isample Ab s log I blank Thus, the measured light intensity of both the sample and of the blank are required calculating the absorbance at a given wavelength. 10.2. Concentration Calculation (Beer-Lambert Law) The Beer-Lambert equation is used to correlate the calculated absorbance with concentration: A=E*b*c Where A is the absorbance represented in absorbance units (A), E is the wavelength-dependent molar absorptivity coefficient (or extinction coefficient) with units of liter/mol-cm, b is the path length in cm, and c is the concentration of sample in moles/liter or molarity (M). 39 / 39