1
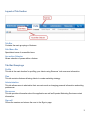
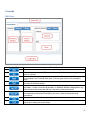
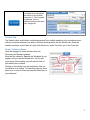
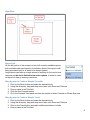
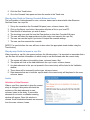
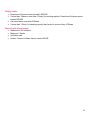
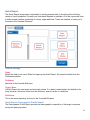
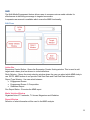
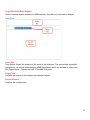
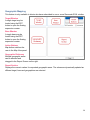
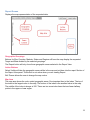
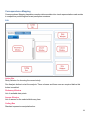
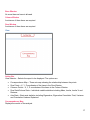
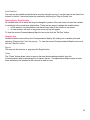
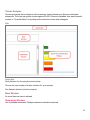
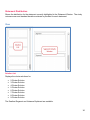
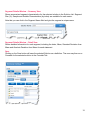
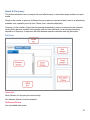
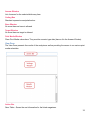
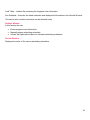
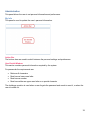
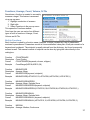
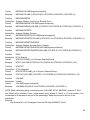
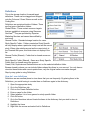
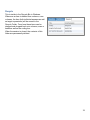
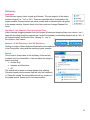
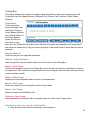
Simmons OneViewSM
User Guide
__________________________
Overview of Simmons OneView
3
Accessing the Application
3
Sign-in
4
User Types
4
Layout of Tab Screen
5
Tab Bar Groupings
5
Crosstab
6
Quick Report
11
MME
12
GeoMapping
14
Correspondence Mapping
16
Cluster Analysis
20
Reach and Frequency
22
Administration
25
Functions: Average, Count, Volume, N-Tile
27
Definitions
30
Recycle
32
Dictionary
33
Coding Box
34
FAQ
36
2
Overview
Simmons OneViewSM is an innovative decision-making system that serves as the primary platform for
providing marketers with access to the entire Simmons product suite and proprietary analytic tools.
Simmons OneView provides marketers with around-the-clock access to the vivid consumer insights
that they depend on from Experian Marketing Services through a secure, online delivery platform.
With Simmons OneView advertisers, agencies and media owners will be able to:
Profile: Instant profile reports, comprehensive data-mining and crosstabs provide you with in-depth
understanding of consumer targets enabling you to make data-driven marketing decisions quickly and
confidently.
Plan: Plan cross-media and messaging strategies with built-in analytic tools, including reach and
frequency reports, correspondence mapping and geographic analysis.
Measure: Close the loop on marketing activities by measuring campaign and ad effectiveness with
weekly updates on nearly 60,000 consumer data elements via Simmons DataStreamSM (additional
license required).
Know: Dashboards and automated alerts keep you up-to-date on the latest consumer trends letting
you know when market conditions change so that you never miss an opportunity to act.
Take Control: Intuitive features and role-based access serve the insight needs of everyone in your
organization, from the savviest analyst to the on-the-go sales executive, bringing into focus the
information necessary to accomplish the task at hand.
Accessing the application
Simmons OneView is available as a Web application. In order to access Simmons OneView, you
need a modern browser with the Adobe Flash 10 plug- in installed. Simmons OneView has been
tested to work on the following browsers:
• Microsoft Internet Explorer 7
• Microsoft Internet Explorer 8
• Mozilla Firefox 3.5.2
We have also performed some preliminary tests on the following browsers but are not yet ready to
certify them as working:
• Google Chrome 10 or higher
• Opera 11
• Safari 5
• Rockmelt
• Maxthon 3
• SpaceTime 1
Screen resolutions of 1024 x 768 or higher are recommended. Lower resolutions will work (as may be
needed for projectors) but will require screen scrolling.
3
Sign-In
https://oneview.experian.com
Simmons OneView requires users to sign into the system using unique usernames and passwords.
These credentials will come from either your Experian Marketing Services Client Service Account
Manager or from your local Client Administrator. The first password you receive will be a temporary
password and must be changed on first sign-in. It is important to set up a challenge question so that
in the future if you forget your password, you can generate a new one without needing outside
assistance.
FAQ: Where do I get my username and password?
Your username is your email address. Your password will come to you in an email once you are set
up in the system by your Client Administrator.
FAQ: What if I forget my password?
There is a Forgot Password feature on the sign-in page. Prior to using it you need to have configured
your challenge question. Otherwise you will need to contact your Client Administrator.
FAQ: The system says I am locked out; what do I do?
If you attempt to enter too many incorrect passwords in a row, the system has a security feature to
lock you out. There is a Locked Out? feature that can unlock your account, otherwise you can contact
your Client Administrator to unlock your system.
User Types
There are two main types of users in Simmons OneView: General User and Client Administrator.
General User - Common user type. Must be assigned a seat to assess specific functions and
studies.
Client Administrator - A person at the client site who is responsible for setting up users and
controlling assignment of users to seats.
4
Layout of Tab Section
Tab Bar
Contains the main groupings of features
Sub-Menu Bar
Specialized menu of accessible items
Accordion Selector
Allows selection of panes within a feature
Tab Bar Groupings
Profile
This tab is the main location for profiling your clients using Simmons’ rich consumer information.
Plan
This tab contains features allowing clients to create marketing strategy.
Administration
This tab allows users to administer their accounts such as changing personal information and setting
preferences.
Resources
This tab provides information about the application as well as Experian Marketing Services contact
information.
Sign-off
Closes the session and returns the user to the Sign-in page.
5
Crosstab
Edit Pane
Action Bar Button
Description
Opens a saved crosstab; will first clear any existing crosstab prior to loading.
Saves the current crosstab; There must be a crosstab title and something in either
rows or columns.
Executes the crosstab and exports the results to an Excel or .csv file. The crosstab
is not placed in the Crosstab View pane. This is a good choice if the crosstab is
large.
Clears everything in the Crosstab Edit pane except for the selected study. It also
removes all the trend studies.
Imports a Simmons OneView .spc file containing the configuration for rows, columns
and bases. It does not set the target study. A validation window is displayed for any
data elements being imported that are not present in the current study.
Creates a .spc file containing configuration information for rows, columns and bases
for importing into Simmons OneView by any user. It does not store the study
information.
Opens a window where the target study can be selected.
Opens a window where multiple studies can be selected for trending. Note that the
top study is always the current study.
6
Executes the current
crosstabor trend and places
the results in the Crosstab
View pane. If “Run Crosstab”
is displayed, then no
additional trend studies have
been configured.
Scratch Tab
The Scratch tab is useful when combining answers from multiple questions into a combined count
coding. Locate the answers you wish to combine and drag them into the Scratch tab. Once the
answers are there, select them all, right click the mouse, select Functions, go to the Count tab.
Rows, Columns, Bases
Items are dragged to these windows from the
Dictionary and Answer windows.
Note that the values for Sample and Weighted do not
appear until you use the Reload icon. As you add
more items to the window, you will need to click on
this reload icon to refresh.
Clicking on the Delete icon will completely clear out
the window of all entries. To selectively remove items,
select one or more of them and use the Delete key on
your keyboard.
7
View Pane
Report List
On the left portion of the screen is a list of all currently available reports,
both crosstabs and trend reports. An indicator shows if the report is still
being processed (red) or is ready to be viewed (green).
Large reports can take up a large amount of memory on the user’s local
computer so this list is limited to ten active reports. It is best to close
old reports to free up memory resources.
Step-by-step to Create a Simple Crosstab
1.
2.
3.
4.
5.
Click on the Study button and select the desired study
Using the dictionary, drag and drop some items onto Rows and Columns
Enter a name in the Title field
Click the Run Crosstab button
Go to the Crosstab View pane and view the results in either Crosstab or Private Eye view
Step-by-step to Create a Simple Trend
1.
2.
3.
4.
Click on the Study button and select the desired study
Using the dictionary, drag and drop some items onto Rows and Columns
Click on the Trend button and select additional studies to include
Enter a name in the Title field
8
5. Click the Run Trend button
6. Go to the Crosstab View pane and view the results in the Trend view
Step-by-step Guide to Sharing Crosstab Between Users
The configuration of data elements in rows, columns, bases can be shared with other Simmons
OneView users via a .spc file.
1.
2.
3.
4.
5.
6.
7.
Set up the crosstab in the Crosstab Edit pane (rows, columns, bases, title)
Click on the Export .spc button; the system will place a file on your local PC
Send this file to whomever you wish to share
The receiving user must first use the Clear button to clear their Crosstab Edit pane
The user will select the appropriate study (the study is not saved in the .spc file)
The user can use the Import .spc button to import the crosstab settings
The user can then execute the crosstab
[NOTE: For trend studies, the user will have to also select the appropriate trend studies using the
Trend button]
Step-by-step Guide to import a .spc file
When importing a .spc file, the system performs the following steps. It is important to remember that a
.spc file does not contain information on which study to use and instead uses the current study.
1. The system will clear out everything (rows, columns, bases, title)
2. The system will look at the data elements in the .spc’s rows, columns, bases.
3. Any data elements in the .spc not present in the current study will be listed in the Validation
window.
4. These items will be removed from the rows, columns, bases.
5. Data elements that are in both the .spc file and in the current study will be placed in the rows,
columns, bases.
Limits
Validation of Data Elements
When a .spc file is imported or when the current
study is changed, the system will check the
existence of the data elements in rows,
columns, bases in the study. If some data
elements do not exist, a validation warning
window will appear. Once this window is
cleared, those listed data elements are removed
from the rows, columns, bases.
9
Display Limits
• Rows times Columns cannot exceed 2,000,000
• If more than 1 Base or more than 1 Study (for trending reports), Rows times Columns cannot
exceed 500,000
• Can never have more than 25 Bases
• If more than 1 Study (for trending reports) then limited to no more than 10 Bases
Export Limits (Excel format)
• Maximum of 250 columns
• Maximum 7 bases
• Unlimited rows
• Rows x Columns x Bases cannot exceed 60,000
10
Quick Report
The Quick Report incorporates functionality to quickly generate data. In the future this will offer a
variety of report templates. Currently only one report template is available. All of the reports will have
a similar simple interface consisting of a study, target and base. These are identical or nearly so to
the ones in the Crosstab Edit pane.
General Settings
Study
Select the study to be used. When first opening the Quick Report, this uses the default from the
Preferences section.
Dictionary
Same as in the Crosstab Edit pane.
Target / Base
A Quick Report has one target and optionally a base. If no base is selected then the default is the
study universe. Items can come from the dictionary, search results or a definition.
Definitions
This is the same repository as found in the Crosstab Edit pane.
Quick Report: Demographic Profile Report
The Demographic Profile Report provides the demographic composition of the target consumers
among the base population.
11
MME
The Multi-Media Engagement feature allows users to compare various media vehicles for
effectiveness in delivering a message to targeted consumers.
A separate user manual is available which covers the MME functionality.
Edit Pane
Action Bar
Expression Creator Button - Opens the Expression Creator floating window. This is used to add
targets and a base; plus has access to stored definitions.
Study Selector - Opens the study selection window where the user can select which MME study to
use. NOTE: MME studies do not provide Field Start Date and Field End Date information.
Report Type Selector - Use can select between
• Engagement Scores
• Engagement Scores % Composition
• Statement Report
Run Report Button - Executes the MME report.
Media Vehicles Window
Organized lists of TV networks, TV shows, Magazines and Websites.
Report Window
Selection of what information will be used in the MME analysis.
12
Target Window & Base Window
Lists the desired targets and base for MME analysis. Note that only one base is allowed.
View Pane
Action Bar
Copy Button -Copies the contents of the report to the clipboard. This copied data is specially
formatted for use with an accompanying MME Excel Macro and is not suitable for other uses.
Edit Report Button - Returns the user to the MME Edit pane.
Target Tabs
Contains the reports for the various user selected targets.
Results Window
Presents the resulting data.
13
Geographic Mapping
This feature is only available to clients who have subscribed to one or more SimmonsLOCAL studies.
Target Window
A single target may be
loaded using the EDIT
button to open the floating
expression creator.
Base Window
A single base may be
loaded using the EDIT
button to open the floating
expression creator.
Action Buttons
Map button switches the
user to the Map View panel.
Geographic Dictionary
Multiple geographic areas
can be selected and
dragged to the Report Screen on the right.
Report Section
Displays the numeric values for requested geographic areas. The values are dynamically updated as
different target, base and geographies are selected.
14
Report Screen
Displays the map representation of the requested data.
Geographic Groupings
Buttons for Zips, Counties, Markets, States and Regions will have the map display the requested
Target and Base divided by the selected groupings.
The Report button will only show those geographic areas selected in the Report View.
Action Buttons
Select Visible will take the geographic areas visible in the map and put them into the report Section of
the Report View panel. This button is not active when you are viewing Report.
Edit Theme allows the user to change the map colors.
Map Area
The map area shows the color coded geographic areas. One important item is the Index. The top of
the index is the largest value in the map; The bottom of the index is the smallest value in the map.
The middle of the index is always at 100. There are two more index items that are linear halfway
points in the upper or lower region.
15
Correspondence Mapping
Correspondence Mapping translates complex data crosstabs into visual representations and assists
in competitive positioning and brand perception exercises.
Edit
Action Bar
Study Selector for choosing the current study.
Run Analysis button to start the analysis. Three columns and three rows are required before this
button is enabled.
Dictionary Window
List of available data points.
Answer Window
List of answer for the selected dictionary item.
Coding Box
Standard expression manipulation box.
16
Base Window
No more than one base is allowed.
Column Window
A minimum of three items are required.
Row Window
A minimum of three items are required.
View
Action Bar
View Selector – Selects the report to be displayed. The options are
•
•
•
•
•
Correspondence Map – Three axis map showing the relationship between the points
Row Points – X, Y, Z coordinates of the items in the Row Window
Columns Points – X, Y, Z coordinates of the items in the Column Window
Row Stats/Column Stats – Individual variable statistics including Mass, Inertia, Inertia % and
Distance
Axis Stats – Basic axis statistics including Eigenvalue, Eigenvalue Cumulative Total, Variance
and Cumulative Variance Explained
Correspondence Map
Displays the results of the analysis.
17
Axis Rotation
The map can be rotated around the three axes by using the mouse. It can be reset via the three Axis
buttons on the left. Users can freeze the rotation by checking the “Drag to Rotate” box.
Passive/Active Functionality
All variables start off as active but may be changed to passive if the user does not want the variable
to contribute to the overall map relationship. There are two ways to change the variable status:
• In Edit window, use the checkbox on the left-hand side of the column or row boxes
• In View window, left-click on any point and a pop-up will appear
To view the revised Correspondence Map the user must click the “Re-Run” button.
Remove Item
Variables can be removed from the Correspondence Map by left clicking on a variable point and
selecting “Remove Item” from the pop-up. To view the revised Correspondence Map the user must
click the “Re-Run” button.
Export
The map can be saved as a .png using the Export button.
Clean
The “Clean” button allows users to remove the least discriminating variables from the
Correspondence Map by assessing the chi square values. Correspondence Maps require at least
three variables to be selected in the columns as well as rows.
18
Cluster Analysis
Clustering Analysis allows clients to build proprietary clusters based upon Simmons attitudinal
statements. The client can profile clusters against 60,000+ Simmons variables, then easily transfer
clusters to “Crosstab Editor” for profiling and/or share the cluster with colleagues.
Edit
Action Bar
Study Selector for choosing the current study.
Choose the max number of cluster solutions for your analysis.
Run Analysis button to start the analysis.
Base Window
No more than one base is allowed.
Statements Window
List of available statements. Multiple statements should be selected.
19
Statement Distribution
Shows the distribution for the statement currently highlighted in the Statement Window. The study
universe mean and standard deviation estimate is provided for each statement.
View
Solution List
Displays the cluster solutions for
•
•
•
•
•
•
•
•
2-Cluster Solution
3-Cluster Solution
4-Cluster Solution
5-Cluster Solution
6-Cluster Solution
7-Cluster Solution
8-Cluster Solution
9-Cluster Solution
The Smallest Segment and Variance Explained are available.
20
Segment Details Window – Summary View
Shows summarized segment characteristics for the selected solution in the Solution List. Segment
Size (%), Sample and Notable Characteristics (by index) are available for each sector.
Note that you can click in the Segment Name field and give the segment a unique name.
Segment Details Window – Detail View
Shows detailed information for each segment, including the Index, Mean, Standard Deviation from
Mean and Absolute Deviation from Mean for each statement.
Save
Clicking on the Save button will save the selected Solution as a definition. The user may then run a
Crosstab for the selected solution in the Crosstab Tab.
21
Reach & Frequency
This feature allows the user to analyze the most effective way to reach their target audience via print
media.
Reach is the number or percent of different homes or persons exposed at least once to an advertising
schedule over a specific period of time. Reach, then, excludes duplication.
Frequency is the number of times that the average household or person is exposed to the schedule
among those persons reached in the specific period of time. Because it is an average frequency,
dispersion of frequency of exposure will differ between specific schedules and day part mixes.
Edit Pane
Action Bar
Study Selector for choosing the current study.
Run Analysis button to start the analysis.
Dictionary Window
List of available data points.
22
Answer Window
List of answer for the selected dictionary item.
Coding Box
Standard expression manipulation box.
Base Window
No more than one base is allowed.
Target Window
No more than one target is allowed.
Print Media Window
Place Print Media values here. They must be numeric type data (have a # in the Answer Window).
View Pane
The View Pane presents the results of the analysis as well as providing the means to run various print
media schedules.
Action Bar
Save Table – Saves the cost information for the listed magazines.
23
Load Table – Loads a file containing the magazine cost information.
Run Schedule – Executes the listed schedules and displays the information in the Results Window.
This section also contains information on the selected study.
Settings Window
In this section the user
•
•
•
Enters magazine cost information
Manually enters advertising schedules
Utilizes the Optimization feature to calculate advertising schedules
Results Window
Displays the results of the various advertising schedules.
24
Administration
This panel allows the user to set personal information and preferences.
My Info
This panel is used to update the user’s personal information.
Action Bar
The buttons here are used to switch between the personal settings and preferences.
User Details Window
This section contains personal information required by the system.
For passwords the requirements are:
•
•
•
•
Minimum 8 characters
Must have a lower case letter
Must have a number
Must have either an upper case letter or a special character
The challenge question is used when a user forgets the password and needs to reset it, or when the
user is locked out.
25
My Preferences
This panel allows the user to configure settings that affect functionality.
Action Bar
The buttons here are used to switch between the personal settings and preferences.
Preferences Window
This section contains settings used by various features in the system.
Default Setting For Dragging Question Text Along With Answer Text - This refers to the checkbox on
the Dictionary window in the Crosstab Edit pane. A check mark indicates the question text needs to
be included by default.
Default Map Location - This is the default location on the Geographic Map.
Default Study - This sets the base study that is open when the user first signs-in to the Crosstab Edit
pane.
1. Click on the Show Study List button
2. Select the desired default study
3. Click on the Save button
26
Functions; Average, Count, Volume, N-Tile
Sometimes a function is needed to accurately
measure a target. This feature is accessed
via a pop-up menu.
1. Highlight a selection of answers
2. Right click
3. Select Functions in the pop-up menu
This opens the Functions window.
From here the user can set up four different
types of built-in functions: Average, Count,
Volume and N-Tile.
Built-in Functions
Each function is coded by a function name (example: Volume) followed by a set of parameters
enclosed in parentheses. Parameters consist of comma-delimited value pairs. Each pair consists of a
keyword and a midpoint. The midpoint is usually derived from the dictionary, but it can be manually
entered as well. The manual override of midpoint can be done by typing the value directly in the
coding box.
Function
Description
Format
Example
COUNTRANGE
Count Coding
COUNTRANGE(keywords, nLower, nUpper)
CountRange(AGE18,AGE19,3,8)
Function
Description
Format
Example
MEANSCORE
Average: Mean
MEANSCORE(keyword, midpoint)
MEANSCORE(LOTACR10,10,LOTACR6,8,LOTACR4,5,LOTACR2,3,)
Function
Description
Format
Example
MEANSCORENOZERO
Average: Mean, Exclude Zeros
MEANSCORENOZERO(keyword, midpoint)
MEANSCORENOZERO(LOTACR10,10,LOTACR6,8,LOTACR4,5,LOTACR2,3,)
Function
Description
Format
Example
MEANSCORENONULL
Average: Mean, Exclude Nulls
MEANSCORENONULL(keyword, midpoint)
MEANSCORENONULL(LOTACR10,10,LOTACR6,8,LOTACR4,5,LOTACR2,3,)
Function
MEDIAN
Description Average: Median, Continuous
27
Format
Example
MEDIAN(VOLUME(keyword,midpoint))
MEDIAN(VOLUME (LOTACR10,10,LOTACR6,8,LOTACR4,5,LOTACR2,3,))
Function
Description
Format
Example
MEDIANNOZERO
Average: Median, Continuous, Exclude Zeros
MEDIANNOZERO(VOLUME(keyword,midpoint))
MEDIANNOZERO(VOLUME (LOTACR10,10,LOTACR6,8,LOTACR4,5,LOTACR2,3,))
Function
Description
Format
Example
MEDIANDISCRETE
Average: Median, Discrete
MEDIANDISCRETE(VOLUME(keyword,midpoint))
MEDIANDISCRETE(VOLUME (LOTACR10,10,LOTACR6,8,LOTACR4,5,LOTACR2,3,))
Function
Description
Format
Example
MEDIANDISCRETENOZERO
Average: Median, Exclude Zeros, Discrete
MEDIANDISCRETENOZERO(VOLUME(keyword,midpoint))
MEDIANDISCRETENOZERO(VOLUME (LOTACR10,10,LOTACR6,8,LOTACR2,3,))
Function
Description
Format
Example
NTILE
N-Tile Sample
NTILE(VOLUME()), # of Groups, Selected Group
NTILE (VOLUME (LOTACR10,10,LOTACR6,8,LOTACR4,5,LOTACR2,3,),4,2)
Function
Description
Format
Example
NTILEWT
N-Tile Weighted
NTILEWT(VOLUME()), # of Groups, Selected Group
NTILEWT (VOLUME (LOTACR10,10,LOTACR6,8,LOTACR4,5,LOTACR2,3,),4,2)
Function
Description
Format
Example
VOLUME
Volume
VOLUME(keyword, midpoint)
VOLUME(LOTACR10,10,LOTACR6,8,LOTACR4,5,LOTACR2,3)
NOTE: When calculating using a volume function (VOLUME, NTILE, MEDIAN), answers of “Zero”
and “None” will be included. A zero / none answer is any answer of “None” or “0” for a number. If it is
not desired for 0 elements to be part of the percentage, these items must be left out of the
expression.
Example:
Dry Brownie Mix - # of Packages Used Last 30 Days ANSWER: “None”
28
Zero answers are not the same as empty answers; empty answers have no designation for that
answer from the respondent.
Step-by-step guide to create an average (median) variable
1.
2.
3.
4.
5.
In the Answer window, select the items you wish to average
Right click the mouse and select Functions in the pop-up menu
Select Mean or Median and whether zeros are to be included in the average
Give the average a title
Use the Move To buttons to place the average in the desired location
Step-by-step guide to create a count variable
1. In the Answer window, select the items you wish to count (must be logical, not numeric type
data)
2. Right click the mouse and select Functions in the pop-up menu
3. Go to the Count tab
4. Set the upper bound and lower bound
5. Give the count a title
6. Use the Move To buttons to place the count in the desired location
Step-by-step guide to create a volume variable
1.
2.
3.
4.
5.
In the Answer window, select the items you wish to use in the volume
Right click the mouse and select Functions in the pop-up menu
Go to the Volume tab
Give the volume a title
Use the Move To buttons to place the volume in the desired location
Step-by-step guide to create an N-tile variable
1.
2.
3.
4.
5.
6.
7.
In the Answer window, select the items you wish to use in the N-Tile
Right click the mouse and select Functions in the pop-up menu
Go to the N-Tile tab
Enter values for number of groups and selected group
Select if this applies to Sample or Weighted values
Give the N-Tile a title
Use the Move To buttons to place the N-Tile in the desired location
29
Definitions
This is the storage location for saved target
definitions. These can be dragged and dropped
onto the Columns / Rows / Bases as well as the
Coding Box.
Definitions are contained inside of folders. There
are five types of definition folders:
Global Folder - These contain common targets
that are available to everyone using Simmons
OneViewSM They are provided by Experian
Marketing Services and cannot be modified by
end users.
General Folder - Standard storage location for users.
Study Specific Folder - Folders created as Study Specific
will only display when a particular study is set as the current
study. When other studies are set as the current study in
the Crosstab Edit pane, this folder does not display in the
list.
General Folder (Shared) - Folder that is shared across an
account.
Study Specific Folder (Shared) - Same as a Study Specific
Folder plus it is shared across the account.
Create, Edit, Duplicate and Delete Buttons act on the selected definition folder.
Browse shared is where you can include folders shared by others in your account. You only have a
view into these folders and cannot update them, only the original owner can make changes.
Step-by-step guide to using Definitions
How do I use definitions
Definitions are an excellent place to store items that you use frequently. By placing them in the
Definitions, you avoid having to re-code them or find them again in the dictionary.
1.
2.
3.
4.
5.
6.
7.
Open the appropriate study
Go to the Definitions tab
Click on the Create Definition button
Enter a name for the folder
Select whether it is to be a general or study specific folder
Click OK button
Go to the Questions tab and locate the items in the dictionary that you wish to store in
Definitions.
8. Highlight the items
9. Right click the mouse and select Add to Definitions
30
10. Select the Existing Definition radio button
11. In the dropdown list, select the folder you created in step 7.
To use items stored in a definitions folder
1. Go to the Definitions tab
2. Open the desired folder
3. Drag the items from the folder to the row, column, base
31
Recycle
This is similar to the Recycle Bin in Windows.
Whenever an item is deleted from columns, rows
or bases, the item (both individual answers as well
as target expressions) will be moved to the
Recycle Folder. From here these items can be
dragged and dropped back onto columns, rows or
bases as well as the coding box.
When the session is closed, the contents of this
folder are permanently deleted.
32
Dictionary
Data types
There are two types of data: Logical and Numeric. The vast majority of the data in
studies is logical (i.e. “Yes” or “No”). These are identified with a checkmark in the
answer window. Numeric data is an actual number and is indicated with a # symbol
in the answer window. Numeric tends to be items such as Average Readers Per
Issue.
Checkbox - Use Question Text with Answer Text
When checked, dragging answers from the Answer Window and dropping them onto column / row /
base will also bring along the question text. Useful if the answer is something simple such as “Yes”. It
will instead display “Automotive Club - Belong To - Yes” in
the columns, rows, bases.
Buttons - Or All Selections / And All Selections
Clicking on either of these buttons will cause the items selected in the Answer Window to be copied
to the Coding Box, along with the matching logical operator.
Search
This is used to locate items in the dictionary. Enter an item
to search for in the Search Box. User can select the range to
search including
• Answer Only
• Answers and Questions
• All
The search text is taken as a literal phrase thus entering
Chevrolet Impala into the search field will only find instances
of “Chevrolet Impala” the automobile and not any mention of
the impala animal. Search text is not case sensitive.
33
Coding Box
This section handles the creation of complex logical expressions. Items can be dropped onto the
Coding Box from the Answer Window, Definitions Tab, Recycle Tab, Columns / Rows / Bases
Windows.
Target Name
This is used when
storing the target. Also
used in the Columns /
Rows / Bases Windows
and Crosstab Report. If
the Target Name is
empty and the user
drops one or more
items onto the Coding Box from the Answer Window, the system auto-populates the Target Name
with either the answer text (if only one item is dropped) or the question text (if more than one item is
dropped).
Buttons - Move To
Copies the target to the specified destination.
Buttons - Logical Operators
Adds the specified logical operator at the point of the cursor in the Coding Box.
Button - Verify Target
Checks the expression syntax in the Coding Box and (if the Auto Format box is checked) re-formats
the expression. After verifying the target expression, the Coding Box will turn either red (errors found)
or green (syntax is good).
Button - Define Target
Displays the entire expanded folder structure for the expression.
Button - Clear Target
Clears the contents of the Coding Box and the Target Name.
Button - Save Target
Saves the target to the Definitions tab.
Checkbox - Auto Format
When selected, the expression will be formatted upon use of the Verify Target button.
Step-by-step guide to using the Coding Box
1. Drag and drop items from the dictionary to the coding box
34
2.
3.
4.
5.
Enter appropriate logical operators (either typing directly or using the provided buttons)
Enter a title for the expression
Click on the Verify Target button
If the box turns red, this indicates an error in the expression; Fix the error and click on the
Verify Target button again.
6. Once the box turns green, use the coding box action buttons to move the expression to
column, row, base or definition
35
FAQ
How do I get my username and password
Your username is your email address. Your password will come to you in an email once you are set
up in the system by your Client Administrator.
What if I forget my password
There is a Forgot Password link on the sign-in page. Prior to using it you need to have configured
your challenge question on your administration page. Otherwise you will need to contact your Client
Administrator.
The system says I am locked out; what do I do
If you attempt to enter too many incorrect passwords in a row, the system has a security feature to
lock you out. A Locked Out? feature is provided to unlock your account. Alternatively you can contact
your Client Administrator to unlock your system.
How come I do not see a study in the study list
This can be caused by one of three reasons.
• Your contract with Experian Marketing Services does not entitle you to access the study.
• Your Client Administrator has not assigned you a seat to access that particular study.
• There is a system issue.
Contact your Client Administrator or a Experian Marketing Services Client Service Account Manager
to assist you.
How do I change my password
1. Go to the Administration tab
2. Enter a new password in the appropriate fields
3. Save
36