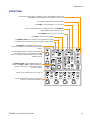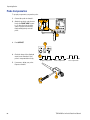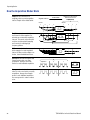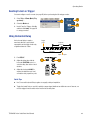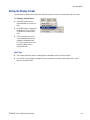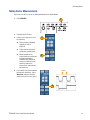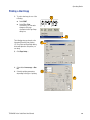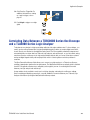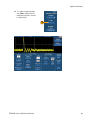
1
TDS5000B Series
Digital Phosphor Oscilloscopes
Quick Start User Manual
www.tektronix.com
Copyright © Tektronix, Inc. All rights reserved.
Tektronix products are covered by U.S. and foreign patents, issued and pending. Information in this publication
supercedes that in all previously published material. Specifications and price change privileges reserved.
Tektronix, Inc., P.O. Box 500, Beaverton, OR 97077
TEKTRONIX, TekScope, and TEK are registered trademarks of Tektronix, Inc.
FastFrame, OpenChoice, IView, MyScope, and MultiView Zoom are trademarks of Tektronix, Inc.
WARRANTY
Tektronix warrants that the products that it manufactures and sells will be free from defects in materials and
workmanship for a period of one (1) year from the date of shipment. If this product proves defective during its warranty
period, Tektronix, at its option, will either repair the defective product without charge for parts and labor, or provide a
replacement in exchange for the defective product.
This warranty applies only to products returned to the designated Tektronix depot or the Tektronix authorized
representative from which the product was originally purchased. For products returned to other locations, Customer will
be assessed an applicable service charge. The preceding limitation shall not apply within the European Economic Area,
where products may be returned for warranty service to the nearest designated service depot regardless of the place of
purchase.
In order to obtain service under this warranty, Customer must provide the applicable office of Tektronix or its authorized
representative with notice of the defect before the expiration of the warranty period and make suitable arrangements for
the performance of service. Customer shall be responsible for packaging and shipping the defective product to the
service center designated by Tektronix or its representative, with shipping charges prepaid. Tektronix or its
representative shall pay for the return of the product to Customer. Customer shall be responsible for paying any
associated taxes or duties.
This warranty shall not apply to any defect, failure or damage caused by improper use or improper or inadequate
maintenance and care. Tektronix shall not be obligated to furnish service under this warranty:
a)
to repair damage resulting from attempts by personnel other than Tektronix representatives to install, repair or service
the product;
b) to repair damage resulting from improper use or connection to incompatible equipment;
c)
to repair any damage or malfunction caused by the use of non-Tektronix supplies or consumables;
d) to repair a product that has been modified or integrated with other products when the effect of such modification or
integration increases the time or difficulty of servicing the product; or
e)
to repair damage or malfunction resulting from failure to perform user maintenance and cleaning at the frequency and as
prescribed in the user manual (if applicable).
THE ABOVE WARRANTIES ARE GIVEN BY TEKTRONIX WITH RESPECT TO THIS PRODUCT IN LIEU OF ANY OTHER WARRANTIES,
EXPRESS OR IMPLIED. TEKTRONIX AND ITS VENDORS DISCLAIM ANY IMPLIED WARRANTIES OF MERCHANTABILITY OR FITNESS
FOR A PARTICULAR PURPOSE. TEKTRONIX’ RESPONSIBILITY TO REPAIR OR REPLACE DEFECTIVE PRODUCTS IS THE SOLE AND
EXCLUSIVE REMEDY PROVIDED TO THE CUSTOMER FOR BREACH OF THIS WARRANTY. TEKTRONIX AND ITS VENDORS WILL NOT
BE LIABLE FOR ANY INDIRECT, SPECIAL, INCIDENTAL, OR CONSEQUENTIAL DAMAGES IRRESPECTIVE OF WHETHER TEKTRONIX OR
THE VENDOR HAS ADVANCE NOTICE OF THE POSSIBILITY OF SUCH DAMAGES.
Table of Contents
Safety Summary . . . . . . . . . . . . . . . . . . . . . . . . . . . . . . . . . . . . . . . . . . . . . . . . . . . . . . . . . . . . . . . . . . . . . . .
1
Preface
Documentation . . . . . . . . . . . . . . . . . . . . . . . . . . . . . . . . . . . . . . . . . . . . . . . . . . . . . . . . . . . . . . . . . . . .
Conventions Used in this Manual . . . . . . . . . . . . . . . . . . . . . . . . . . . . . . . . . . . . . . . . . . . . . . . . . . . . . .
Contacting Tektronix . . . . . . . . . . . . . . . . . . . . . . . . . . . . . . . . . . . . . . . . . . . . . . . . . . . . . . . . . . . . . . . .
3
4
4
Getting Started
Key Features . . . . . . . . . . . . . . . . . . . . . . . . . . . . . . . . . . . . . . . . . . . . . . . . . . . . . . . . . . . . . . . . . . . . . . . . . .
5
Install Your Instrument . . . . . . . . . . . . . . . . . . . . . . . . . . . . . . . . . . . . . . . . . . . . . . . . . . . . . . . . . . . . . . . . .
Standard Accessories . . . . . . . . . . . . . . . . . . . . . . . . . . . . . . . . . . . . . . . . . . . . . . . . . . . . . . . . . . . . . . .
Operating Requirements . . . . . . . . . . . . . . . . . . . . . . . . . . . . . . . . . . . . . . . . . . . . . . . . . . . . . . . . . . . . .
Powering On the Instrument . . . . . . . . . . . . . . . . . . . . . . . . . . . . . . . . . . . . . . . . . . . . . . . . . . . . . . . . . .
Power Supply Requirements . . . . . . . . . . . . . . . . . . . . . . . . . . . . . . . . . . . . . . . . . . . . . . . . . . . . . .
Powering Off the Instrument . . . . . . . . . . . . . . . . . . . . . . . . . . . . . . . . . . . . . . . . . . . . . . . . . . . . . . . . . .
Removing the Power . . . . . . . . . . . . . . . . . . . . . . . . . . . . . . . . . . . . . . . . . . . . . . . . . . . . . . . . . . . . . . . .
Creating an Emergency Startup Disk . . . . . . . . . . . . . . . . . . . . . . . . . . . . . . . . . . . . . . . . . . . . . . . . . . . .
Connecting to a Network . . . . . . . . . . . . . . . . . . . . . . . . . . . . . . . . . . . . . . . . . . . . . . . . . . . . . . . . . . . . .
Adding a Second Monitor . . . . . . . . . . . . . . . . . . . . . . . . . . . . . . . . . . . . . . . . . . . . . . . . . . . . . . . . . . . .
Changing the Windows Language . . . . . . . . . . . . . . . . . . . . . . . . . . . . . . . . . . . . . . . . . . . . . . . . . . . . . .
6
6
8
8
8
9
9
10
10
11
13
Getting Acquainted with Your Instrument . . . . . . . . . . . . . . . . . . . . . . . . . . . . . . . . . . . . . . . . . . . . . . . . . . .
Front Panel . . . . . . . . . . . . . . . . . . . . . . . . . . . . . . . . . . . . . . . . . . . . . . . . . . . . . . . . . . . . . . . . . . . . . . .
Side and Rear Panels . . . . . . . . . . . . . . . . . . . . . . . . . . . . . . . . . . . . . . . . . . . . . . . . . . . . . . . . . . . . . . .
Interface and Display . . . . . . . . . . . . . . . . . . . . . . . . . . . . . . . . . . . . . . . . . . . . . . . . . . . . . . . . . . . . . . . .
Control Panel . . . . . . . . . . . . . . . . . . . . . . . . . . . . . . . . . . . . . . . . . . . . . . . . . . . . . . . . . . . . . . . . . . . . . .
Accessing Online Help . . . . . . . . . . . . . . . . . . . . . . . . . . . . . . . . . . . . . . . . . . . . . . . . . . . . . . . . . . . . . . .
Accessing Menus and Control Windows . . . . . . . . . . . . . . . . . . . . . . . . . . . . . . . . . . . . . . . . . . . . . . . . .
15
15
15
16
17
18
19
Inspect Your Instrument . . . . . . . . . . . . . . . . . . . . . . . . . . . . . . . . . . . . . . . . . . . . . . . . . . . . . . . . . . . . . . . .
Verify Internal Diagnostics Pass . . . . . . . . . . . . . . . . . . . . . . . . . . . . . . . . . . . . . . . . . . . . . . . . . . . . . . .
Signal Path Compensation . . . . . . . . . . . . . . . . . . . . . . . . . . . . . . . . . . . . . . . . . . . . . . . . . . . . . . . . . . .
20
20
21
Operating Basics
Acquisition . . . . . . . . . . . . . . . . . . . . . . . . . . . . . . . . . . . . . . . . . . . . . . . . . . . . . . . . . . . . . . . . . . . . . . . . . . .
Setting Up Signal Input . . . . . . . . . . . . . . . . . . . . . . . . . . . . . . . . . . . . . . . . . . . . . . . . . . . . . . . . . . . . . .
Using Default Setup . . . . . . . . . . . . . . . . . . . . . . . . . . . . . . . . . . . . . . . . . . . . . . . . . . . . . . . . . . . . . . . .
Using Autoset . . . . . . . . . . . . . . . . . . . . . . . . . . . . . . . . . . . . . . . . . . . . . . . . . . . . . . . . . . . . . . . . . . . . .
Probe Compensation . . . . . . . . . . . . . . . . . . . . . . . . . . . . . . . . . . . . . . . . . . . . . . . . . . . . . . . . . . . . . . . .
Acquisition Concepts . . . . . . . . . . . . . . . . . . . . . . . . . . . . . . . . . . . . . . . . . . . . . . . . . . . . . . . . . . . . . . . .
TDS5000B Series Quick Start User Manual
23
23
24
25
26
27
i
ii
Acquisition Hardware . . . . . . . . . . . . . . . . . . . . . . . . . . . . . . . . . . . . . . . . . . . . . . . . . . . . . . . . . . . .
Sampling Process . . . . . . . . . . . . . . . . . . . . . . . . . . . . . . . . . . . . . . . . . . . . . . . . . . . . . . . . . . . . . .
Real-time Sampling . . . . . . . . . . . . . . . . . . . . . . . . . . . . . . . . . . . . . . . . . . . . . . . . . . . . . . . . . . . . .
Equivalent-time Sampling . . . . . . . . . . . . . . . . . . . . . . . . . . . . . . . . . . . . . . . . . . . . . . . . . . . . . . . .
Waveform Record . . . . . . . . . . . . . . . . . . . . . . . . . . . . . . . . . . . . . . . . . . . . . . . . . . . . . . . . . . . . . .
Interpolation . . . . . . . . . . . . . . . . . . . . . . . . . . . . . . . . . . . . . . . . . . . . . . . . . . . . . . . . . . . . . . . . . . .
Interleaving . . . . . . . . . . . . . . . . . . . . . . . . . . . . . . . . . . . . . . . . . . . . . . . . . . . . . . . . . . . . . . . . . . .
How the Acquisition Modes Work . . . . . . . . . . . . . . . . . . . . . . . . . . . . . . . . . . . . . . . . . . . . . . . . . . . . . .
Changing the Acquisition Mode . . . . . . . . . . . . . . . . . . . . . . . . . . . . . . . . . . . . . . . . . . . . . . . . . . . . . . . .
Starting and Stopping an Acquisition . . . . . . . . . . . . . . . . . . . . . . . . . . . . . . . . . . . . . . . . . . . . . . . . . . .
Using Roll Mode . . . . . . . . . . . . . . . . . . . . . . . . . . . . . . . . . . . . . . . . . . . . . . . . . . . . . . . . . . . . . . . . . . .
Using Fast Acquisitions . . . . . . . . . . . . . . . . . . . . . . . . . . . . . . . . . . . . . . . . . . . . . . . . . . . . . . . . . . . . . .
Using FastFrame Mode . . . . . . . . . . . . . . . . . . . . . . . . . . . . . . . . . . . . . . . . . . . . . . . . . . . . . . . . . . . . . .
27
27
27
27
28
29
29
30
31
32
33
34
37
Triggers . . . . . . . . . . . . . . . . . . . . . . . . . . . . . . . . . . . . . . . . . . . . . . . . . . . . . . . . . . . . . . . . . . . . . . . . . . . . .
Triggering Concepts . . . . . . . . . . . . . . . . . . . . . . . . . . . . . . . . . . . . . . . . . . . . . . . . . . . . . . . . . . . . . . . .
Trigger Event . . . . . . . . . . . . . . . . . . . . . . . . . . . . . . . . . . . . . . . . . . . . . . . . . . . . . . . . . . . . . . . . . .
Trigger Types . . . . . . . . . . . . . . . . . . . . . . . . . . . . . . . . . . . . . . . . . . . . . . . . . . . . . . . . . . . . . . . . . .
Trigger Modes . . . . . . . . . . . . . . . . . . . . . . . . . . . . . . . . . . . . . . . . . . . . . . . . . . . . . . . . . . . . . . . . .
Trigger Holdoff . . . . . . . . . . . . . . . . . . . . . . . . . . . . . . . . . . . . . . . . . . . . . . . . . . . . . . . . . . . . . . . . .
Trigger Coupling . . . . . . . . . . . . . . . . . . . . . . . . . . . . . . . . . . . . . . . . . . . . . . . . . . . . . . . . . . . . . . . .
Horizontal Position . . . . . . . . . . . . . . . . . . . . . . . . . . . . . . . . . . . . . . . . . . . . . . . . . . . . . . . . . . . . . .
Slope and Level . . . . . . . . . . . . . . . . . . . . . . . . . . . . . . . . . . . . . . . . . . . . . . . . . . . . . . . . . . . . . . . .
Delayed Trigger System . . . . . . . . . . . . . . . . . . . . . . . . . . . . . . . . . . . . . . . . . . . . . . . . . . . . . . . . . .
Choosing a Trigger Type . . . . . . . . . . . . . . . . . . . . . . . . . . . . . . . . . . . . . . . . . . . . . . . . . . . . . . . . . . . . .
Trigger Selections . . . . . . . . . . . . . . . . . . . . . . . . . . . . . . . . . . . . . . . . . . . . . . . . . . . . . . . . . . . . . . . . . .
Checking Trigger Status . . . . . . . . . . . . . . . . . . . . . . . . . . . . . . . . . . . . . . . . . . . . . . . . . . . . . . . . . . . . .
Using A (Main) and B (Delayed) Triggers . . . . . . . . . . . . . . . . . . . . . . . . . . . . . . . . . . . . . . . . . . . . . . . .
Trigger on B Event . . . . . . . . . . . . . . . . . . . . . . . . . . . . . . . . . . . . . . . . . . . . . . . . . . . . . . . . . . . . . .
B Trigger After Delay Time . . . . . . . . . . . . . . . . . . . . . . . . . . . . . . . . . . . . . . . . . . . . . . . . . . . . . . . .
Sending E-mail on Trigger . . . . . . . . . . . . . . . . . . . . . . . . . . . . . . . . . . . . . . . . . . . . . . . . . . . . . . . . . . . .
Using Horizontal Delay . . . . . . . . . . . . . . . . . . . . . . . . . . . . . . . . . . . . . . . . . . . . . . . . . . . . . . . . . . . . . .
39
39
39
39
40
40
40
41
41
41
42
43
44
45
46
46
47
47
Display a Waveform . . . . . . . . . . . . . . . . . . . . . . . . . . . . . . . . . . . . . . . . . . . . . . . . . . . . . . . . . . . . . . . . . . . .
Setting the Display Style . . . . . . . . . . . . . . . . . . . . . . . . . . . . . . . . . . . . . . . . . . . . . . . . . . . . . . . . . . . . .
Setting the Display Persistence . . . . . . . . . . . . . . . . . . . . . . . . . . . . . . . . . . . . . . . . . . . . . . . . . . . . . . . .
Using AutoBright . . . . . . . . . . . . . . . . . . . . . . . . . . . . . . . . . . . . . . . . . . . . . . . . . . . . . . . . . . . . . . . . . . .
Setting the Display Format . . . . . . . . . . . . . . . . . . . . . . . . . . . . . . . . . . . . . . . . . . . . . . . . . . . . . . . . . . .
Selecting the Waveform Interpolation . . . . . . . . . . . . . . . . . . . . . . . . . . . . . . . . . . . . . . . . . . . . . . . . . . .
Adding Screen Text . . . . . . . . . . . . . . . . . . . . . . . . . . . . . . . . . . . . . . . . . . . . . . . . . . . . . . . . . . . . . . . . .
Setting the Graticule Style . . . . . . . . . . . . . . . . . . . . . . . . . . . . . . . . . . . . . . . . . . . . . . . . . . . . . . . . . . . .
Setting the Trigger Level Marker . . . . . . . . . . . . . . . . . . . . . . . . . . . . . . . . . . . . . . . . . . . . . . . . . . . . . . .
Setting the LCD Backlight . . . . . . . . . . . . . . . . . . . . . . . . . . . . . . . . . . . . . . . . . . . . . . . . . . . . . . . . . . . .
Displaying the Date and Time . . . . . . . . . . . . . . . . . . . . . . . . . . . . . . . . . . . . . . . . . . . . . . . . . . . . . . . . .
Using the Color Palettes . . . . . . . . . . . . . . . . . . . . . . . . . . . . . . . . . . . . . . . . . . . . . . . . . . . . . . . . . . . . .
Setting the Reference Colors . . . . . . . . . . . . . . . . . . . . . . . . . . . . . . . . . . . . . . . . . . . . . . . . . . . . . . . . . .
Setting Math Colors . . . . . . . . . . . . . . . . . . . . . . . . . . . . . . . . . . . . . . . . . . . . . . . . . . . . . . . . . . . . . . . . .
Using MultiView Zoom . . . . . . . . . . . . . . . . . . . . . . . . . . . . . . . . . . . . . . . . . . . . . . . . . . . . . . . . . . . . . .
48
48
49
50
51
52
53
54
55
55
56
56
58
58
59
TDS5000B Series Quick Start User Manual
Zooming in Multiple Areas . . . . . . . . . . . . . . . . . . . . . . . . . . . . . . . . . . . . . . . . . . . . . . . . . . . . . . . . . . .
Lock and Scroll Zoomed Waveforms . . . . . . . . . . . . . . . . . . . . . . . . . . . . . . . . . . . . . . . . . . . . . . . . . . .
60
61
Analyzing Waveforms . . . . . . . . . . . . . . . . . . . . . . . . . . . . . . . . . . . . . . . . . . . . . . . . . . . . . . . . . . . . . . . . . . .
Taking Automatic Measurements . . . . . . . . . . . . . . . . . . . . . . . . . . . . . . . . . . . . . . . . . . . . . . . . . . . . . .
Automated Measurement Selections . . . . . . . . . . . . . . . . . . . . . . . . . . . . . . . . . . . . . . . . . . . . . . . . . . . .
Amplitude Measurements . . . . . . . . . . . . . . . . . . . . . . . . . . . . . . . . . . . . . . . . . . . . . . . . . . . . . . . .
Time Measurements . . . . . . . . . . . . . . . . . . . . . . . . . . . . . . . . . . . . . . . . . . . . . . . . . . . . . . . . . . . .
More Measurements . . . . . . . . . . . . . . . . . . . . . . . . . . . . . . . . . . . . . . . . . . . . . . . . . . . . . . . . . . . .
Histogram Measurements . . . . . . . . . . . . . . . . . . . . . . . . . . . . . . . . . . . . . . . . . . . . . . . . . . . . . . . .
Communication Measurements . . . . . . . . . . . . . . . . . . . . . . . . . . . . . . . . . . . . . . . . . . . . . . . . . . .
Customizing an Automatic Measurement . . . . . . . . . . . . . . . . . . . . . . . . . . . . . . . . . . . . . . . . . . . . . . . .
Gating . . . . . . . . . . . . . . . . . . . . . . . . . . . . . . . . . . . . . . . . . . . . . . . . . . . . . . . . . . . . . . . . . . . . . . . .
Statistics . . . . . . . . . . . . . . . . . . . . . . . . . . . . . . . . . . . . . . . . . . . . . . . . . . . . . . . . . . . . . . . . . . . . .
Snapshot . . . . . . . . . . . . . . . . . . . . . . . . . . . . . . . . . . . . . . . . . . . . . . . . . . . . . . . . . . . . . . . . . . . . .
Reference Levels . . . . . . . . . . . . . . . . . . . . . . . . . . . . . . . . . . . . . . . . . . . . . . . . . . . . . . . . . . . . . . .
Taking Cursor Measurements . . . . . . . . . . . . . . . . . . . . . . . . . . . . . . . . . . . . . . . . . . . . . . . . . . . . . . . . .
Setting Up a Histogram . . . . . . . . . . . . . . . . . . . . . . . . . . . . . . . . . . . . . . . . . . . . . . . . . . . . . . . . . . . . . .
Using Math Waveforms . . . . . . . . . . . . . . . . . . . . . . . . . . . . . . . . . . . . . . . . . . . . . . . . . . . . . . . . . . . . . .
Spectral Analysis Concepts . . . . . . . . . . . . . . . . . . . . . . . . . . . . . . . . . . . . . . . . . . . . . . . . . . . . . . . . . . .
Using the Time Controls . . . . . . . . . . . . . . . . . . . . . . . . . . . . . . . . . . . . . . . . . . . . . . . . . . . . . . . . . .
Using the Gating Controls . . . . . . . . . . . . . . . . . . . . . . . . . . . . . . . . . . . . . . . . . . . . . . . . . . . . . . . .
Using the Frequency Controls . . . . . . . . . . . . . . . . . . . . . . . . . . . . . . . . . . . . . . . . . . . . . . . . . . . . .
Using the Magnitude Controls . . . . . . . . . . . . . . . . . . . . . . . . . . . . . . . . . . . . . . . . . . . . . . . . . . . . .
Using the Phase Controls . . . . . . . . . . . . . . . . . . . . . . . . . . . . . . . . . . . . . . . . . . . . . . . . . . . . . . . . .
Using Spectral Analysis . . . . . . . . . . . . . . . . . . . . . . . . . . . . . . . . . . . . . . . . . . . . . . . . . . . . . . . . . . . . . .
Using Limit Testing . . . . . . . . . . . . . . . . . . . . . . . . . . . . . . . . . . . . . . . . . . . . . . . . . . . . . . . . . . . . . . . . .
Using Mask Testing . . . . . . . . . . . . . . . . . . . . . . . . . . . . . . . . . . . . . . . . . . . . . . . . . . . . . . . . . . . . . . . . .
Setting Up E-mail on Event . . . . . . . . . . . . . . . . . . . . . . . . . . . . . . . . . . . . . . . . . . . . . . . . . . . . . . . . . . .
62
62
63
63
64
65
66
67
68
68
69
69
70
71
73
74
75
76
76
76
77
77
78
80
82
85
MyScope . . . . . . . . . . . . . . . . . . . . . . . . . . . . . . . . . . . . . . . . . . . . . . . . . . . . . . . . . . . . . . . . . . . . . . . . . . . .
Creating a New MyScope Control Window . . . . . . . . . . . . . . . . . . . . . . . . . . . . . . . . . . . . . . . . . . . . . . .
Using MyScope Control Windows . . . . . . . . . . . . . . . . . . . . . . . . . . . . . . . . . . . . . . . . . . . . . . . . . . . . . .
87
87
90
Saving and Recalling Information . . . . . . . . . . . . . . . . . . . . . . . . . . . . . . . . . . . . . . . . . . . . . . . . . . . . . . . . . .
Saving Screen Captures . . . . . . . . . . . . . . . . . . . . . . . . . . . . . . . . . . . . . . . . . . . . . . . . . . . . . . . . . . . . .
Saving Waveforms . . . . . . . . . . . . . . . . . . . . . . . . . . . . . . . . . . . . . . . . . . . . . . . . . . . . . . . . . . . . . . . . .
Recalling Waveforms . . . . . . . . . . . . . . . . . . . . . . . . . . . . . . . . . . . . . . . . . . . . . . . . . . . . . . . . . . . . . . .
Saving Instrument Setups . . . . . . . . . . . . . . . . . . . . . . . . . . . . . . . . . . . . . . . . . . . . . . . . . . . . . . . . . . . .
Recalling Instrument Setups . . . . . . . . . . . . . . . . . . . . . . . . . . . . . . . . . . . . . . . . . . . . . . . . . . . . . . . . . .
Saving Measurements . . . . . . . . . . . . . . . . . . . . . . . . . . . . . . . . . . . . . . . . . . . . . . . . . . . . . . . . . . . . . . .
Copying Your Results to the Clipboard . . . . . . . . . . . . . . . . . . . . . . . . . . . . . . . . . . . . . . . . . . . . . . . . . .
Printing a Hard Copy . . . . . . . . . . . . . . . . . . . . . . . . . . . . . . . . . . . . . . . . . . . . . . . . . . . . . . . . . . . . . . . .
92
92
93
94
95
96
97
98
99
Run Application Software . . . . . . . . . . . . . . . . . . . . . . . . . . . . . . . . . . . . . . . . . . . . . . . . . . . . . . . . . . . . . . . .
100
TDS5000B Series Quick Start User Manual
iii
Application Examples
Capturing Intermittent Anomalies . . . . . . . . . . . . . . . . . . . . . . . . . . . . . . . . . . . . . . . . . . . . . . . . . . . . . . . . . .
101
Correlating Data Between a TDS5000B Series Oscilloscope and a TLA5000 Series Logic Analyzer . . . . . . .
103
Using the Extended Desktop and OpenChoice Architecture for Efficient Documentation . . . . . . . . . . . . . . . .
104
Measuring Switching Loss in a Switch Mode Power Supply (SMPS) . . . . . . . . . . . . . . . . . . . . . . . . . . . . . .
106
Using Acquisition Memory to Efficiently Capture Multiple High Resolution Events . . . . . . . . . . . . . . . . . . . .
109
Using Limit Test to Verify Performance . . . . . . . . . . . . . . . . . . . . . . . . . . . . . . . . . . . . . . . . . . . . . . . . . . . . .
112
Index
iv
TDS5000B Series Quick Start User Manual
Safety Summary
Review the following safety precautions to avoid injury and prevent damage to this product or any products
connected to it. To avoid potential hazards, use this product only as specified.
Only qualified personnel should perform service procedures.
While using this product, you may need to access other parts of a larger system. Read the safety sections of
the other component’s manuals for warnings and cautions related to operating the system.
To Avoid Fire or Personal Injury
Use Proper Power Cord. Use only the power cord specified for this product and certified for the country of
use.
Connect and Disconnect Properly. Do not connect or disconnect probes or test leads while they are
connected to a voltage source.
Ground the Product. This product is indirectly grounded through the grounding conductor of the power cord.
To avoid electric shock, the grounding conductor must be connected to earth ground. Before making connections to the input or output terminals of the product, ensure that the product is properly grounded.
Observe All Terminal Ratings. To avoid fire or shock hazard, observe all ratings and markings on the product.
Consult the product manual for further ratings information before making connections to the product. Connect
the ground lead of the probe to earth ground only.
Do Not Operate Without Covers. Do not operate this product with covers or panels removed.
Avoid Exposed Circuitry. Do not touch exposed connections and components when power is present.
Do Not Operate With Suspected Failures. If you suspect there is damage to this product, have it inspected by
qualified service personnel.
Do Not Operate in Wet/Damp Conditions.
Do Not Operate in an Explosive Atmosphere.
Keep Product Surfaces Clean and Dry.
Provide Proper Ventilation. Refer to the manual’s installation instructions for details on installing the product
so it has proper ventilation.
TDS5000B Series Quick Start User Manual
1
Symbols and Terms
Terms in this Manual. These terms may appear in this manual:
WARNING. Warning statements identify conditions or practices that could result in injury or loss of life.
CAUTION. Caution statements identify conditions or practices that could result in damage to this product or
other property.
Terms on the Product. These terms may appear on the product:
DANGER indicates an injury hazard immediately accessible as you read the marking.
WARNING indicates an injury hazard not immediately accessible as you read the marking.
CAUTION indicates a hazard to property including the product.
Symbols on the Product. The following symbols may appear on the product:
CAUTION
Refer to Manual
2
WARNING
High Voltage
Protective Ground
(Earth) Terminal
Standby
TDS5000B Series Quick Start User Manual
Preface
This manual describes the installation and operation of TDS5000B Series Instruments. Basic operations and
concepts are presented in this manual. For more detailed information see the online help on your instrument.
The following instruments are supported by this manual:
TDS5104B
TDS5054B
TDS5052B
TDS5054BE
TDS5034B
TDS5032B
Documentation
To read about
Use these documents
Installation and Operation
(overviews)
Read the Quick Start User Manual for general information about how to
put your instrument into service and maps of the user interface
controls.
In-Depth Operation and User
Interface Help
Access online help from the Help button or Help menu for information
on virtually all controls and elements on screen.
Online help includes detailed instructions for using instrument
functions. See Accessing Online Help on page 18.
Programmer Commands
Quickly remind yourself of the syntax of a GPIB command, and copy
the command if desired. The programmer guide is on the product
software CD.
Analysis and Connectivity Tools
Various connectivity and analysis tools are available on your instrument. For more information, see the Getting Started with OpenChoicet
Solutions Manual included with your instrument.
Performance Verification and
Specifications
Use this Technical Reference PDF file, which is located on the product
software CD, for performance verification and specifications.
Optional Applications
The Optional Applications Software for Tektronix Windows-Based TDS
Instruments CD-ROM (020-2450-xx) contains trial versions of
application specific programs that you can install and run five times per
application. To purchase a program contact your local Tektronix
representative.
Product Software and System
Restore
Booklets for the Product CD-ROM (063-3692-xx) and System Restore
CD-ROM (063-3693-xx).
You may also want to obtain the optional service manual (071-1362-xx) for this product if you do self-service or
performance verifications on this instrument.
TDS5000B Series Quick Start User Manual
3
Preface
Conventions Used in this Manual
The following icons are used throughout this manual.
Sequence
Step
Front panel
power
Connect
power
Network
PS2
SVGA
USB
1
Contacting Tektronix
Phone
1-800-833-9200 1
Address
Tektronix, Inc.
Department or name (if known)
14200 SW Karl Braun Drive
P.O. Box 500
Beaverton, OR 97077
USA
Web site
www.tektronix.com
Sales support
1-800-833-9200, select option 1 1
Service support
1-800-833-9200, select option 2 1
Technical support
Email: [email protected]
1-800-833-9200, select option 3 1
6:00 a.m. - 5:00 p.m. Pacific time
1
4
This phone number is toll free in North America. After office hours, please leave a voice mail message.
Outside North America, contact a Tektronix sales office or distributor; see the Tektronix web site for a list of offices.
TDS5000B Series Quick Start User Manual
Getting Started
This section contains information on key features of your instrument, getting acquainted with, installing, and
inspecting your instrument.
Key Features
TDS5000B Series instruments can help you verify, debug, and characterize electronic designs. Key features
include:
H
Up to 1 GHz bandwidth
H
Up to 5 GS/s real time sampling rate
H
Record lengths up to 16,000,000 samples
H
Up to 100,000 acquisitions per second
H
1.25% DC vertical gain accuracy
H
Two or four input channels
H
Auxiliary trigger input and output
H
Sample, envelope, peak-detect, high-resolution, average, and waveform database acquisition modes
H
Full programmability, with an extensive GPIB command set and a message-based interface
H
Advanced trigger suite
H
53 automatic waveform measurements plus histograms
H
Basic math as well as advanced equation editor and spectral analysis
H
A 10.4 in (264.2 mm) color display, with intensity graded waveform data to show sample density
H
Customizable MyScope control windows
H
A Windows based user interface with accompanying online help
TDS5000B Series Quick Start User Manual
5
Getting Started
Install Your Instrument
Unpack the instrument and check that you received all items listed as Standard Accessories. Recommended
accessories and probes, instrument options, and upgrades are listed in the online help. Check the Tektronix
website (www.tektronix.com) for the most current information.
Standard Accessories
Tektronix
part number
Accessory
The TDS5000B Series Digital Phosphor Oscilloscopes
Quick Start User Manual
6
English (Option L0)
071-1355-xx
French (Option L1)
071-1357-xx
German (Option L3)
071-1358-xx
Japanese (Option L5)
071-1356-xx
Simple Chinese (Option L7)
071-1360-xx
Standard Chinese (Option
L8)
071-1361-xx
Korean (Option L9)
071-1359-xx
Russian (Option L10)
071-1401-xx
TDS5000B series Product Software CD
063-3692-xx
TDS5000B series Operating System Restore CD
063-3693-xx
The TDS5000B Online Help (part of the application
software)
——
The TDS5000B Series Digital Phosphor Oscilloscopes
Specifications and Performance Verification (a PDF file
on the TDS5000B series Product Software CD )
071-1420-xx
The TDS5000B Programmer Online Guide (files on the
TDS5000B series Product Software CD)
——
Getting Started with OpenChoicet Solutions Manual
with CD
020-2513-xx
Optional Applications Software for Tektronix WindowsBased TDS Instruments CD-ROM and manuals
020-2450-xx
Calibration Certificate Documenting NIST Traceability,
Z540-1 Compliance, and ISO9001 Registration
——
One 500 MHz, 10x passive probe per channel
P5050
TDS5000B Series Quick Start User Manual
Getting Started
Accessory
Tektronix
part number
Optical Wheel Mouse
119-6936-xx
Front Cover
200-4651-xx
Snap-on Accessory Pouch
061-1935-xx
30 day evaluation copy of MATLAB
063-3609-xx
30 day evaluation copy of LabVIEW
020-2476-xx
Power Cord
TDS5000B Series Quick Start User Manual
North America (Option A0)
161-0104-00
Universal Euro (Option A1)
161-0104-06
United Kingdom (Option A2)
161-0104-07
Australia (Option A3)
161-0104-05
240V North America (Option
A4)
161-0104-08
Switzerland (Option A5)
161-0167-00
Japan (Option A6)
161-A005-00
China (Option A10)
161-0306-00
No power cord or AC adapter (Option A99)
——
7
Getting Started
Operating Requirements
1. Place the instrument on a cart or
bench, observing clearance requirements:
H
Top, Rear, Front, and Right
Side: 0 in (0 mm)
H
Left Side: 3 in (76 mm)
H
Bottom: 0.75 in (19 mm)
minimum or 0 in (0 mm)
standing on feet, flip stand
down
19.00 in
(482.00 mm)
10.47 in
(265.94 mm)
2. Before operating, ensure that the
ambient temperature is between
+41 °F to +113 °F (+5 °C to
+45 °C).
CAUTION. To ensure proper cooling, keep the bottom and sides of the instrument clear of obstructions.
Powering On the Instrument
Power Supply Requirements
Source voltage and Frequency
100 –240 VRMS ±10%, 47–63 Hz or 115 VRMS ±10%, 360–440 Hz
Power Consumption
< 220 watts
1
8
2
TDS5000B Series Quick Start User Manual
Getting Started
Powering Off the Instrument
1
Removing the Power
1
TDS5000B Series Quick Start User Manual
9
Getting Started
Creating an Emergency Startup Disk
Create an emergency startup disk that you can use to restart your instrument in case of a major hardware or
software failure. Store this disk in a safe place.
1. Select File > Minimize.
1
2. Select Start > Programs > Accessories > System Tools > Backup.
2
3. Select Emergency Repair Disk
and follow the on-screen instructions.
3
Connecting to a Network
You can connect your instrument to a
network for printing, file sharing,
internet access, and other functions.
Consult with your network administrator and use the standard Windows
utilities to configure the instrument for
your network.
10
TDS5000B Series Quick Start User Manual
Getting Started
Adding a Second Monitor
You can operate the instrument while using Windows and installed applications on an external monitor. Use the
Settings tab in the Windows Display Properties dialog box to set up a dual-monitor configuration. Both the
oscilloscope and the second monitor must have the color setting set to True Color.
External monitor
1
2
3
5
4
6
9
7
8
TDS5000B Series Quick Start User Manual
11
Getting Started
10. Select the second monitor.
11. Select Extend my Windows desktop onto this monitor. Make sure
that both monitors are set to True
Color.
12. Click Apply, and then click OK.
10
11
12
12
TDS5000B Series Quick Start User Manual
Getting Started
Changing the Windows Language
Use the following procedure to change the Windows language from English to one of your choice. This
procedure does not change the language of the user interface or the online help in the TekScope application.
Before you begin, minimize the TekScope application.
1. Select Settings and then select
Control Panel.
1
2. Select Regional Options.
2
3. Select your locale, and then select
your menus and dialogs language.
4. Click Set default....
3
4
5. Select locale.
5
TDS5000B Series Quick Start User Manual
13
Getting Started
6. Click Add to add the input locale.
6
7. Select the Input locale and Keyboard layout/IME.
7
8. Select the Installed input locale,
and click Set as Default.
9. Click OK.
8
9
10. Click Yes in each dialog box.
10
14
TDS5000B Series Quick Start User Manual
Getting Started
Getting Acquainted with Your Instrument
Front Panel
Floppy disk drive
CD-RW drive
Control panel
Ground terminal
Channel inputs
On/Standby
switch
Probe comp terminals
Auxiliary input
Side and Rear Panels
Side panel
Keyboard
COM 1
Note. Plug USB devices directly into the
USB connectors on the instrument to
imporve reliability rather than connecting
the devices serially. If the instrument front
panel and /or touch screen do not
respond, press the On/Standby switch for
5 seconds to cycle power.
Parallel Port
Video (Extended Desktop)
USB (Mouse)
LAN
Audio line in
Audio line out
Microphone in
GPIB
Scope VGA Output
Rear panel
Timebase reference input (EXT REF)
CH 3 signal output (SIGNAL OUT)
Trigger signal output (AUX OUT)
TDS5000B Series Quick Start User Manual
15
Getting Started
Interface and Display
The menu bar mode provides access to commands that control all of the instrument features and functions. The
toolbar mode provides access to the most common features.
Menu Bar: Access to data I/O, printing, online help, and instrument functions
Buttons/Menu. Click
to toggle between
toolbar and menu bar
modes
Status Bar: Display of
acquisition status, mode, and
number of acquisitions; trigger
status; date; and time
Display: Live, reference, and
math waveforms display here,
along with cursors
Multipurpose Knob
Readouts. Adjust and
display parameters
controlled by the
multipurpose knobs
Waveform Handle: Click and drag
to change vertical position of
waveform. Click the handle and
change the position and scale
using the multipurpose knobs
Controls Status: Quick reference to vertical, horizontal, and
trigger selections, scale, and parameters
Readouts: Display cursor and
measurement readouts in this area.
Measurements are selectable from
the menu bar or toolbar. If a control
window is displayed, these readouts
move to the graticule area
Drag cursors to measure waveforms on screen
Drag the position icons to
reposition a waveform
Click the icon to assign the
multipurpose knobs to
waveform vertical position and
scale
Buttons/Menu. Click
to toggle between
toolbar and menu bar
modes
Drag icon to change
the trigger level
Drag across the waveform area to
create a box for zooming,
enabling/disabling histograms,
and gating measurements
16
TDS5000B Series Quick Start User Manual
Getting Started
Control Panel
Use these buttons to start and stop acquisition or start a single acquisition sequence. The
ARM, READY, and TRIG’D lights show the acquisition status. Page 44.
Turn the knob to adjust waveform intensity. Page 50.
Push FastAcq to turn Fast Acquisition on or off. Page 35.
Use these knobs and buttons to set trigger parameters. Push ADVANCED to
display additional trigger functions. Page 42.
Push CURSORS to turn cursors on or off. Page 71.
Push PRINT to make a hard copy. Page 99.
Push DEFAULT SETUP to return settings to factory-default values. Page 24.
Horizontally scale, position, delay, and set record length resolution. Page 47.
Push AUTOSET to automatically set up the vertical,
horizontal, and trigger controls based on selected channels.
Page 25.
Turn the multipurpose knobs to adjust parameters selected
from the screen interface. Push a Fine button to toggle
between normal and fine adjustment with the corresponding
multipurpose knob.
Push MultiView Zoom to add a magnified graticule to the
display. Push HORIZ or VERT to assign the multipurpose
knobs to the horizontal or vertical scale and position
parameters. Page 59.
Push to turn the optional touch screen on and off.
Turn the channel displays on and off. Vertically scale,
position, or change the input termination.
TDS5000B Series Quick Start User Manual
17
Getting Started
Accessing Online Help
In-depth information is available in the online help on all the features of your instrument.
To access context-sensitive help on
the current setup, select Help > Help
on Window... or press F1.
1. To access any topic in the help
system, select Help > Contents
and Index....
1
2
2. Use the Contents, Index, or Find
tab to select the topic, and then
click Display.
To navigate within the help system
you can:
18
H
Click an outlined control
shown in the help window to
receive more specific
information about the
control.
H
Click a tab in a help window
to navigate between the
Overview and specific topics.
H
Click Minimize in a help
window to move help out of
the way so you can operate
the instrument.
H
Click Restore Help to see the
last help topic again.
TDS5000B Series Quick Start User Manual
Getting Started
Accessing Menus and Control Windows
You can access menus and control windows using the following techniques:
H
Click a menu, and then select a
command.
H
For a shortcut menu, right-click
anywhere in the graticule or on an
object. The shortcut menu is
context sensitive and varies with
the area or object where you
right-clicked. Some examples are
shown in the figure at right.
Right-click
Acquisition mode
Right-click Math
waveform handle
H
Right-click
Graticule
Right-click
Trigger readout
Right-click
Trigger level
Right-click
Statistics
In the toolbar mode (see page 16)
click a button to quickly access a
setup control window.
TDS5000B Series Quick Start User Manual
19
Getting Started
Inspect Your Instrument
Use the following procedures to verify the functionality of your instrument.
Verify Internal Diagnostics Pass
1. Prerequisites: instrument powered on for 20 minutes.
1
2. Select Instrument Diagnostics....
2
3. Click Run. The test results appear
in the diagnostics control window.
3
4. Verify that all tests pass. If diagnostic failures occur, contact your
local Tektronix service personnel.
4
20
TDS5000B Series Quick Start User Manual
Getting Started
Signal Path Compensation
Use this procedure if the temperature has changed more than 5° C since the last signal path compensation.
When making measurements at vertical scale settings less than or equal to 5 mV/div, perform the signal path
compensation once a week. Failure to do so may result in the instrument not meeting warranted performance
levels at those volts/div settings.
1. Prerequisites: instrument powered on for 20 minutes, and all input signals removed.
1
2. Select Instrument Calibration.
2
3. If the status is Warm-up, wait until the status changes to Temp.
Then click Calibrate to start the
calibration. Calibration may take
10 to 15 minutes.
3
NOTE. Signal Path Compensation is the only calibration that is accessible to you.
4. If after calibration the status indicator does not display Pass, recalibrate the instrument, or have
the instrument serviced by qualified service personnel.
TDS5000B Series Quick Start User Manual
4
21
Getting Started
22
TDS5000B Series Quick Start User Manual
Operating Basics
This section contains concepts of and procedures for using the acquisition and trigger systems, information on
displaying and analyzing waveforms, and procedures for using MyScope and storing information on your
instrument. Detailed information on these topics can be found in the online help.
Acquisition
This section contains concepts of and procedures for using the acquisition system. Detailed information is
available in the online help.
Setting Up Signal Input
Use front-panel buttons to set up your instrument to acquire the signal.
1. Connect the probe to the input
signal source.
1
2. Select the input channel and termination by pushing the frontpanel buttons.
TDS5000B Series Quick Start User Manual
2
23
Operating Basics
3. Press Autoset.
3
4
4. Adjust the vertical position and
scale using the front-panel knobs.
5. Adjust the horizontal position and
scale using the front-panel knobs.
The horizontal position determines the
number of pretrigger and posttrigger
samples.
5
The horizontal scale determines the
size of the acquisition window relative
to the waveform. You can scale the
window to contain a waveform edge, a
cycle, or several cycles.
Quick Tip
H
Right-click the waveform handle to quickly select input coupling, offset, invert the waveform, or make other
changes.
Using Default Setup
1. To quickly return to the factory
default settings, push DEFAULT
SETUP.
24
1
TDS5000B Series Quick Start User Manual
Operating Basics
Using Autoset
Use Autoset to quickly and automatically set up the instrument (acquisition, horizontal, trigger, and vertical)
based on the characteristics of the input signal. Autoset makes adjustments to the signal such that the
waveform displays two or three cycles with the trigger near the midlevel.
1. Connect the probe, and then select the input channel as shown
on page 23.
2
2. Push the AUTOSET button to execute an Autoset.
3. The Autoset Undo control window
opens automatically after an
Autoset operation. Click Undo if
you want to undo the last Autoset. Parameters that are not affected by Autoset retain their settings.
3
Quick Tips
H
To position the waveform appropriately, Autoset may change the vertical position. Autoset always sets
vertical offset to 0 V.
H
If you use Autoset when one or more channels are displayed, the instrument selects the lowest numbered
channel for horizontal scaling and triggering. You can individually control the vertical scaling of each
channel.
H
If you use Autoset when no channels are displayed, the instrument turns on channel one (CH 1) and scales
it.
H
The Autoset Undo control window remains on the screen until you open another control window. After
Autoset Undo closes, you can still undo the last Autoset by selecting the Undo Last Autoset command from
the Edit menu. Although the last Autoset is immediately undone, the Autoset Undo control window does not
open again.
H
You can stop the Autoset Undo control window from opening automatically by changing the User
Preferences in the Utilities menu.
TDS5000B Series Quick Start User Manual
25
Operating Basics
Probe Compensation
To properly compensate your passive probe:
1. Connect the probe to channel 1.
2. Attach the probe tip and reference
lead to the PROBE COMP connector. If using the probe hook-tip,
ensure a proper connection by
firmly twisting the tip onto the
probe.
2
1
3. Push AUTOSET.
4. Check the shape of the displayed
waveform to determine if your
probe is compensated correctly.
3
4
Properly compensated
Under compensated
Over compensated
5. If necessary, adjust your probe.
Repeat as needed.
5
26
TDS5000B Series Quick Start User Manual
Operating Basics
Acquisition Concepts
Acquisition Hardware
Before a signal can be displayed, it must pass through the input channel where it is scaled and digitized. Each
channel has a dedicated input amplifier and digitizer. Each channel produces a stream of digital data from which
the instrument extracts waveform records.
Sampling Process
Acquisition is the process of sampling
an analog signal, converting it into
digital data, and assembling it into a
waveform record, which is then stored
in acquisition memory.
+5.0 V
+5.0 V
0V 0V 0V 0V
Input signal
Sampled points
-5.0 V
-5.0 V
Digital values
Real-time Sampling
In real-time sampling, the instrument
digitizes all of the points it acquires
using one trigger event. Always use
real-time sampling to capture singleshot or transient events.
Record points
Sampling rate
Equivalent-time Sampling
The instrument uses equivalent-time
sampling to extend its sample rate
beyond its real-time maximum
sampling rate. Equivalent-time
sampling is only used if Equivalent
Time is selected and the time base is
set to a sampling rate that is too fast
to create a waveform record using
real-time sampling.
The instrument makes multiple
acquisitions of a repetitive waveform
to obtain the sample density required
for one complete waveform record.
Thus, equivalent time sampling should
only be used with repetitive signals.
TDS5000B Series Quick Start User Manual
Record points
1st acquisition cycle
2nd acquisition cycle
3rd acquisition cycle
nth acquisition cycle
27
Operating Basics
Waveform Record
The instrument builds the waveform
record through use of the following
parameters:
H
28
Sample interval: The time
between sample points.
H
Record length: The number of
samples required to fill a
waveform record.
H
Trigger point: The zero time
reference in a waveform record.
H
Horizontal position: When
horizontal delay is off, the
horizontal position is a
percentage of the waveform
record between 0 and 99.9
percent. The trigger point and the
horizontal reference are at the
same time in the waveform
record. For example, if the
horizontal position is 50 percent,
then the trigger point is in the
middle of the waveform record.
When horizontal delay is on, the
time from the trigger point to the
horizontal reference is the
horizontal delay.
Sample interval
First sampled and digitized
point in record
Trigger
point
Horizontal
reference
Horizontal
delay
Horizontal
position
Horizontal
acquisition
window
TDS5000B Series Quick Start User Manual
Operating Basics
Interpolation
Your instrument can interpolate between the samples it acquires when it does not have all of the actual samples
it needs to fill the waveform record. Linear interpolation computes record points between actual acquired
samples by using a straight line fit.
Sin(x)/x interpolation computes record points using a curve fit between the actual values acquired. Sin(x)/x
interpolation is the default interpolation mode because it requires fewer actual sample points than linear
interpolation to accurately represent the waveform.
Quick Tip
H
Use the display style Intensified Samples to intensify the real samples and dim the interpolated samples,
see page 48.
Interleaving
The instrument can interleave its channels to attain higher digitizing rates and longer record length when only 1
or 2 channels are turned on without equivalent-time sampling. The instrument applies the resources of unused
channels to sample those that are in use. The following table lists how interleaving extends the maximum
digitizing rate and record length.
NOTE. Only record length interleaving is available on the TDS5054BE. The maximum sample rate on the
TDS5054BE is 1 GS/s regardless of the number of channels in use.
Number of channels in use
Maximum digitizing rate
Maximum record length
One
5 GS/s
4 M (16 M with Option 1M)
Two
2.5 GS/s
2 M (8 M with Option 1M)
Three or Four
1.25 GS/s
1 M (4 M with Option 1M)
TDS5000B Series Quick Start User Manual
29
Operating Basics
How the Acquisition Modes Work
Sample mode retains the first
sampled point from each acquisition
interval. Sample is the default mode.
record duration
acquisition interval =
number of points in record
Interval
1
2
3
Displayed record points (at
maximum horizontal
magnification)
Interval
1
4
2
3
4
Sample
Peak Detect mode uses the highest
and lowest of all the samples contained in two consecutive acquisition
intervals. This mode only works with
real-time, noninterpolated sampling
and is useful for catching high
frequency glitches.
Peak Detect
Hi Res mode calculates the average of
p for each acquisition
q
all the samples
interval. Hi-Res provides a higher-resolution, lower-bandwidth waveform.
Envelope mode finds the highest and
lowest record points over many
acquisitions. Envelope uses Peak
Detect for each individual acquisition.
Hi Res
Three acquisitions from one source
Acquisition
1
2
3
Envelope
Average mode calculates the average
value for each record point over many
acquisitions. Average uses Sample
mode for each individual acquisition.
Use average mode to reduce random
noise.
30
Average
TDS5000B Series Quick Start User Manual
Operating Basics
Waveform Database mode is a
three-dimensional accumulation of
source waveform data over several
acquisitions. In addition to amplitude
and timing information, the database
includes a count of the number of
times a specific waveform point (time
and amplitude) has been acquired.
1
2
3
4
Changing the Acquisition Mode
Use this procedure to change the acquisition mode.
1. Select Horiz/Acq > Acquisition
Mode.
1
2. To select an acquisition mode do
one of the following:
H
Select an acquisition mode
directly from the menu.
H
Click Mode..., and then
select an acquisition mode.
2
3. For Average or Envelope acquisition modes, click the # of Wfms
control, and then set the number
of waveforms with the multipurpose knob. For WfmDB mode
click the Samples control and
then set the number of samples
with the multipurpose knob.
You can also click the keyboard icon
and use the pop-up keypad to set the
number of waveforms or samples.
TDS5000B Series Quick Start User Manual
3
31
Operating Basics
Starting and Stopping an Acquisition
After you have a waveform displayed and the channels you want to acquire are selected, use the following
procedure.
1. Press the front-panel RUN/STOP
button to start the acquisition.
32
1
2. Press the RUN/STOP button again
to stop the acquisition.
2
3. To take a single acquisition, press
the Single button.
3
TDS5000B Series Quick Start User Manual
Operating Basics
Using Roll Mode
Roll mode gives a display similar to a strip chart recorder for low-frequency signals. Roll mode lets you see
acquired data points without waiting for the acquisition of a complete waveform record.
1. Select Horiz/Acq > Horizontal/Acquisition Setup....
1
2. Click Auto to turn on Roll mode.
NOTE: Roll mode requires Sample,
Peak Detect, or Hi Res acquisition
mode.
2
3. To stop acquisitions in Roll mode:
H
H
If you are not in Single
Sequence, push RUN/STOP
to stop Roll mode.
3
If you are in Single
Sequence, Roll mode
acquisitions stop
automatically when a
complete record is acquired;
that is, when the waveform
reaches the left edge of the
screen.
Quick Tips
H
Switching to Envelope, Average, or WfmDB acquisition mode will turn off Roll mode.
H
Roll mode is disabled when you set the horizontal scale to 20 ms per division or faster. At record lengths
greater than 10,000 points, the time per division to turn off Roll mode is slower.
TDS5000B Series Quick Start User Manual
33
Operating Basics
Using Fast Acquisitions
Unlike digital storage oscilloscopes (DSOs) that have long dead times between acquisitions, Digital Phosphor
Oscilloscopes (DPOs) are capable of acquiring waveforms at rates comparable to analog oscilloscopes.
Fast Acquisitions mode reduces the dead time between waveform acquisitions that occur in normal acquisition
mode. This enables Fast Acquisitions mode to capture and display transient events, such as glitches or runt
pulses, often missed during longer dead times that are a part of normal acquisition in a DSO.
FastAcq continuously overlays the
acquired information into a three-dimensional database that is updated on
the display 30 times per second. For
each pixel in the display, the intensity
(or color) of the pixel is proportional
to the number of actual samples that
the pixel represents.
Analog Real time sweeps
Digital Storage acquisitions (DSO)
Digital Phosphor acquisitions (DPO)
34
TDS5000B Series Quick Start User Manual
Operating Basics
Fast Acquisitions mode can display waveform phenomena at an intensity that reflects the rate of occurrence.
Fast XY and XYZ modes also provide intensity information by accepting continuous, nontriggered data from the
input channels. Turn Fast Acquisitions on to acquire up to 100,000 waveforms per second.
1. To start Fast Acquisition, do one
of the following:
H
Push the front-panel FastAcq
button.
H
Select Horiz/Acq > Fast
Acquisitions.
2. Adjust the intensity to optimize
the color grading of the signal
that you want to analyze by doing
one of the following:
H
Use the front-panel
INTENSITY knob.
H
Select Display >
Appearance..., and then
select FastAcq/WfmDB. Use
the multipurpose knobs to
change the intensity.
TDS5000B Series Quick Start User Manual
1
2
35
Operating Basics
3. Turn AutoBright on or off. On automatically sets the maximum intensity to the value of the most
frequent event. Off creates a display like an analog oscilloscope.
The displayed brightness depends
on the trigger rate.
2
3
4. To show more detail than other
color palettes when using FastAcq
mode, select Colors, and then select Temp or Spectral color palettes from the Fast/Acq WfmDB
Palette. Temp displays frequently
occurring events in red shades
and infrequent events are displayed in blue and green shades.
Spectral displays events exactly
the opposite of Temp.
4
Quick Tips
36
H
Use FastAcq mode when you want to acquire data at exceptionally fast rates. FastAcq mode combines the
data from all trigger events into a single pixel map.
H
FastAcq mode only works with Sample acquisition mode. Turning on FastAcq while in any acquisition mode
other than Sample, causes the instrument to switch to Sample acquisition mode.
H
Increase the intensity to make less frequently acquired points brighter in the display.
TDS5000B Series Quick Start User Manual
Operating Basics
Using FastFrame Mode
FastFrame allows you to capture many trigger events as single records in a larger record, and then view and
measure each record individually. Time Stamps display the absolute trigger time for a specific frame and the
relative time between triggers of two specified frames.
1. Push AUTOSET to set the horizontal, vertical, and trigger controls or set the controls manually.
1
2. Select Horiz/Acq > FastFrame
Setup....
2
3. Click FastFrame On.
4. Select Rec Length and Frame
Count. Then use the multipurpose
knobs to set each one. Frame
count represents the number of
trigger events that will be captured. Record length is the number of samples that will be stored
with each trigger event (or
frame.) The frame count will be
reduced if there is insufficient
memory to store all the records.
TDS5000B Series Quick Start User Manual
3
4
37
Operating Basics
5. Use the Frame Viewing controls
to select the frame that you want
to view.
5
6. To view multiple frames superimposed over each other, select
Overlay.
6
7. Use the Time Stamps controls to
select the source for, and frame
number of, the reference frame.
The reference frame is the starting point when measuring the relative time between two frames.
7
Quick Tips
38
H
Use FastFrame when you want to preserve the data associated with each trigger event for further analysis
or visual inspections.
H
Multiple frames are best viewed with the Normal, Green, or Gray color palettes because the dark blue
selected frame may be hard to distinguish if you use Temp or Spectral.
H
You can quickly set the Selected Frame and Reference Frame for time stamping by selecting FastFrame
Controls... from the Horiz/Acq menu.
H
Use FastFrame when you want to capture multiple events that have long dead times between them that are
of no interest to you.
TDS5000B Series Quick Start User Manual
Operating Basics
Triggers
This section contains concepts and procedures for using the trigger system. Detailed information is available in
the online help.
Triggering Concepts
Trigger Event
The trigger event establishes the time-zero point in the waveform record. All waveform record data are located
in time with respect to that point. The instrument continuously acquires and retains enough sample points to fill
the pretrigger portion of the waveform record (that part of the waveform that is displayed before, or to the left
of, the triggering event on screen). When a trigger event occurs, the instrument starts acquiring samples to
build the posttrigger portion of the waveform record (displayed after, or to the right of, the trigger event). Once
a trigger is recognized, the instrument will not accept another trigger until the acquisition is complete and the
holdoff time has expired.
Trigger Types
Edge triggers are the simplest and most commonly used trigger type, used with both analog and digital signals.
An edge trigger event occurs when the trigger source passes through a specified voltage level in the specified
direction (rising or falling signal voltage).
Pulse triggers are special-purpose triggers that are primarily used with digital signals. The following types of
pulse triggers are available: Glitch, Runt, Window, Width, Transition, and Timeout. Pulse triggers are available
on the main trigger only.
Logic triggers are special-purpose triggers that are primarily used with digital logic signals. Two of the types,
Pattern and State, trigger the instrument based on the Boolean operator you select for the trigger sources. A
third type, Setup and Hold, triggers when Data on one trigger source changes state within the setup and hold
times that you specify relative to a Clock on another trigger source. Logic triggers are available on the main
trigger only.
Communication triggers (available only with Option SM) are used on communication signals. Mask testing
automatically uses Communication triggers.
Video triggers are used to trigger the instrument on specified fields or lines of a video signal. You can use one
of several preset video signal formats or set a custom format.
TDS5000B Series Quick Start User Manual
39
Operating Basics
Trigger Modes
The trigger mode determines how the instrument behaves in the absence of a trigger event:
H
Normal trigger mode enables the instrument to acquire a waveform only when it is triggered. If no trigger
occurs, the last waveform record acquired remains on the display. If no last waveform exists, no waveform
is displayed.
H
Auto trigger mode enables the instrument to acquire a waveform even if a trigger does not occur. Auto
mode uses a timer that starts after a trigger event occurs. If another trigger event is not detected before the
timer times out, the instrument forces a trigger. The length of time it waits for a trigger event depends on
the time base setting.
Auto mode, when forcing triggers in the absence of valid triggering events, does not synchronize the waveform
on the display. The waveform will appear to roll across the screen. If valid triggers occur, the display will
become stable.
You can also force the instrument to trigger with an edge trigger by clicking the Force Trigger button on the
Trigger Setup control window.
Trigger Holdoff
Trigger holdoff can help stabilize triggering. When the instrument recognizes a trigger event, it disables the
trigger system until acquisition is complete. In addition, the trigger system remains disabled during the holdoff
period that follows each acquisition. Adjust holdoff to obtain stable triggering when the instrument is triggering
on undesired trigger events.
Trigger Coupling
Trigger coupling determines what part of the signal is passed to the trigger circuit. Edge triggering can use all
available coupling types: AC, DC, Low Frequency Rejection, High Frequency Rejection, and Noise Rejection. All
other trigger types use DC coupling only.
40
TDS5000B Series Quick Start User Manual
Operating Basics
Horizontal Position
Horizontal position is an adjustable feature that defines where the trigger occurs on the waveform record. It lets
you choose how much the instrument acquires before and after the trigger event. The part of the record that
occurs before the trigger is the pretrigger portion. The part that occurs after the trigger is the posttrigger
portion.
Pretrigger data can be valuable when troubleshooting. For example, if you are trying to find the cause of an
unwanted glitch in your test circuit, you can trigger on the glitch and make the pretrigger period large enough to
capture data before the glitch. By analyzing what happens before the glitch, you may uncover information that
helps you find the source of the glitch. Alternatively, if you want to see what is happening in your system as a
result of the trigger event, make the posttrigger period large enough to capture data after the trigger.
Slope and Level
The slope control determines whether the instrument finds the trigger point on the rising or the falling edge of a
signal. The level control determines where on that edge the trigger point occurs.
Delayed Trigger System
You can trigger with the A (Main) trigger system alone or you can combine the A (Main) trigger with the B
(Delayed) trigger to trigger on sequential events. When using sequential triggering, the A trigger event arms the
trigger system, and the B trigger event triggers the instrument when the B trigger conditions are met. A and B
triggers can (and typically do) have separate sources. The B trigger condition can be based on a time delay or a
specified number of events. See Using A (Main) and B (Delayed) Triggers on page 45 to learn how to use the
delayed trigger system.
TDS5000B Series Quick Start User Manual
41
Operating Basics
Choosing a Trigger Type
Your instrument allows you to modify basic trigger parameters from the front panel or set up more advanced
triggers in the Trigger Setup control window.
1. Push EDGE.
2. Set the source, coupling, slope
and mode with these front-panel
controls.
3. To select one of the other trigger
types, do one of the following:
H
Push ADVANCED
H
Select a trigger type directly
from the Trig menu.
1
3
2
3
4. Complete the trigger setup using
the controls displayed for the trigger type. The controls to set up
the trigger vary depending on the
trigger type.
4
Quick Tips
H
42
For preset trigger levels see User Preferences in the Utility menu.
TDS5000B Series Quick Start User Manual
Operating Basics
Trigger Selections
Trigger Type
Trigger Conditions
Edge
Trigger on a rising or falling edge, as defined by the slope control. Coupling choices
are DC, AC, LF Reject, HF Reject, and Noise Reject.
Glitch
Trigger on a pulse narrower (or wider) than the specified width or ignore glitches
narrower (or wider) than the specified width.
Width
Trigger on pulses that are inside or outside a specified time range. Can trigger on
positive or negative pulses.
Runt
Trigger on a pulse amplitude that crosses one threshold but fails to cross a second
threshold before recrossing the first. Can detect positive or negative runts, or only
those wider than a specified width. These pulses can also be qualified by the logical
state of other channels (four-channel models only).
Window
Trigger when the input signal rises above an upper threshold level or falls below a
lower threshold level. Trigger the instrument as the signal is entering or leaving the
threshold window. Qualify the trigger event in terms of time by using the Trigger
When Wider option, or by the logical state of other channels using the Trigger When
Logic option (four-channel models only).
Timeout
Trigger when no pulse is detected within a specified time.
Transition
Trigger on pulse edges that traverse between two thresholds at faster or slower
rates than the specified time. The pulse edges can be positive or negative.
Video
Trigger on specified fields or lines of a composite video signal. Only composite
signal formats are supported.
Pattern
Trigger when logic inputs cause the selected function to become True or False. You
can also specify that the logic conditions must be satisfied for a specific amount of
time before triggering.
State
Trigger when all of the logic inputs to the selected logic function cause the function
to be True or False when the clock input changes state.
Setup/
Hold
Trigger when a logic input changes state inside of the setup and hold times relative
to the clock.
Comm
Trigger in conjunction with mask testing on communications codes and standards.
The controls work together to define the parameters for the trigger event.
TDS5000B Series Quick Start User Manual
43
Operating Basics
Checking Trigger Status
You can check the trigger status from the status lights on the front panel or from the acquisition readout.
Check the ARM, READY, and TRIG’D
front-panel controls to determine the
trigger status.
H
If TRIG’D is on, the instrument
has recognized a valid trigger and
is filling the posttrigger portion of
the waveform.
H
If READY is on, the instrument
can accept, and is waiting for, a
valid trigger to occur. Pretrigger
data has been acquired.
H
If ARM is on, the trigger circuitry
is filling the pretrigger portion of
the waveform record.
H
If both TRIG’D and READY are on,
a valid A event trigger has been
recognized and the instrument is
waiting for a delayed trigger.
When a delayed trigger is
recognized, the posttrigger
portion of the delayed waveform
will fill.
H
If ARM, TRIG’D, and READY are
off, acquisitions have stopped.
To quickly determine the settings of
some key trigger parameters, check
the Trigger readout at the bottom of
the display. The readouts differ for
edge and the advanced triggers.
Time base
Trigger level
Trigger slope = rising edge
A trigger source = Ch 1
44
TDS5000B Series Quick Start User Manual
Operating Basics
Using A (Main) and B (Delayed) Triggers
You can use the A Event (Main) trigger for simple signals or combine it with the B Event (Delayed) trigger to
capture more complex signals. After the A Event occurs, the trigger system looks for the B Event before
triggering and displaying the waveform.
1. Select Trig > A Event (Main) Trigger Setup....
1
2. Set the A trigger type and source
in the A Event (Main) tab.
2
3. Choose a function in the A→B Seq
tab.
4. Set the trigger delay time or the
number of B events, as appropriate.
3
4
5. Set the B trigger characteristics in
the B Event (Delayed) tab.
5
6. Select Normal Trigger Mode.
6
TDS5000B Series Quick Start User Manual
45
Operating Basics
Trigger on B Event
The A trigger arms the instrument.
Posttrigger acquisition starts on the
nth B event.
Pretrigger record
Posttrigger record
Acquired
waveform record
A trigger point
A trigger source
B trigger source
Waiting for the nth event
(Where n=5)
B trigger point
B Trigger After Delay Time
The A trigger arms the instrument.
Posttrigger acquisition starts on the
first B edge after the trigger delay
time.
A trigger point
A trigger source
B trigger source
Trigger
delay
time
B trigger point
Quick Tips
46
H
B-trigger delay time and horizontal delay time are independent functions. When you establish a trigger
condition using either the A trigger alone or the A and B triggers together, you can also use horizontal delay
to delay the acquisition by an additional amount.
H
When using the B trigger, the A trigger can be any of the following types: Edge, Glitch, Width, or Timeout.
The B trigger type is always Edge type.
TDS5000B Series Quick Start User Manual
Operating Basics
Sending E-mail on Trigger
You must configure e-mail on event (see page 85) before performing the following procedure.
1. Select Trig > A Event (Main) Trigger Setup....
1
2. Select the Mode tab.
2
3
3. Under E-mail on Trigger, click On,
and then click Setup. See page 85
for setup procedure.
Using Horizontal Delay
Use horizontal delay to acquire
waveform detail in a region that is
separated from the trigger location by
a significant interval of time.
Trigger
point
Acquired
waveform
Delay time
Expansion point
1. Push DELAY.
2. Adjust the delay time with the
horizontal POSITION control, or
enter the delay time in the control
window.
3. Adjust the horizontal SCALE to
acquire the detail that you need
around the delay expansion point.
1
2
3
Quick Tips
H
Use Zoom and Horizontal Delay together to magnify a delayed acquisition.
H
Toggle Horizontal Delay on and off to quickly compare signal details at two different areas of interest, one
near the trigger location and the other centered at the delay time.
TDS5000B Series Quick Start User Manual
47
Operating Basics
Display a Waveform
This section contains concepts and procedures for displaying a waveform. Detailed information is available in
the online help.
Setting the Display Style
To set the display style select Display
> Display Style, and then select one
of the following styles:
Displays waveforms with
lines drawn between
record points.
Displays waveform record points as dots on
the screen.
Displays the actual samples as intensified dots.
Interpolated points are
shown in the waveform
color.
48
TDS5000B Series Quick Start User Manual
Operating Basics
Setting the Display Persistence
Select Display > Display Persistence,
and then select the type of persistence.
H
No persistence shows record
points for the current acquisition
only. Each new waveform record
replaces the previously acquired
record for a channel.
H
Infinite persistence continuously
accumulates record points until
you change one of the acquisition
display settings. Use for
displaying points that may occur
outside the normal acquisition
envelope.
H
Variable persistence accumulates
record points for a specified time
interval. Each record point decays
independently according to the
time interval.
1. To set the variable persistence
time, select Display > Display
Persistence > Persistence Controls....
2. Click Persist Time, and then use
the multipurpose knobs to set the
persistence time.
1
2
Quick Tip
H
You can right-click anywhere in the graticule and select Display Persistence from the shortcut menu.
TDS5000B Series Quick Start User Manual
49
Operating Basics
Using AutoBright
1. Select Display > Display Setup....
2. Click AutoBright On to simulate
the appearance of analog oscilloscope signals.
3. Use the front-panel INTENSITY
knob to manually adjust the display intensity when AutoBright is
Off.
1
3
2
Quick Tips
H To simulate the appearance of analog oscilloscope signals turn AutoBright off.
H Turn AutoBright on to make waveforms visible even at low trigger repetition rates.
50
TDS5000B Series Quick Start User Manual
Operating Basics
Setting the Display Format
The instrument can display waveforms in three different formats. Choose the format that best suits your needs.
Select Display > Display Format.
H
Select Y-T format to show a
signal amplitude as it varies over
time.
H
Select X-Y format to compare the
amplitude of CH 1 (X) and Ch 2
(Y) waveform records point by
point.
H
XYZ format is the same as XY
except the displayed waveform
intensity is modulated by the
CH 3 (Z) waveform record. XYZ
format is available only on
4-channel models.
Quick Tips
H
XY format is particularly useful for studying phase relationships such as Lissajous Patterns.
H
XY format is a dot-only display, although it can have persistence. The Vector style selection has no effect
when you select XY format.
TDS5000B Series Quick Start User Manual
51
Operating Basics
Selecting the Waveform Interpolation
Select Display > Waveform Interpolation, and then select one of the
following:
H
Sin(x)/x interpolation computes
record points using a curve fit
between the actual samples
acquired.
H
Linear interpolation computes
record points between actual
acquired samples by using a
straight line fit.
Quick Tips
H
52
Sin(x)/x interpolation is the default interpolation mode because it requires fewer actual sample points than
linear interpolation to accurately represent the waveform.
TDS5000B Series Quick Start User Manual
Operating Basics
Adding Screen Text
1. Select Display > Screen Text to
access the Screen Text Setup
control window.
1
2. Enter up to eight lines of text to
provide notes for screen shots,
printouts, or other users.
3. Click Display to turn the text display on and off.
3
2
4. Click Properties to open the Text
Properties control window for
positioning of the text on the display.
4
5
5. Click Clear to erase the entire text
of the selected line.
Quick Tips
H
You can click and drag screen text to reposition it on the screen.
H
To add text, right-click anywhere in the graticule, and then select Add Screen Text....
TDS5000B Series Quick Start User Manual
53
Operating Basics
Setting the Graticule Style
To set the graticule style select
Display > Graticule Style, and then
select one of the following styles:
Use for quick estimate of
waveform parameters.
Use for full-screen measurements with cursors
and automatic readouts
when cross hairs are not
needed.
Use for making quick
estimates of waveforms
while leaving more room
on the display for automatic readouts and other
data.
Use with automatic readouts and other screen
text when display features are not needed.
Use for NTSC video signals.
Use for video signals
other than NTSC.
Quick Tip
H
54
To quickly change the graticule style, right-click anywhere in the graticule and then select Graticule Style
from the shortcut menu.
TDS5000B Series Quick Start User Manual
Operating Basics
Setting the Trigger Level Marker
1. Select Display > Objects....
2. Select one of the following:
H
Short displays a short arrow
on the side of the graticule
by the active waveform.
H
Long displays a horizontal
line across the graticule.
H
Off turns off the trigger level
marker.
2
1
Quick Tip
H
To quickly change the trigger level marker, right-click on the trigger level marker and then select the type of
trigger level marker.
Setting the LCD Backlight
1. Select Display > Objects....
2. Click the LCD Backlight Timeout
to turn the backlight on and off.
2
3. Click Delay to set the delay time
using the multipurpose knobs.
The delay time is in seconds.
1
3
TDS5000B Series Quick Start User Manual
55
Operating Basics
Displaying the Date and Time
1. Select Display > Objects....
2. Toggle the display of the date and
time on the graticule. Use the Utilities menu to set the date and
time.
2
1
Quick Tip
H
To turn off the date display, right-click the date and then select Turn Off Date/Time. You can also set the
date and time from here.
Using the Color Palettes
Select Display > Record View or
FastAcq/WfmDB Palette, and then
select one of the following color
schemes for the waveform and
graticule:
56
H
Normal displays hues and lightness
levels for best overall viewing. The
color of each channel waveform
matches the color of the
corresponding front-panel vertical
SCALE knob.
H
Monochrome Gray displays areas
of the waveform with the highest
sample density in lighter gray
shades. The areas of lowest sample
density appear in darker gray
shades.
TDS5000B Series Quick Start User Manual
Operating Basics
H
Monochrome Green displays areas
of the waveform with the highest
sample density in lighter green
shades. The areas of lowest sample
density appear in darker green
shades. It most closely resembles
analog oscilloscope displays.
H
Temperature Grading displays
areas of the waveform with the
highest sample density in red
shades. The areas of lowest sample
density appear in blue shades.
H
Spectral Grading displays areas of
the waveform with the highest
sample density in blue shades. The
areas of lowest sample density
appear in red shades.
H
User displays the waveform in a
customized color that you define by
hue, lightness, and saturation.
Quick Tips
H
Choose one of the color grading palettes in the Display Colors control window to see different sample
densities represented in different colors.
H
There are two color palettes, one for Record View and one for FastAcq/WfmDB.
TDS5000B Series Quick Start User Manual
57
Operating Basics
Setting the Reference Colors
Select Display > Colors... and then
select one of the following:
H
Default uses the default system
color for reference waveforms.
H
Inherit uses the same color for
the reference waveform as the
original waveform.
Setting Math Colors
Select Display > Colors... and then
select one of the following:
H
Default uses the default system
color for math waveforms.
H
Inherit uses the same color for
the math waveform as the
waveform the math function is
based on.
Quick Tips
H
58
The default color for math and reference waveforms are different for each waveform.
TDS5000B Series Quick Start User Manual
Operating Basics
Using MultiView Zoom
Use the MultiView Zoom function to magnify a waveform vertically, horizontally, or in both dimensions. Zoomed
waveforms can also be aligned, locked, and automatically scrolled. Scale and Position affect only the display,
not the actual waveform data.
1. Push MultiView Zoom to split the
screen and add a zoom graticule.
1
Main graticule
2. Push HORIZ or VERT to select
which axis to magnify in the zoom
graticule. Use the multipurpose
knobs to adjust scale and position
of the magnified waveform.
Zoom graticule
2
3. To adjust the zoom graticule size
select Zoom Graticule Size from
either the Vertical or Horiz/Acq
menus.
4. To turn zoom off, push the frontpanel button.
2
4
3
Quick Tips
H
You can also use the Zoom Setup menu to change the graticule size of the zoomed waveform.
H
Right-click in the zoomed graticule or on the zoom readout for access to a shortcut zoom menu.
TDS5000B Series Quick Start User Manual
59
Operating Basics
Zooming in Multiple Areas
When you want to view and compare multiple areas of one record at the same time use the following procedure.
1. Click and drag a box around the
area of the waveform that you
want to zoom.
2
2. Select Zoom 1 On.
1
3. Click and drag a box around
another area of the waveform that
you want to zoom, and then
select Zoom 2 On.
3
4. To adjust the zoomed area horizontally, click the horizontal
marker below the Zoom box to
select the zoomed area.
5
5. Use the multipurpose knobs to
adjust the horizontal position and
factor of the selected zoom area.
4
Window
6. To adjust the zoomed area vertically, select Vertical > Zoom Setup... and then use the multipurpose knobs to adjust the Vertical
Position and Factor.
60
6
TDS5000B Series Quick Start User Manual
Operating Basics
Quick Tips
H
To clear the zoom area, click Position Factor Reset from the Zoom Setup control window.
H
You can turn each zoom display on and off from the Zoom Setup control window.
H
Push the MultiView Zoom button to toggle all zoom displays on and off.
H
To reposition the zoomed area horizontally, click and drag the horizontal marker at the bottom of the zoom
box.
Lock and Scroll Zoomed Waveforms
1. To use Lock and Scroll select
Zoom Setup... from either the
Vertical or Horiz/Acq menu and
then select the Lock and Scroll
tab.
1
2. To scroll a single zoomed area,
click a Zoom 1-4 button, and then
click an Auto Scroll button.
3. To scroll multiple zoomed areas
simultaneously, click Lock, and
then click the Zoom1-4 buttons
that you want to scroll through.
2
3
Locking the zoomed areas locks in
their relative horizontal position.
Changing the horizontal position of
one locked and zoomed area changes
them all.
Quick Tips
H
When multiple zoom areas are selected but not locked, the zoom area with the highest number will
autoscroll, while the other zoom areas remain stationary.
TDS5000B Series Quick Start User Manual
61
Operating Basics
Analyzing Waveforms
Your instrument features cursors, automatic measurements, statistics, histograms, math, spectral analysis, and
advanced pass/fail tests to assist you in analyzing waveforms. This section contains concepts and procedures
for analyzing waveforms. Detailed information is available in the online help.
Taking Automatic Measurements
1. Select Measure > Measurement
Setup....
2. Select the channel, math or reference waveform that you want to
measure.
1
2
3
3. Using the tabs, select up to 8
measurements in five different
categories.
4. To remove the last measurement,
click Clear.
5. To remove multiple measurements, click and drag to select
the measurements, and then click
Clear.
5
4
You can also choose a measurement
for the selected waveform directly in
the Measure menu. The available
measurements are listed beginning on
page 63.
62
TDS5000B Series Quick Start User Manual
Operating Basics
Quick Tips
H
In roll mode, measurements are not available until after you stop the acquisition.
H
To add measurements, right-click the waveform handle and then select Add Measurement.
H
To remove a measurement, right-click on that measurement readout and then select Remove.
H
To remove all measurements, right-click on any measurement readout and then select Remove All.
Automated Measurement Selections
The following tables list each automated measurement by category: amplitude, time, more, histogram, or
communication. See page 62 for how to select a measurement.
Amplitude Measurements
Amplitude
The high value less the low value measured over the entire waveform or gated region.
High
This value is used as 100% whenever high reference, mid reference, or low reference
values are needed, such as in fall time or rise time measurements. It can be calculated
using either the min/max or histogram method. The min/max method uses the maximum
value found. The histogram method uses the most common value found above the
midpoint. This value is measured over the entire waveform or gated region.
Low
This value is used as 0% whenever high reference, mid reference, or low reference values
are needed, such as in fall time or rise time measurements. It can be calculated using
either the min/max or histogram method. The min/max method uses the minimum value
found. The histogram method uses the most common value found below the midpoint.
This value is measured over the entire waveform or gated region.
RMS
The true Root Mean Square voltage over the entire waveform or gated region.
Max
Typically the most positive peak voltage. Max is measured over the entire waveform or
gated region.
Min
Typically the most negative peak voltage. Min is measured over the entire waveform or
gated region.
Pk-Pk
The absolute difference between the maximum and minimum amplitude in the entire
waveform or gated region.
Cycle RMS
The true Root Mean Square voltage over the first cycle in the waveform or the first cycle
in the gated region.
TDS5000B Series Quick Start User Manual
63
Operating Basics
Amplitude Measurements (Cont.)
+Overshoot
This is measured over the entire waveform or gated region and is expressed as:
Positive Overshoot = (Maximum - High) x Amplitude x 100%.
-Overshoot
This is measured over the entire waveform or gated region and is expressed as:
Negative Overshoot = (Low - Minimum) x Amplitude x 100%.
Mean
The arithmetic mean over the entire waveform or gated region.
Cycle Mean
The arithmetic mean over the first cycle in the waveform or the first cycle in the gated
region.
Time Measurements
64
Rise Time
The time required for the leading edge of the first pulse in the waveform or gated region to
rise from the low reference value (default = 10%) to the high reference value (default =
90%) of the final value.
Fall Time
The time required for the falling edge of the first pulse in the waveform or gated region to
fall from the high reference value (default = 90%) to the low reference value (default =
10%) of the final value.
Pos Width
The distance (time) between the mid reference (default 50%) amplitude points of a
positive pulse. The measurement is made on the first pulse in the waveform or gated
region.
Neg Width
The distance (time) between the mid reference (default 50%) amplitude points of a
negative pulse. The measurement is made on the first pulse in the waveform or gated
region.
+ Duty Cyc
The ratio of the positive pulse width to the signal period expressed as a percentage. The
duty cycle is measured on the first cycle in the waveform or gated region.
- Duty Cyc
The ratio of the negative pulse width to the signal period expressed as a percentage. The
duty cycle is measured on the first cycle in the waveform or gated region.
TDS5000B Series Quick Start User Manual
Operating Basics
Time Measurements (Cont.)
Period
The time required to complete the first cycle in a waveform or gated region. Period is the
reciprocal of frequency and is measured in seconds.
Freq
The first cycle in a waveform or gated region. Frequency is the reciprocal of the period; it
is measured in Hertz (Hz) where one Hz is one cycle per second.
Delay
The time between the mid reference (default 50%) amplitude point of two different
waveforms.
More Measurements
Area
Area measurement is voltage over time measurement. The area over the entire waveform
or gated region in volt-seconds. Area measured above ground is positive; area measured
below ground is negative.
Cycle Area
A voltage over time measurement. The measurement is the area over the first cycle in the
waveform or the first cycle in the gated region expressed in volt-seconds. The area above
the common reference point is positive while the area below the common reference point
is negative.
Phase
The amount of time that one waveform leads or lags another waveform, expressed in
degrees where 360° comprises one waveform cycle.
Burst Wid
The duration of a burst (a series of transient events) and is measured over the entire
waveform or gated region.
TDS5000B Series Quick Start User Manual
65
Operating Basics
Histogram Measurements
66
Wfm Ct
Displays the number of waveforms that have contributed to the histogram.
Hits in Box
Displays the number of points in or on the histogram box.
Peak Hits
Displays the number of points in the largest bin of the histogram.
Median
Displays the middle point of the histogram box. Half of all acquired points within or on the
histogram box are less than this value and half are greater than this value.
Max
Displays the voltage of the highest nonzero bin in vertical histograms or the time of the
rightmost nonzero bin in the horizontal histograms.
Min
Displays the voltage of the lowest nonzero bin in vertical histograms or the time of the
leftmost nonzero bin in the horizontal histograms.
Pk-Pk
Displays the peak-to-peak value of the histogram. Vertical histograms display the voltage
of the highest nonzero bin minus the voltage of the lowest nonzero bin. Horizontal
histograms display the time of the rightmost nonzero bin minus the time of the leftmost
nonzero bin.
Mean
Measures the average of all acquired points within or on the histogram box.
Std Dev
Measures the standard deviation (Root Mean Square (RMS) deviation) of all acquired
points within or on the histogram box.
Mean ±1 Std
Dev
Displays the percentage of points in the histogram that are within one standard deviation
of the histogram mean.
Mean ± 2
Std Dev
Displays the percentage of points in the histogram that are within two standard deviations
of the histogram mean.
Mean ±3 Std
Dev
Displays the percentage of points in the histogram that are within three standard
deviations of the histogram mean.
TDS5000B Series Quick Start User Manual
Operating Basics
Communication Measurements
Ext Ratio
The ratio of eye top to base. This measurement only works for waveform database, fast
acquisition signals, or a reference waveform saved in fast acquisition mode.
Ext Ratio %
The ratio of eye base to top expressed as a percentage. This measurement only works for
waveform database, fast acquisition signals, or a reference waveform saved in fast
acquisition mode.
Ext Ratio (dB)
The ratio of eye top to base expressed in decibels. This measurement only works for
waveform database, fast acquisition signals, or a reference waveform saved in fast
acquisition mode.
Eye Height
The measurement of the eye height in volts.
Eye Width
The measurement of eye width in seconds.
Eye Top
The top value used in the extinction ratio measurements.
Eye Base
The base value used in the extinction ratio measurements.
Crossing %
The eye crossing point expressed as a percentage of eye height.
Jitter P-P
The peak-to-peak value for the edge jitter in the current horizontal units.
Jitter RMS
The RMS value of the edge jitter in the current horizontal units.
Jitter 6 Sigma
Six times the RMS value of the edge jitter in the current horizontal units.
Noise P-P
The peak-to-peak value of the noise of the top or base of the signal as specified by you. To
ensure accurate noise values, be sure to set the signal type to Eye when measuring an Eye
signal.
Noise RMS
The RMS value of the noise of the top or base of the signal as specified by you. To ensure
accurate noise values, be sure to set the signal type to Eye when measuring an Eye signal.
S/N Ratio
The ratio of the signal amplitude to the noise of the top or base of the signal as specified
by you.
Cyc Distortion
The peak-to-peak time variation of the first eye crossing measured at the Mid Ref as a
percent of the eye period.
Q-Factor
The ratio of eye size to noise.
TDS5000B Series Quick Start User Manual
67
Operating Basics
Customizing an Automatic Measurement
You can customize automatic measurements by using gating, modifying measurement statistics, adjusting the
measurement reference levels, or taking a snapshot.
Gating
Use Gating to confine the measurement to a certain portion of a waveform.
Gated region
1. Select Measure > Gating.
2. Position the gates by doing one of
the following:
H
Click Cursor to set the gated
area to the area between the
cursors.
H
Click Zoom (1-4) to set the
gated area to the Zoom(1-4)
graticule.
1
2
68
TDS5000B Series Quick Start User Manual
Operating Basics
Statistics
Statistics turn on automatically with
measurements. Statistics characterize
the stability of the measurement.
To change the statistics that are
displayed, select Measure > Statistics
and then select Mean or All. (All
includes min, max, mean, standard
deviation, and population.) To remove
statistics select Off.
Quick Tips
H
In FastFrame mode when doing a single sequence acquisition, statistics represent measurements over the
entire frameset.
Snapshot
To see a one-time view of all valid
measurements, select
Measure > Snapshot.
Quick Tip
H
To access a shortcut measurement menu, right-click the measurement readouts.
TDS5000B Series Quick Start User Manual
69
Operating Basics
Reference Levels
Reference levels determine how
time-related measurements are taken.
1. Select Measure > Reference Levels...
2. Adjust the measurement reference levels to different relative or
fixed values.
70
H
High and Low reference are
used to calculate rise and fall
times. The default High
reference is 90% and Low
reference is 10%.
H
Mid reference is primarily
used for measurements
between edges such as pulse
widths. The default level is
50%.
H
Mid2 reference is used on
the second waveform
specified in delay or phase
measurements. The default
level is 50%.
2
1
TDS5000B Series Quick Start User Manual
Operating Basics
Taking Cursor Measurements
Cursors are an easy tool to use for taking measurements on acquired data.
1. Push CURSORS.
1
2. Select the Cursor Source.
3. Select a cursor type from one of
the following:
H
H Bars measure amplitude
(typically in volts or
amperes)
H
V Bars measure horizontal
parameters (typically time)
H
Waveform and screen
cursors measure vertical and
horizontal parameters
simultaneously. Waveform
cursors are attached to the
waveform and screen
cursors float, unattached to
the waveform.
2
3
4. If you want to take measurements
between two waveforms, select
Waveform, and then select the
waveform source for each cursor.
Cursors
4
TDS5000B Series Quick Start User Manual
71
Operating Basics
5. Select Cursors > Cursor Position..., and then use the multipurpose knobs to adjust the cursor position.
5
6. Read cursor measurement results
in the display.
6
T1: 356.4 ms
T2: 352.5 ms
∆T: 3.92 ms
1/∆T: 255 Hz
V1: 5.120 V
V2: 4.886 V
∆V: 234 mV
∆V/∆T: 59.7 V/s
Quick Tips
72
H
Use the Cursor Track Mode to set the cursors to move in tandem. Use the Cursor Independent mode to
move the cursors separately.
H
If you use the zoom graticule, you can place a cursor directly on a specific waveform point to take precision
measurements.
H
You can also move cursors by clicking and dragging them to a new position.
H
Vertical cursors measure the time from the trigger point to the vertical cursor.
H
Any cursor type can be used for YT display format. XY and XYZ display format can only use Screen or
Waveform cursors. If FastAcq is on, XYZ display format can only use Screen cursors.
H
To quickly select cursor functionality, right-click on a cursor or cursor readout for a shortcut menu.
TDS5000B Series Quick Start User Manual
Operating Basics
Setting Up a Histogram
You can display either a vertical (voltage) or horizontal (time) histogram. Use histogram measurements to get
statistical measurement data for a section of a waveform along one axis. Histograms are not available in
FastFrame mode.
1. Click and drag across the segment of the waveform that you
want the histogram to cover. For
a horizontal histogram, for example, it is best to make the box
wider than it is tall.
1
2. Select Histogram Vertical or Histogram Horizontal from the
shortcut menu.
2
3. View the histogram at the top (for
horizontal histograms) or the left
edge (for vertical histograms) of
the graticule.
3
4. To make adjustments to the histogram scale or the size and location of the histogram box, select
Measure > Waveform Histograms..., and then use the Histogram Setup control window.
4
5. To take automated measurements
on histogram data see page 62
for information.
TDS5000B Series Quick Start User Manual
73
Operating Basics
Quick Tips
H
Use vertical histograms to measure signal noise and horizontal histograms to measure signal jitter.
H
Use the click and drag procedure to activate the shortcut menu to turn the histogram display off.
H
Right-click the histogram or in the histogram box to access a shortcut menu.
Using Math Waveforms
Create math waveforms to support the analysis of your channel and reference waveforms. By combining and
transforming source waveforms and other data into math waveforms, you can derive the data view that your
application requires.
Use the following procedure for predefined math equations.
1. Select Math > Math Setup....
1
2. Choose one of the predefined
math equations.
2
Use the following procedure to build an advanced math waveform expression.
1. Select Math > Math Setup....
1
2. Click Editor.
2
3. Build your advanced math waveform expression using sources,
operators, constants, measurements, variables, and functions.
4
4. When you have defined the expression to your satisfaction,
click Apply.
3
74
TDS5000B Series Quick Start User Manual
Operating Basics
Quick Tips
H
Math definitions are not implemented if the sources are not valid.
H
Math waveforms can be created from channel, reference, or math source waveforms.
H
Measurements can be taken on math waveforms in the same way as on channel waveforms.
H
Math waveforms derive their horizontal scale and position from the sources in their math expressions.
Adjusting these controls for the source waveforms also adjusts the math waveform.
H
You can magnify math waveforms using Zoom; use the mouse for positioning the zoomed area.
Spectral Analysis Concepts
Signals may be represented by their characteristics in both the time and the frequency domains. Spectral
analysis merges the time domain controls with the frequency domain controls to provide a complete spectral
analyzer. Consider the following when using spectral analysis:
H
Frequency Domain controls use traditional spectrum analyzer controls to set the center frequency, span,
and resolution bandwidth directly.
H
Time Domain controls for the acquired waveform set the time duration and the resolution time between
samples. You can easily set the required sample rate and record length.
H
Gating Controls are the bridge that connects the time domain to the frequency domain. You can perform
spectral analysis on a gated region of the input waveform. This gating also determines the resolution
bandwidth.
H
Eight different window functions are available to shape the filter response.
H
Display log data in dB, dBm, or linear mode. You can display the real or only the imaginary parts of the
spectral magnitude. Reference level offset and reference level controls give complete control over the
vertical position and offset of the spectrum.
H
Display phase data as a function of frequency in radians, degrees, or group delay. You may zero the phase
value for magnitudes below a user-defined threshold level to prevent the display from becoming unusable
due to random noise.
H
You can turn on averaging in the frequency domain for phase and magnitude waveforms.
H
Up to four spectral analyzers may be used simultaneously. They may all be assigned to different gates on
the same source waveform or to different channel sources. The controls of Math1 and Math2 may be
locked, and the controls of Math3 and Math4 may be locked. When controls are locked, turning a control
on one analyzer changes the control on the other analyzer to the same value. Other combinations of
locking, including all four analyzers, are available using GPIB commands.
TDS5000B Series Quick Start User Manual
75
Operating Basics
Using the Time Controls
The time domain controls for the spectral waveform are:
H
Duration, which selects the time from the beginning to the end of the acquired waveform. Set duration
using the record length and/or the sample rate controls.
H
Resolution, which determines the time between samples. Duration is kept constant as resolution is
changed. Therefore, the Resolution control affects both the sample rate and the record length simultaneously.
Using the Gating Controls
Gating determines which portion of
the acquired waveform is transformed
into the frequency domain. The gate
has a position and a width control.
The gate position is the time in
seconds from the trigger location to
the center 50% position of the gate
interval. The position and width units
are seconds.
Gate
position
Duration
Zero phase reference
Gate
Trigger
position
Gate
width
Time domain
acquisition
Frequency domain samples
Using the Frequency Controls
The frequency domain controls for the spectral waveform are:
76
H
Span, which is the frequency at the end of the spectral waveform minus the frequency at the beginning of
the waveform.
H
Center, which is the frequency at the center of the spectral waveform. Center is equal to the start frequency
plus one half of the span.
H
Resolution bandwidth, which is the 3 dB down bandwidth of the spectral analyzer frequency response to a
sine wave input.
TDS5000B Series Quick Start User Manual
Operating Basics
Using the Magnitude Controls
Vertical units can be either linear or log. When the spectrum is linear magnitude, the vertical units are the same
as the source waveform. When the vertical scale of the magnitude spectrum is set to dB, use the Reference
Level Offset to set which vertical position in the magnitude spectrum is zero dB. Setting the vertical scale to
dBm sets the Reference Level Offset to a value that is equivalent to 1 mW of power into 50 Ω.
The value of the Reference Level is the magnitude at the top of the display screen. Reference Level does not
change the spectral data but Reference Level Offset does. Adjusting the Reference Level Offset causes the
spectral waveform to move vertically with respect to the waveform reference marker. This moves the waveform
without changing the Reference Level control setting.
Using the Phase Controls
You can set the vertical units to Degrees, Radians, or Group Delay in seconds. Phase is a relative measurement
that must have a time domain reference point. The phase value is specified with respect to this phase reference
position.
The spectral analyzer produces phase values from -π to π radians or -180 to 180 degrees. However, when you
perform impulse response testing and the phase is continuous, then phase values outside these ranges may
occur. The spectral analyzer then wraps the data with discontinuities in the display from +180 to -180 degrees.
Phase unwrap will display the correct result by unwrapping the phase. Phase unwrap is only valid when the
phase spectrum is a continuous function of frequency. Therefore, do not use it when analyzing the harmonic
content of the typical repetitive signal.
Random noise in the spectrum may have phase values over the entire range. This could make the phase display
unusable. However, you can set the suppression threshold control to a level in dB. The phase of any complex
spectral points with a magnitude below this threshold is set to zero.
When the phase spectrum is a continuous function of frequency, group delay may be computed. This is true of
impulse response testing where an impulse is fed into the system, and the spectrum of the response of the
system output is computed.
Group delay measures how well a system passes a signal in terms of phase distortion. Group delay is the
derivative of the phase with respect to frequency. This feature is not useful for analysis of harmonic content of
signals where the phase response is not continuous.
TDS5000B Series Quick Start User Manual
77
Operating Basics
Using Spectral Analysis
Use the following procedure for predefined spectral math expressions.
1. Select Math > Math Setup....
1
2. Choose one of the predefined
spectral math expressions.
2
Use the following procedure to build an advanced spectral math expression.
1. Select Math > Spectral Setup....
1
2. Select the math waveform that
you want to define.
2
3. Click the type of spectral waveform that you want to create. To
redefine a waveform, click Clear.
4. Select the source waveform.
3
5. To adjust the spectral waveform
do one of the following:
H
Use the controls in the
Spectral Setup control
window.
H
Click Controls, and then use
the multipurpose knobs to
adjust the spectral waveform.
4
5
5
Adjust FFT center
frequency
Adjust FFT span
78
TDS5000B Series Quick Start User Manual
Operating Basics
6. You can view time-domain and
frequency-domain waveforms
simultaneously.
Use Gating to select only a
portion of the time-domain
waveform for spectral analysis
(See page 68.)
6
Time-domain
Frequency-domain
Quick Tips
H
Sources for spectral math waveforms must be channel or other math waveforms.
H
Use short record lengths for faster instrument response.
H
Use long record lengths to lower the noise relative to the signal and increase the frequency resolution.
H
Different window functions produce different filter response shapes in the spectrum and result in different
resolution bandwidths.
H
The resolution bandwidth directly controls the gate width. Therefore, the time domain gate markers move
as you adjust the RBW control.
H
You can display the linear magnitude of the real data or the imaginary data in the spectrum. This is useful if
you process the spectrum off line and transform it back into a time domain trace.
TDS5000B Series Quick Start User Manual
79
Operating Basics
Using Limit Testing
Limit testing allows you to compare an active signal with a template waveform. Build your template waveform
from a known good signal and use it to compare to an active signal to perform pass/fail testing.
1. Select Masks > Limit Test Setup....
1
2. Create the template by selecting
the Source, Destination, and Tolerances. Use the multipurpose
knobs to adjust the Tolerances.
Tolerances specify how much
margin the signal is allowed before failing the limit test.
2
4
5
3. Click Save. You can create multiple templates and then save them
for later use.
4. Select the Source waveform to
compare to the template.
3
5. Select the Template to compare
to the Source waveform. (Usually,
this is the one that you just
created in step 3.)
80
TDS5000B Series Quick Start User Manual
Operating Basics
6. Click Config to set up the Failure
Notification.
7. Select the Failure Notification(s),
and then click Close to return to
the setup control window.
8. Click Lock Template to Waveform
On to lock the vertical scale or
position of the template to that of
the source waveform.
6
8
9
7
9. Click Highlight Hits On to show
points that fall outside the template in a different color.
10. Click On to start the test.
11. Click Reset to clear all violations
and reset the test.
10
11
Quick Tips
H
You can use active or saved waveforms to create a limit test template.
H
Using Average acquisition mode will create a smoother template waveform.
H
Using Envelope acquisition mode will create a template that allows for occasional overshoots.
TDS5000B Series Quick Start User Manual
81
Operating Basics
Using Mask Testing
Serial Mask Testing (Option SM) allows you to compare your signal to a predefined template or mask. For the
signal to pass the test, it must fall outside the segments defined by the mask. Generally, standards committees
such as ANSI define the masks. To perform mask testing do the following:
1. Select Masks > Mask Setup....
1
2. Select the Type and Standard.
2
3. Click Config to access the Mask
Configuration control window,
where you can adjust how masks
and violations are displayed and
how Mask Autoset and Autofit are
configured.
4
3
4. Click Masks to return to the Mask
Setup control window.
You can access these controls from
the Display Config button or from the
Mask Setup control window.
5. Click Lock Mask to Wfm On so
that the mask tracks changes in
the horizontal or vertical settings.
5
6
6. Click Hit Count On to highlight
violations during a mask test.
82
TDS5000B Series Quick Start User Manual
Operating Basics
7. Click Autoset to automatically
align the waveform with the mask
based on the characteristics of
the input signal.
7
8
8. Click Autofit On to automatically
reposition the waveform after
each acquisition to minimize hits.
9. Click the Source tab, and then select the signal source.
9
10. Click the Tolerance tab, and then
set the tolerance.
10
Tolerance settings greater than
0% make the mask test harder to
pass, settings less than 0% make
the test easier to pass.
Use 0% if you want the mask as
specified in the standard. Changing the percentage allows you to
do margin testing.
TDS5000B Series Quick Start User Manual
83
Operating Basics
11. Select the Pass/Fail Setup tab,
and then set up the pass/fail parameters. (When acquisition
mode is Waveform Database, the
# of Wfms label becomes Samples.)
12
11
12. Select your Pass/Fail Test Notifications.
13. Select the polarity you want to
test.
14. Click Pass/Fail Test On to start
the mask test.
15. Click Repeat On to run the mask
test continuously.
16. Click the Pass/Fail Results tab to
view the test results.
14
13
15
16
17. Click Pass/Fail Test On to start
the mask test.
17
18. Click Reset to reset the totals and
clear any violations.
18
Quick Tips
84
H
Use the right-click shortcut menu to quickly make changes to the mask setup, such as Autoset and Autofit.
H
If the signal is not within the mask, enable Autoset to center the waveform in the mask.
TDS5000B Series Quick Start User Manual
Operating Basics
Setting Up E-mail on Event
1. Select Utilities > E-mail on
Event.
1
2. Enter recipients’ e-mail address(es). Separate multiple entries with a comma. There is a
limit of 252 characters in the email address box.
2
3. Click Config, and then enter the
SMTP Server Address. Contact
your network administrator for
the correct address.
3
4. Select the event(s) for which you
want to send an e-mail.
5. To include attachments, select
the type of attachment, and then
click Settings to specify the format.
TDS5000B Series Quick Start User Manual
5
4
85
Operating Basics
6. Set the maximum message limit
and e-mail size. (Maximum message limit is 50 and maximum email size is 2000 MB). When the
maximum message limit is
reached, you must click Reset to
send more e-mails on event.
6
7. To ensure that you have set up
the e-mail addresses correctly,
click Send. If the recipient does
not receive the test e-mail, you
may need to adjust the configuration.
7
8
8. Click Config to access the e-mail
configuration dialog box and adjust the configuration.
Quick Tips
H
86
To save attachments to your instrument hard drive, set the maximum message size to zero. The attachments will be saved to the default location C:\TekScope\Images, Waveforms, or Data depending on the type
of attachment.
TDS5000B Series Quick Start User Manual
Operating Basics
MyScope
MyScope allows you to create custom control windows that include only the controls that you to use regularly.
Instead of switching between several control windows, put the controls you use into a custom control window.
This section contains procedures for creating and using MyScope control windows. Detailed information is
available in the online help.
Creating a New MyScope Control Window
1. Select MyScope > New Control
Window....
1
2. Click + to expand a category.
Controls that can be added to
your MyScope control window
are contained within each category. The categories match the
menu bar to aid you in finding the
controls you normally use.
3. Click a control to preview it.
TDS5000B Series Quick Start User Manual
2
3
87
Operating Basics
4. Double-click the control or click
the + to expand the control list. (If
there is no +, then the control
cannot be customized further.)
5. Clear the check boxes to remove
any components you do not want
included in the control.
6. Click and drag the control to your
MyScope control window. The
control will snap to the nearest
grid location when you release
the mouse. You can change the
placement of the control in your
MyScope control window by
clicking and dragging.
88
4
5
6
TDS5000B Series Quick Start User Manual
Operating Basics
7. Click New Tab to add a tab to
your MyScope control window.
You can have up to eight tabs.
8. To rename a tab do one of the following:
H
Click Rename Tab
H
Double-click the tab
7
8
9
Then type the new name.
9. Click User Pref... to specify user
preferences that are loaded with
your MyScope control window.
10. To delete controls do one of the
following:
H
Select a tab, and then click
Delete. The tab and all of the
controls are deleted.
H
Select a control, and then
click Delete. Just the
selected control is deleted.
TDS5000B Series Quick Start User Manual
10
89
Operating Basics
11. Click Save, and then enter a name
for your MyScope control window, or use the default name.
11
Quick Tips
H
To reconfigure a control, click and drag it back to the preview window. Then select or clear the check boxes
to include or remove components in the control.
H
To change the tab order, click and drag a tab to a new location.
H
To delete a control, click and drag it to the upper half of the screen (off of your MyScope control window).
Using MyScope Control Windows
To open a previously defined MyScope control window do the following:
1. Select MyScope > Open Control
Window... or one of the five
most recently used MyScope windows.
2. Select the MyScope control window you want to use, and then
click Open.
90
1
2
TDS5000B Series Quick Start User Manual
Operating Basics
To display the active MyScope control window do the following:
1. Select MyScope > Current... or
click MyScope in the toolbar
mode. (Your MyScope control
window remains active even when
it is not displayed.)
1
To edit a MyScope control window do the following:
1. Select MyScope > Edit Control
Window....
1
2. Select the control window you
want to edit, and then click Open.
2
Quick Tips
H
Some controls function differently in a MyScope control window than they do in the standard control
window. For details, see the online help.
H
You can copy MyScope control windows (.tcw files) to other TDS5000B Series instruments.
TDS5000B Series Quick Start User Manual
91
Operating Basics
Saving and Recalling Information
This section contains procedures for saving and recalling screen captures and setups, saving measurements,
using the clipboard, and printing on your instrument. Detailed information is available in the online help.
Saving Screen Captures
1. Select File > Save or Save As....
1
2. Click Screen Capture.
3. Click Options..., if you want to
setup the Palette, View, Image, or
Screen Capture Format options;
otherwise skip to step 4.
4. Select the location to save the
screen capture.
2
3
4
5. Type in a name for the screen
capture, or use the default name
and then select a file type.
6. Click Save.
5
6
Quick Tips
H
92
To quickly save multiple screen captures, select Set Front Panel Print Button to Save, and then click Save.
You can now save a screen capture by pushing the front panel Print button.
TDS5000B Series Quick Start User Manual
Operating Basics
Saving Waveforms
1. To save waveforms, select File >
Save or Save As....
1
2. Click Waveform.
3. Click Options..., if you want to
specify the Waveform Data
Range, FastFrame Data Range,
Waveform Detail, Data Destination, Source, or Data Ordering;
otherwise skip to step 4.
2
3
4. Select the Source.
5. You can either save the waveform
as a reference waveform in the
instrument memory or as a .wfm
file in a Windows directory. To
save the waveform as a reference, select Ref 1-4. To save as a
.wfm file, select the location
where you want to save the waveform.
6. If you are saving as a .wfm file,
type in a file name or use the
default.
4
5
6
7
7. Click Save.
Quick Tips
H
Select Auto-increment file name to save numerous similar waveforms without having to retype the entire
name.
H
To quickly save multiple waveforms, select Set Front Panel Print Button to Save and then click Save. You
can now save a waveform by pushing the front panel Print button.
TDS5000B Series Quick Start User Manual
93
Operating Basics
Recalling Waveforms
1. Select File > Recall....
1
2. Click Waveform.
2
4
3. Select the Destination of the
waveform you are recalling.
4. Select the waveform to recall.
5. Click Recall. Clicking Recall turns
on the reference waveform and
activates the Reference Waveform control window.
3
5
6. Use the controls to turn the display on, reposition or label the
Reference waveform, change the
scale, save or recall. You can also
access the Reference Waveform
control window by selecting File
> Reference Waveform Controls....
6
Quick Tips
H
94
You can save a number of different file types but you can only recall setup (*.set) files and waveform
(*.wfm) files.
TDS5000B Series Quick Start User Manual
Operating Basics
Saving Instrument Setups
1. Select File > Save or Save As....
1
2. Click Setup.
3. Select the location where you
want to save the setup. You can
either save the setup to the
instrument memory in one of the
ten setup storage locations or as
a .set file in a Windows directory.
4. Type a file name or use the
default name. Use the pop-up
keyboard to type a file name for a
setup saved to the instrument
memory.
3
2
4
5
5. Click Save.
Quick Tips
H
If the touch screen is enabled, use the pop-up keyboard to label the setups for easy identification.
H
Use Auto-increment file name to save numerous similar files without having to retype the entire file name.
H
To quickly save multiple setups, select Set Front Panel Print Button to Save, and then click Save. You can
now save a setup by pushing the front panel Print button.
TDS5000B Series Quick Start User Manual
95
Operating Basics
Recalling Instrument Setups
1. Select File > Recall....
1
2. Click Setup.
3. Select the setup you want to
recall. You can recall a setup file
from one of the ten locations in
the instrument memory or from a
Windows directory.
4. Click Recall.
2
3
4
Quick Tips
H
96
You can recall any setup stored on disk and then save it in an internal setup storage location for quicker
access.
TDS5000B Series Quick Start User Manual
Operating Basics
Saving Measurements
1. Select File > Save or Save As....
1
2. Click Measurement.
3. Click Options..., if you want to
specify Displayed Measurements
or Measurement Snapshot otherwise; skip to step 4.
2
3
4. Select the location to save the
measurement.
4
5. Type in a name for the measurement, and then select a file type.
6. Click Save.
5
6
TDS5000B Series Quick Start User Manual
97
Operating Basics
Copying Your Results to the Clipboard
Use the following procedure to set the output content and format for images, waveforms, or measurements to
be copied to the Microsoft clipboard.
1. Select File > Copy Setup....
1
2. Click the Images, Waveforms, or
Measurements tab, and then
select the desired options.
2
To copy images, waveforms, or measurements use the following procedure:
1. Select the item that you want to
copy. That item is now available
to copy to the clipboard.
1
2. Select Edit > Copy or press Ctrl +
C.
3. Press Ctrl + V to paste the item
into a Windows application.
2
3
98
TDS5000B Series Quick Start User Manual
Operating Basics
Printing a Hard Copy
1. To print a hard copy do one of the
following:
H
Push PRINT.
H
Select File > Print.
If necessary, you can make
changes to the page
orientation in the Page Setup
dialog box.
1
1
The following steps are based on the
Integrated Thermal Printer (Option
1P). Your Print and Page Setup dialog
boxes will depend on the printer you
are using.
2
2. Click Page Setup....
3. Select either Screen-copy or Banner.
4. Select the printing parameters
depending on the type of printing.
3
4
TDS5000B Series Quick Start User Manual
99
Operating Basics
Run Application Software
The Optional Application Software CD contains free five-time trials of optional application software that you can
install on your instrument. These applications provide application-specific measurement solutions. Some
examples are described below. Additional packages may be available. Contact your Tektronix representative or
visit our website at www.tektronix.com for more information. (See Contacting Tektronix on page 4.)
H
Use TDSJIT3 or TDSJIT3E Jitter Analysis Software to characterize timing performance. Analyze jitter on
contiguous clock cycles using single-shot acquisitions.
H
Use TDSDDM2 Disk Drive Measurement Software to measure disk drive signals according to IDEMA
standards.
H
Use TDSDVD Optical Storage Analysis and Measurement Software for automatic amplitude and timing
measurements, providing you with the flexibility to modify signal processing blocks to maximize design
performance.
H
Use TDSET3 to perform 10/100/1000 Base-T ethernet compliance testing.
H
Use TDSUSB2 to characterize USB2 signals including mask testing and parametric testing.
H
Use TDSCPM2 for mask and measurements compliance testing for ITU-T G.703 and ANSI T1.102
communications standards.
H
Use TDSPWR3 Power Measurement Software to quickly measure and analyze power dissipation in power
supply switching devices and magnetic components.
Follow the instructions provided with
the application software to install it.
To run the software, select File > Run
Application and then select the
application.
100
TDS5000B Series Quick Start User Manual
Application Examples
This section contains ways to use your instrument in common troubleshooting tasks, procedures for using your
instrument with a Tektronix logic analyzer and extending the use of your instrument.
Capturing Intermittent Anomalies
One of the most difficult tasks that design engineers face is tracking down the cause of intermittent failures. If
you know what type of anomaly you are looking for, then it is easy to configure the oscilloscope’s advanced
triggering capability to isolate it. However, when you don’t know what you’re looking for, it can be exceptionally
tedious and time consuming, especially given the low waveform capture rate on traditional digital storage
oscilloscopes.
Digital Phosphor Oscilloscopes enabled by DPX technology have an exceptionally fast acquisition mode called
FastAcq that allows you to find anomalies like these in a matter of seconds or minutes, whereas a regular DSO
would take hours or days to find the same event.
Use the following procedure to capture intermittent anomalies.
1. Probe the signal of interest. (Generally this is one that you think
may be causing problems.)
1
2. Push Autoset.
3. Select Display > Display Persistence > Infinite Persistence. In
this example, we are looking at a
clock signal. After observing the
signal for 1-2 minutes, but before
you look for the problem elsewhere, go to step 4.
TDS5000B Series Quick Start User Manual
2
3
101
Application Examples
4. Press FastAcq.
5. If glitches, transients, or other
random anomalies are present in
the signal, you will find them
faster using FastAcq. In this
example, FastAcq revealed a
~200 ns positive glitch after only
a few seconds.
4
5
Now that you have identified an
anomaly, you may want set the trigger
system up to look for it. You may also
want to set up e-mail on trigger so
you could be notified when the
anomaly occurs.
6. To trigger on the glitch that you
identified in step 5, select Glitch
Setup....
7. Select the appropriate Source,
Polarity, and Trig if Width values.
8. Click Level, and then set the level
based on what you found in step
5.
9. Click Width, and then set the
width based on what you found in
step 5.
6
7
8
9
102
TDS5000B Series Quick Start User Manual
Application Examples
10. Click E-mail on Trigger On. For
additional information on setting
up e-mail on trigger, refer to
page 47.
10
11. Push Single to trigger on a single
glitch.
11
Correlating Data Between a TDS5000B Series Oscilloscope
and a TLA5000 Series Logic Analyzer
Today almost every design is a high-speed design with fast clock edges and data rates. For these designs, you
need to see the analog characteristics of high-speed digital signals in relation to complex digital events in the
circuit. iView is your window into the digital and analog world. The iView capability seamlessly integrates and
automatically time-correlates data from Tektronix logic analyzers and oscilloscopes, so you can transfer analog
waveforms from the oscilloscope to the logic analyzer display with the click of a mouse. View time-correlated
analog and digital signals side-by-side and pinpoint the source of elusive glitches and other problems in
moments.
The iView External Oscilloscope Cable allows you to connect your logic analyzer to a Tektronix oscilloscope,
enabling communication between the two instruments. The Add External Oscilloscope wizard, which is available
from the TLA application System menu, will guide you through the process of connecting the iView cable
between your logic analyzer and oscilloscope.
A setup window is also available to assist you in verifying, changing, and testing the oscilloscope settings.
Before acquiring and displaying a waveform, you must establish a connection between your Tektronix Logic
Analyzer and oscilloscope using the Add External Oscilloscope wizard.
TDS5000B Series Quick Start User Manual
103
Application Examples
1. Select Add iView External Oscilloscope... from the logic analyzer
System menu.
1
2. Select your model of oscilloscope.
3. Follow the on-screen instructions
and then, click Next.
2
4. See your Tektronix Logic Analyzer
documentation for more information on correlating data between a
TDS5000B Series Oscilloscope
and a Tektronix Logic Analyzer.
3
Using the Extended Desktop and OpenChoice Architecture for
Efficient Documentation
Engineers often need to document their lab work for future reference. Instead of saving screen shots and
waveform data to a floppy disk, and then generating a report later, try using the TDS5000B OpenChoice
architecture to document your work in real time.
To make your instrument the center of your design and documentation process, use the following procedure.
1. Load Microsoft Word or Excel on
your instrument.
2. Connect a second monitor. (Follow the procedure on page 11.)
2
1
104
TDS5000B Series Quick Start User Manual
Application Examples
3. Open Microsoft Word, and then
drag the Word window onto the
extended desktop.
3
4. Click TekScope to restore the
instrument application.
4
5. Select Edit > Select for Copy >
FullScreen (bitmap).
5
6. Press Ctrl+C.
7. Click in the Word document wherever you want to place the screen
shot, and then press Ctrl+V.
6
7
Quick Tips
H
The TDS5000B comes with a variety of OpenChoice software tools designed to ensure maximum efficiency
and connectivity to the rest of your design environment.
TDS5000B Series Quick Start User Manual
105
Application Examples
Measuring Switching Loss in a Switch Mode Power Supply
(SMPS)
WARNING. To avoid injury or death, use extreme caution when working with high voltage circuits. Only qualified
personnel should take measurements using high voltage circuits.
The switching loss in a power supply determines its efficiency. Using an oscilloscope to measure switching loss
is probably the most important and one of the most common tasks a switch mode power supply designer must
perform. To use your TDS5000B Series oscilloscope to measure switching loss, perform the following steps:
1. Connect a P5205 (or other high
voltage differential probe) to
channel 1.
Switching device
Drain
current
2. Connect a TCP202 (or other current probe) to channel 2.
3. Connect the positive input of the
P5205 to the source voltage and
the negative input to the drain
voltage on the switching device to
measure Vds.
4. Connect the TCP202 to the drain
current to measure Ids.
5. Turn on CH 1 and CH 2.
The P5205 and TCP202 are a matched
set of probes in terms of cable length,
so you should not need to deskew the
input channels. If you are using other
probes that are not matched, do the
following to perform a deskew
operation:
Source
voltage
4
Drain
voltage
3
2
1
5
6
6. Select Deskew..., and then press
F1 for instructions on performing
a deskew operation.
106
TDS5000B Series Quick Start User Manual
Application Examples
7. Press Autoset.
8. Use the Vertical Position frontpanel knobs to place the Voltage
waveform (CH 1) in the upper
third of the graticule and the Current waveform (CH 2) in the
middle of the graticule. For more
accurate measurements, vertically scale the voltage and current
waveforms so that they fill the
graticule.
7
8
9
9. Adjust the horizontal scale so at
least one full cycle is shown in
the graticule.
10. Select Math > Ch1 * Ch2 to calculate a power waveform based
on the voltage and current waveforms. The peaks in the math waveform represent switching
losses as the component
switches on and off.
TDS5000B Series Quick Start User Manual
10
107
Application Examples
11. Select Measure > More > Area to
measure power.
11
12. To measure loss on a specific
transition, select Measure > Gating > Cursor, and then position
the cursors around the transition
of interest as shown in the following illustration.
12
Quick Tips
H
108
Tektronix offers a sophisticated power loss analysis package called TDSPWR3 that automates this and
many other power measurements. Contact your local Tektronix representative for details.
TDS5000B Series Quick Start User Manual
Application Examples
Using Acquisition Memory to Efficiently Capture Multiple
High Resolution Events
The record length of an instrument indicates how many sample points the instrument can acquire and store in a
single acquisition, while the sample rate determines how closely in time these samples are taken. If you set the
oscilloscope to run at the maximum sample rate, then the total time window acquired will be much shorter than
if you chose a slower sample rate. In other words, in normal operation the oscilloscope can either acquire a
shorter period of signal activity with high resolution or a much longer period of signal activity with lower
resolution.
Some applications, such as capturing laser or radar pulses, require that the instrument capture multiple events
over a long period of time with very high resolution. This example shows you how to use FastFrame to acquire
such signals. For this example, we are looking at a laser pulse that fires every 1-2 seconds but is only a few
nanoseconds wide. We want to capture 50 consecutive pulses and compare the wave shape of all 50 pulses.
1. Acquire the desired signal on
CH 1.
1
2. Push Autoset.
2
3. Use the horizontal and vertical
controls to display one occurrence of the event of interest.
3
TDS5000B Series Quick Start User Manual
109
Application Examples
4. Select FastFrame Setup....
4
5. Set Frame Count to 50.
6. Click FastFrame On.
7. Push Single to acquire one set of
50 events. When the oscilloscope
is done acquiring, all the trigger
status lights will go out and the
number of acquisitions specified
will readout above the graticule.
6
7
5
8. Click Frame, and then use the
multipurpose knob to scroll
through the frames.
9. Press Fine to scroll one frame at
a time.
9
8
10. Select Overlay.
11. Click # of Frames, and then click
the keypad icon.
10
11
12. Click Set to Max, and then Enter.
All the frames are overlaid with
the currently selected frame
shown in blue. (See following illustration.)
12
110
TDS5000B Series Quick Start User Manual
Application Examples
13. To continue comparing frames,
click Frame, and then use the
multi-purpose knobs to scroll as
in steps 8 and 9.
13
TDS5000B Series Quick Start User Manual
111
Application Examples
Using Limit Test to Verify Performance
Manufacturing test engineers often need to compare the performance of products coming off a manufacturing
line with a known good reference product. If the signals from the device under test (DUT) are within a
user-defined tolerance of the reference product, then the device passes the test. Use the following procedure to
perform this type of testing with your TDS5000B.
1. Acquire the desired signal on the
reference product.
1
2. Select Limit Test Setup....
2
3. From the Source list, select the
channel with the known good reference waveform.
4. From the Destination list, select
where you want to store the template.
5. Specify how much the DUT can
deviate from the template by
entering Vertical and Horizontal
tolerances.
3
4
5
6
6. Click Save. You have created a
template that is a snapshot of the
known good reference with the
specified tolerances built into it.
Notice that the template is automatically activated after you click
Save.
112
TDS5000B Series Quick Start User Manual
Application Examples
7. Move your probe from the reference product to the DUT.
7
8. Select the source channel that is
connected to the DUT.
9. Select the reference where you
saved the template in step 4.
8
9
10. Click Config to set up the Failure
Notification.
11. For this example, click Stop Acq
On, and then click Close to return
to the setup control window.
12. Click Lock Template to Waveform
On and Highlight Hits On.
10
11
12
13. Click On to start the test.
13
TDS5000B Series Quick Start User Manual
113
Application Examples
The instrument compares every waveform it acquires against the template until it finds one that fails. When a
failure occurs, acquisitions stop and the violation appears in a different color on the display. The following
example shows that we captured a signal that had significantly rolled off rising and falling edges.
114
TDS5000B Series Quick Start User Manual
Index
A
Accessories, 6
Acquisition
input channels and digitizers, 27
sampling, 27
Acquisition modes, defined, 30–32
Address, Tektronix, 4
Amplitude measurements, 63
ARM status light, 44
AutoBright, 50
Automatic trigger mode, 40
Autoscroll, 61
Autoset, 25
Autoset Undo, 25
Average acquisition mode, 30
B
Backlight timeout, 55
C
Calibration, 21
Center, defined, 76
Color palettes, 56
Communication
measurements, 67
trigger, 39
trigger, defined, 43
Compensate probe, 26
Control panel, 15
Control panel map, 17
Copying, 98
Coupling, trigger, 40
Cross hair graticule style, 54
Cursor measurements, 71
D
Date and time, 56
Default setup, 24
Delayed trigger, 41, 45
Diagnostics, 20
Digitizing rate, maximum, 29
TDS5000B Series Quick Start User Manual
Display
colors, 58
objects, 55
persistence, 49
style, 48
Display map, 16
Documentation, 3
Dots, displaying waveform record points as, 48
Dual monitor, 11
Duration, 76
E
E-mail on event, setup, 85
E-mail on trigger, 47
Edge trigger, 39
defined, 43
Emergency Startup disk, 10
Envelope acquisition mode, 30
Export. See Save
Extended desktop, 11, 104
F
Fast Acquisition, 101
FastAcq
defined, 34
interactions, 36
FastAqc/WfmDB palette, 56
FastFrame, 37
example, 109
Force trigger, 40
Frame graticule style, 54
Frequency domain controls, 75
Front panel map, 15
Full graticule style, 54
G
Gate position, defined, 76
Gate width and resolution bandwidth, 79
Gating, 68
Gating controls, 75
Glitch trigger, defined, 43
Glitches, capturing, 102
Graticule styles, 54
Grid graticule style, 54
Group delay, defined, 77
115
H
H Bars cursor, 71
Hi Res acquisition mode, 30
High resolution events, 109
Histogram measurements, 66
Histogram setup, 73
Horizontal delay, 47
Horizontal marker, 60
Horizontal position
and math waveforms, 75
defined, 24
Horizontal scale
and math waveforms, 75
defined, 24
I
Incoming inspection, 20
Infinite persistence, 49
Instrument setup
recalling, 96
saving, 95
Intensified samples, displaying waveforms as, 48
INTENSITY knob, 50
Interface map, 16
Interleaving, 29
Interpolation, 29, 52
IRE graticule style, 54
iView, 103
L
Label, 53
Language, change, 13
LCD backlight, 55
Limit test, 80
example, 112
Linear interpolation, 52
Lock zoomed waveforms, 61
Logic analyzer, correlating data, 103
Logic trigger, 39
M
Main trigger, 41, 45
Mask
autofit, 82
autoset, 82, 84
margin tolerance, 83
pass/fail testing, 84
116
Mask testing, 82
Math colors, 58
Math editor, 74
Math waveforms, 74
Measurement gating , interactions, 38
Measurements, 62
cursor, 71
defined, 63–67
reference levels, 70
saving, 97
snapshot, 69
statistics, 69
Measuring, switching loss example, 106
Monochrome gray color palette, 56
Monochrome green color palette, 57
More measurements, 65
Multiple zoom areas, 60
MultiView zoom, 59
mV graticule style, 54
MyScope
editing, 91
new control window, 87
using, 90
N
Network connection, 10
Normal color palette, 56
Normal trigger mode, 40
O
Objects, display, 55
Online help, 18
OpenChoice, example, 104
Operating specifications, 8
Overlay frames, 38
P
Pattern trigger, defined, 43
Peak Detect acquisition mode, 30
Performance verification, 3
Persistence, display, 49
Phase, suppression, 77
Phase data, displaying, 75
Phase unwrap, 77
Posttrigger, 39, 41
Power measurement, example, 106
Power supply, 8
Predefined math expressions, 74
TDS5000B Series Quick Start User Manual
Predefined spectral math expressions, 78
Pretrigger, 39, 41
Print, 99
Product support, 4
Pulse trigger, 39
R
Readout, trigger, 44
READY status light, 44
Rear panel map, 15
Recall
setup, 96
waveforms, 94
Record length, maximum, 29
Record view palette, 56
Recovery disk, 10
Reference colors, 58
Reference level offset, 77
Reference levels, 70
Related documentation, 3
Resolution, 76
Resolution bandwidth, 76
Right-click map, 19
Roll mode, 33
Roll mode interactions, 33
Runt trigger, defined, 43
S
Safety Summary, 1
Sample acquisition mode, 30
Sampling
equivalent-time, 27
real-time, 27
Sampling process, defined, 27
Saving
e-mail attachments, 86
measurements, 97
screen captures, 92
setup, 95
waveforms, 93
Screen cursor, 71
Screen shots, saving, 92
Screen text, 53
Scroll zoomed waveforms, 61
Segmented memory, 37
Sequential triggering, 45
Serial mask testing, 82
Service support, contact information, 4
Setup/Hold trigger, defined, 43
Side panel map, 15
TDS5000B Series Quick Start User Manual
Sin(x)/x interpolation, 52
Single sequence, 32
Snapshot, 69
Software, optional, 100
Span, defined, 76
Specifications
operating, 8
power supply, 8
Spectral analyzer
control locks, 75
controls, 75–78
Spectral averaging, 75
Spectral concepts, 75–77
Spectral grading color palette, 57
Spectral Math, concepts, 75–77
Spectral math expression, advanced, 78
Start an acquisition, 32
State trigger, defined, 43
Statistics, 69
Stop an acquisition, 32
T
Technical support, 4
Temperature grading color palette, 57
Template, 80
Time domain controls, 75
Time measurements, 64
Time Stamps, 38
defined, 37
Timeout trigger, defined, 43
Transition trigger, defined, 43
TRIG’D status light, 44
Trigger
concepts, 39–42
coupling, 40
forcing, 40
holdoff, 40
level, 41
modes, 40
posttrigger, 39, 41
pretrigger, 39, 41
readout, 44
slope, 41
types, 39
Trigger event, defined, 39
Trigger level markers, 55
Trigger types, defined, 43
117
U
Undo Last Autoset, 25
User defined color palette, 57
User preferences, 25, 42
V
V Bars cursor, 71
Variable persistence, 49
Vectors, displaying waveforms as, 48
Vertical position, 24
Vertical position and autoset, 25
Vertical units, 77
Video trigger, 39
defined, 43
W
Waveform
display style, 48
recalling, 94
118
saving, 93
Waveform cursors, 71
Waveform database acquisition mode, 31
Waveform record, defined, 28
Web site address, Tektronix, 4
Width trigger, defined, 43
Window trigger, defined, 43
X
X-Y display format, 51
XYZ display format, 51
Y
Y-T display format, 51
Z
Zoom, 59
Zoom graticule size, 59
TDS5000B Series Quick Start User Manual