1
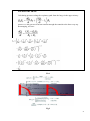
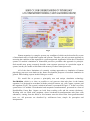
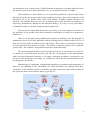
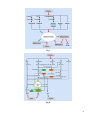
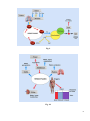
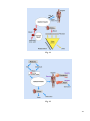
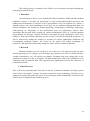
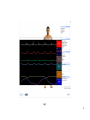
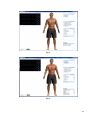
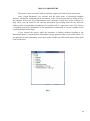
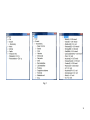
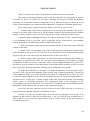
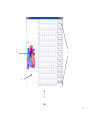
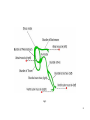
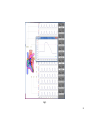
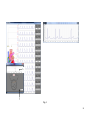
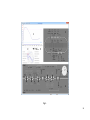
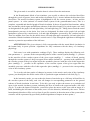
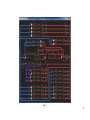
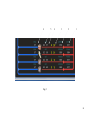
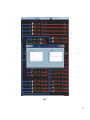
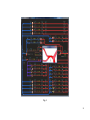
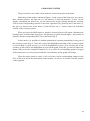
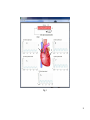
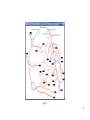
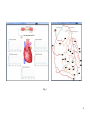
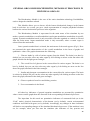
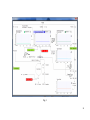
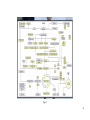
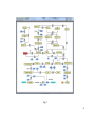
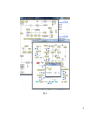
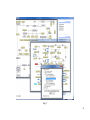
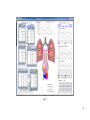
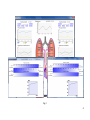
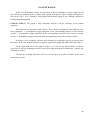
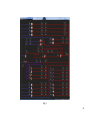
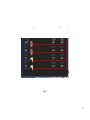
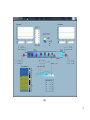
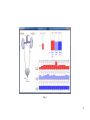
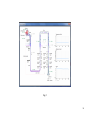
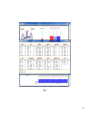
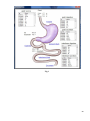
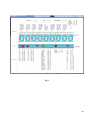
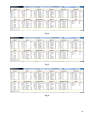
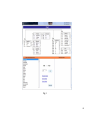
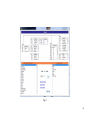
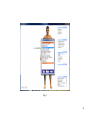
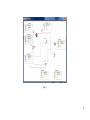
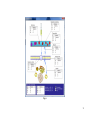
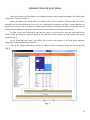
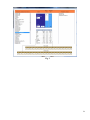
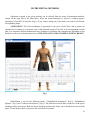
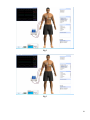
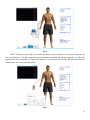
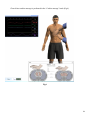
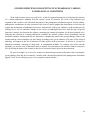
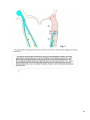
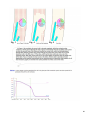
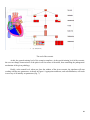
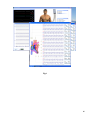
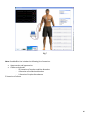
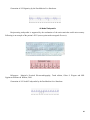
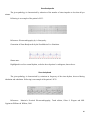
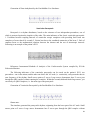
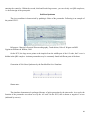
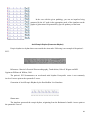
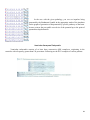
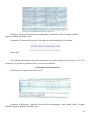
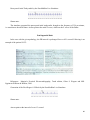
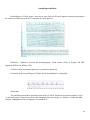
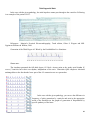
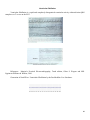
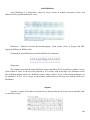
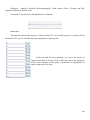
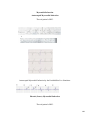
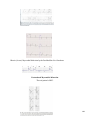
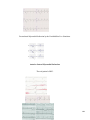
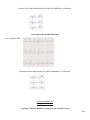
carbohydrates in this mode will be equal to 0), and biochemical processes will occur, as in the
real organism, at the expense of proteins, located in the muscle tissue, carbohydrates, formed
from glycogen in the liver and fats from the subcutaneous tissue.
Once organ metabolism is selected (the main menu shown in Fig.2), all chains of
biochemical transformations of different ingredients in a specific organ will be presented (the
organ is selected on the on-screen simulator), as well as all subsequent biochemical
transformations of derived substrates, including the Krebs cycle and the ornithine cycle, the
energy accumulation processes in the cells of the organism and the output of the final irreversible
breakdown products.
Here and further, for your convenience we will be using different colors in the names of
the corresponding substances. Highlighted in yellow are the key substances, presented in the full
cycle of transformations. For example, by left-clicking the yellow rectangle, labeled glucose, you
will get a complete graph of biochemical transformations of this substance in the organism
(Fig.3).
To obtain a real-time quantitative value of any key substance in a given scheme of
transformations, you need to left-click the yellow rectangle with the name of a particular
substance. As a result, the chemical formula of the substance and its quantitative value at a given
time will be presented (for example, the quantity of fructose-6-phosphate in Fig.4).
Red color marks the beginning or the end of a chain of transformations on this scheme
(entry point from the main menu of the regime). Blue color highlights the substances that are
attached or detached from the key substances directly in the course of a corresponding reaction
(quantitative values are not displayed). Pink color highlights intermediate substances, formed in
the process of metabolism, which have not yet completed their biochemical transformations in
this scheme and can be used in other schemes (quantitative values are not displayed). Green
color highlights the substances, consumed in the process of metabolism (quantitative values are
not displayed). Dark blue color highlights the names of specific parts of the scheme of
transformations.
In the main menu of this mode (Fig.2) some substances are highlighted in gray. The
quantitative values of some of them can be seen in the mode of systemic metabolism, while some
of their schemes are not detailed (quantitative values are not displayed).
All metabolites transformations from one to another are regulated by relevant enzyme
systems, indicated on all graphs in the form of round icons, labeled with E. An average enzyme
activity is set by default. At the left-click on the icon, labeled as enzyme system, a window
appears with the corresponding indicator of activity of the given enzyme. For example, Figure 5
demonstrates the activity of the glucose-6-phosphateisomerase enzyme (on the graph of glucose
transformations, found in Figure 3, this enzyme is located between glucose-6-phosphate and
fructose-6-phosphate).
37