1
Y-axis
By default, each plot is displayed with a fixed y-axis range based on the configuration
selected in the Device Configuration window. You have the option of either manually
modifying the y-axis to your own range or specifying an auto-scale method. To modify
the y-axis range right-click on the plot area to bring up the graph context menu.
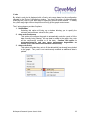
The Y-axis submenu provides 3 options:
1. Set Min/Max
Selecting this option will bring up a window allowing you to specify the
minimum and maximum values for the y axis.
2. Auto-scale Continuous
This option will configure the graph to automatically scale the y-axis to fit the
data currently being charted. As new data is added to the graph, the y-axis
will be continuously modified to fit the data. Caution: this option is
processor-intensive, and may cause performance degradation on
slower PCs if used on several channels concurrently.
3. Auto-scale Quick
This option will scale the y-axis to fit the data which has already been plotted
to the graph. The y-axis is not continuously modified as additional data is
plotted.
BioCapture Research System User’s Guide
19