1
OpenRPT
User Guide
© 1999-2006 OpenMFG, LLC
119 West York Street
Norfolk, VA 23510 USA
(757) 461-3022
1-2-0-RW
Table of Contents
1: Report Writer Basics ............................................................................ 1
OpenMFG Report Writer ................................................................................1
OpenRPT.........................................................................................................3
The Toolbar.....................................................................................................4
New File .......................................................................................................................................................5
Open File .....................................................................................................................................................5
Save File ......................................................................................................................................................6
Cut................................................................................................................................................................6
Copy .............................................................................................................................................................6
Paste.............................................................................................................................................................6
Show Grid ....................................................................................................................................................7
Snap to Grid.................................................................................................................................................9
Labels...........................................................................................................................................................9
Fields .........................................................................................................................................................12
Text Areas...................................................................................................................................................16
Lines...........................................................................................................................................................19
Bar Codes ..................................................................................................................................................21
Images........................................................................................................................................................24
Graph Editor..............................................................................................................................................27
Managing Report Definitions .......................................................................36
Loading Reports from a Database .............................................................................................................37
Saving to XML ...........................................................................................................................................38
Loading from XML.....................................................................................................................................40
Saving to a Database .................................................................................................................................42
Report Writer User Guide iii
Table of Contents
Parts of a Report Definition.......................................................................... 44
Section Editor ............................................................................................................................................44
Report Headers ..........................................................................................................................................45
Page Headers.............................................................................................................................................46
Report Footers ...........................................................................................................................................48
Page Footers..............................................................................................................................................49
Detail Sections ...........................................................................................................................................51
Group Sections...........................................................................................................................................56
2: Getting Started ................................................................................... 63
Modifying an Existing Report...................................................................... 63
Query Sources Overview............................................................................................................................65
Editing Labels ............................................................................................................................................67
Editing Fields.............................................................................................................................................69
Adding Bar codes.......................................................................................................................................73
Column Headings ......................................................................................... 78
Modifying Column Headings .....................................................................................................................80
Adding Column Headings..........................................................................................................................82
Modifying Query Sources ............................................................................ 85
Editing SQL Statements .............................................................................................................................87
Retrieving Data..........................................................................................................................................88
Total Fields ................................................................................................... 91
Adding Horizontal Lines..........................................................................................................................102
Counter Fields ............................................................................................ 104
3: Advanced Topics............................................................................... 113
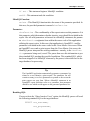
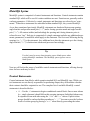
MetaSQL .................................................................................................... 113
MetaSQL in Practice ............................................................................................................................... 114
MetaSQL Syntax ...................................................................................................................................... 119
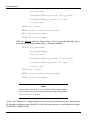
Control Statements.................................................................................................................. 119
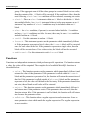
Functions................................................................................................................................. 120
MetaSQL Editor ......................................................................................... 121
Connecting to a Database .......................................................................................................
Entering a Query.....................................................................................................................
Defining Parameters and Values.............................................................................................
Parsing and Executing a Query...............................................................................................
Resulting Standard SQL .........................................................................................................
122
125
127
130
131
Report Renderer ......................................................................................... 133
Connecting to a Database........................................................................................................................133
iv Report Writer User Guide
Table of Contents
Ad Hoc Reports........................................................................................................................................136
Loading Report Definitions .....................................................................................................................139
Adding OpenRPT Renderer Runtime Parameters ...................................................................................142
Define Parameter .................................................................................................................... 143
Set Parameter Value................................................................................................................ 143
Changing Parameter Values.................................................................................................... 145
Deleting a Parameter...............................................................................................................................145
Generating the Ad Hoc Report ............................................................................................... 145
Watermarks and Background Images .........................................................146
Background Images .................................................................................................................................148
General.................................................................................................................................... 150
Layout ..................................................................................................................................... 150
Static Image ............................................................................................................................ 151
Watermarks ..............................................................................................................................................152
Bar Coding..................................................................................................153
Graphing .....................................................................................................160
Graphical Report Output .........................................................................................................................161
Graphical Report Definition....................................................................................................................162
Query Source .......................................................................................................................... 163
Color Definitions .................................................................................................................... 164
Defining the Graphing Object .................................................................................................................166
Graph Editor General Tab....................................................................................................... 166
Graph Editor Data Axis Tab ................................................................................................... 168
Graph Editor Value Tab.......................................................................................................... 169
Graph Editor Series Tab ......................................................................................................... 170
4: OpenRPT and ODBC ....................................................................... 173
The Access Database ..................................................................................173
Sample ODBC Connection.........................................................................176
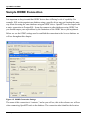
Creating the Report’s SQL with the MetaSQL Editor................................177
Connecting Through the ODBC Driver ...................................................................................................177
MetaSQL Parameters ..............................................................................................................................179
The Query ................................................................................................................................................179
Report Definition ........................................................................................182
Report Properties.....................................................................................................................................182
Creating the Query Source.......................................................................................................................183
Establishing Report Sections ...................................................................................................................184
Defining Parameters................................................................................................................................189
Saving the Report’s XML Definition File.................................................................................................192
Generating Reports with RPTRender .........................................................193
Connecting Through ODBC to the Database ..........................................................................................193
Report Writer User Guide v
Table of Contents
Opening the XML Report Definition........................................................................................................194
Setting Parameters at Run Time ..............................................................................................................197
RPTRender Run Time Switches................................................................................................................200
5: OpenMFG Topics ............................................................................. 203
Labels and Forms ....................................................................................... 203
Linking a Form Name to a Report Definition and Customer .................................................................205
Linking a Label to a Name and Report Definition...................................................................................209
Label and Form Parameters....................................................................................................................210
Print Packing List.................................................................................................................... 210
Print Shipping Form................................................................................................................ 210
Print Shipping Forms .............................................................................................................. 211
Print Shipping Labels by S/O # .............................................................................................. 212
Print Shipping Labels by Invoice............................................................................................ 212
Print Receiving Labels by PO #.............................................................................................. 213
Report Definition for Custom Labels.......................................................................................................214
Generating a Label Sheet........................................................................................................ 214
Label Report Definition .......................................................................................................... 215
Report Definition Page Setup ..................................................................................................................216
Displaying a Parameter Value ................................................................................................ 217
Label Report Query Definition ............................................................................................... 218
Linking Label Name to Report Definition.............................................................................. 221
CSVimp ...................................................................................................... 222
Report Importing Tools .............................................................................. 222
importrptgui .............................................................................................................................................223
importrpt ..................................................................................................................................................228
6: Tools ................................................................................................. 233
pgAdmin III................................................................................................ 233
Where Can I Find pgAdmin III? ..............................................................................................................234
Connecting to an OpenMFG Database ...................................................................................................234
What is ODBC?.......................................................................................... 237
Locating the ODBC Driver For PostgreSQL ..........................................................................................238
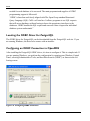
Configuring an ODBC Connection to OpenMFG ...................................................................................238
Capturing SQL with MS Query.................................................................. 240
What is MS Query? ..................................................................................................................................240
Using Predefined Queries in OpenRPT ...................................................................................................241
vi Report Writer User Guide
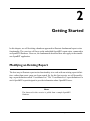
1
Report Writer Basics
This chapter is designed to orient you to some of the basic properties of the OpenMFG report
writer—whether you’re running the version embedded within the OpenMFG ERP Suite, or the
standalone OpenRPT application.
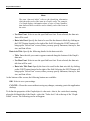
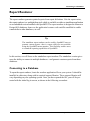
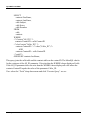
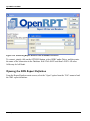
OpenMFG Report Writer
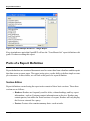
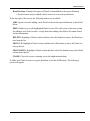
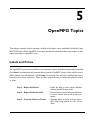
To open the report writer embedded within the OpenMFG application, log in to an OpenMFG
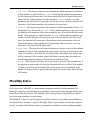
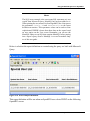
database using an OpenMFG client. From the Master Information section of the System Module, select the “Reports” option, as shown in the following screen:
Report Writer User Guide 1
Report Writer Basics
Figure 1.1: Opening the Embedded OpenMFG Report Writer
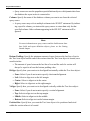
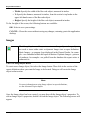
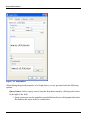
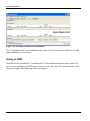
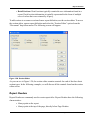
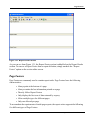
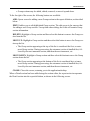
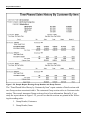
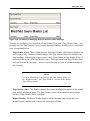
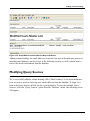
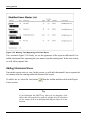
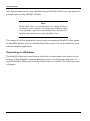
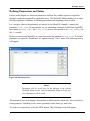
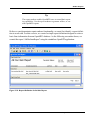
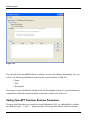
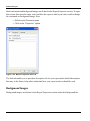
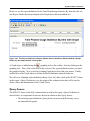
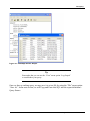
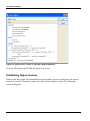
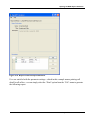
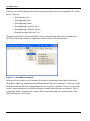
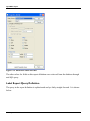
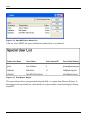
After you select the “Reports” option, the report definitions master list will appear, as shown
below. The report definitions master list serves as the starting point for working with OpenMFG reports.
Figure 1.2: OpenMFG Report Definitions Master List
2 Report Writer User Guide
The report definitions master list displays information on all existing OpenMFG reports,
including report name, grade, and description.
Tip
Standard OpenMFG report definitions are delivered with a grade of
“0”. By default, the OpenMFG client runs the highest numbered
grade. To ensure that you can always return to the baseline version
of a report, save your report definitions with a grade higher than 0.
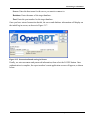
OpenRPT
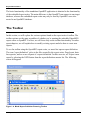
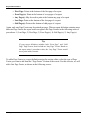
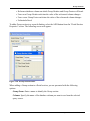
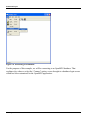
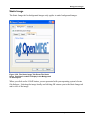
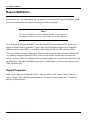
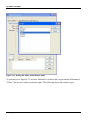
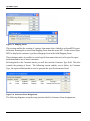
To open the standalone OpenRPT application, locate the OpenRPT executable file on your system. Then run the file to open it and reach the application desktop. The OpenRPT application
desktop is shown in the following screenshot:
Figure 1.3: OpenRPT Application Desktop
Report Writer User Guide 3
Report Writer Basics
The basic functionality of the standalone OpenRPT application is identical to the functionality
of the embedded report writer. The main difference is that OpenRPT can connect to any target
database, whereas the embedded report writer may only be used by OpenMFG users connected to an OpenMFG database.
The Toolbar
In this section, we will explore the various options found on the report writer’s toolbar. The
toolbar options are the same regardless of whether you’re running the embedded OpenMFG
report writer or OpenRPT. For now, we will focus only on the toolbar functionality. In subsequent chapters, we will explain how to modify existing reports and also how to create new
reports.
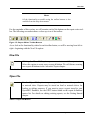
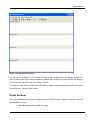
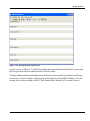
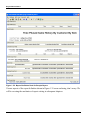
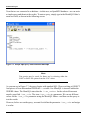
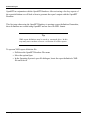
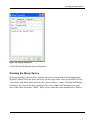
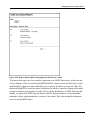
To see the toolbar using the OpenMFG report writer, we must first open a report definition.
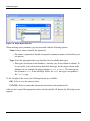
The term “report definition” refers to the files created by the report writer. Page layout, database queries, and so on are all parts of a report definition. For this exercise, we’ll open a new
report by selecting the NEW button from the report definitions master list. The following
screen will appear:
Figure 1.4: Blank Report Definition Featuring Toolbar
4 Report Writer User Guide
New File
Note
All the functionality accessible using the toolbar buttons is also
available from the drop-down menus.
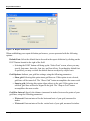
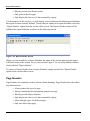
For the remainder of this section, we will examine each of the buttons on the report writer toolbar. The following screenshot shows a close-up view of the toolbar:
Figure 1.5: Report Writer Toolbar Buttons
As we look at the functionality related to each toolbar button, we will be moving from left to
right—beginning with the New File option.
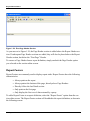
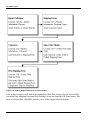
New File
Clicking the “New File” option opens a new instance of the report writer.
Select this option to create a new report definition. We will discuss creating
new report definitions in the Advanced Topics chapter.
Table 1.1: New File Button
Open File
Use the “Open File” option to open a report definition stored on your local
or network drive. Reports may be stored on local or network drives for
backup or editing purposes. If you want to open a report stored in your
OpenMFG Database, use the EDIT button found on the report definitions
master list. For details on editing existing reports, see the Getting Started
chapter.
Table 1.2: Open File Button
Report Writer User Guide 5
Report Writer Basics
Save File
The “Save File” option enables you to save report definitions to your local
or network drive, where they may be stored for backup or editing purposes.
This option will not save report definitions to a database. To learn more
about saving reports to a database, see the “Saving to a Database” section.
Report definitions are saved using the Extensible Markup Language (XML)
format.
Table 1.3: Save File Button
Cut
The “Cut” option enables you to click on an object in a report definition,
remove it, and then, using the “Paste” option, insert it to another part of the
report.
Table 1.4: Cut Object Button
Copy
The “Copy” option enables you to click on an object in a report, copy it
(leaving the original in place), and then, using the “Paste” option, insert it
into another part of the report.
Table 1.5: Copy Object Button
Paste
The “Paste” option enables you to insert into the report definition an object
that has been cut or copied using the “Cut” option or the “Copy” option.
Table 1.6: Paste Object Button
6 Report Writer User Guide
Show Grid
Show Grid
The “Show Grid” option enables you to turn grid lines on for visual reference when aligning objects in a report definition. This option is a toggle,
meaning grid lines may be turned on or off using this button.
Table 1.7: Show Grid Button
Clicking the “Show Grid” button turns grid lines on. The following screenshot shows a report
definition with grid lines turned on:
Figure 1.6: Grid Lines On
Clicking the “Show Grid” button a second time turns grid lines off, as shown in the following
screenshot:
Figure 1.7: Grid Lines Off
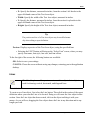
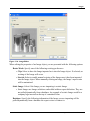
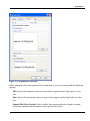
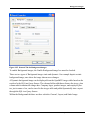
If you want to change the properties of your grid lines, the report writer gives you the ability to
do so. To change your grid line settings, select the “Preferences” option from the Edit menu.
The following screen will appear:
Report Writer User Guide 7
Report Writer Basics
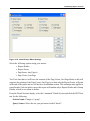
Figure 1.8: Report Preferences
When establishing your report definition preferences, you are presented with the following
options:
Default Font: Select the default font to be used in the report definition by clicking on the
FONT button located to the right of the field.
• Selecting the FONT button will bring up the “Select Font” screen, where you may
specify font name, font style, font size, and font effects. Even though a default font
is specified, you may override the default font on an object-by-object basis.
Grid Options: Indicate your grid line settings, using the following parameters:
• Show grid: Selecting this option turns grid lines on. If this option is not selected,
grid lines will be turned off. The “Show Grid” button accomplishes the same result.
• Snap to grid: Selecting this option aligns objects to the grid. If this option is not
selected, grid lines will not be aligned to the grid. The “Snap to Grid” button
accomplishes the same results.
Grid Size Interval: Specify the distance (measured in inches) between the points of your
grid lines, using the following parameters:
• X Interval: Enter an interval for the horizontal axis of your grid, measured in
inches.
• Y Interval: Enter an interval for the vertical axis of your grid, measured in inches.
8 Report Writer User Guide
Snap to Grid
• Symmetrical values: Select if you want the X axis and the Y axis to use the same
interval between points. If selected, you will not be able to enter an interval for the
Y axis.
To the far right of the screen, the following buttons are available:
OK: Select to save your settings.
CANCEL: Closes the screen without saving any changes, returning you to the application
desktop.
Snap to Grid
The “Snap to Grid” option forces objects to align to the grid when grid lines
are turned on. This option is a toggle, meaning snap to grid functionality
may be turned on or off using this button.
Table 1.8: Snap to Grid Button
Labels
The “Label” option enables you to create new Label objects. Label objects
are used to display descriptive information on a report definition, such as
titles, headings, etc.
Table 1.9: Label Button
To create a new Label object, first select the Label button. Then click in the section of the
report definition where you want the Label to be located. Doing so will create the Label object
in that section.
Note
For more information on using Label objects in report definitions,
see the Getting Started chapter.
Report Writer User Guide 9
Report Writer Basics
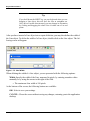
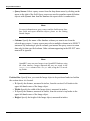
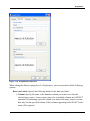
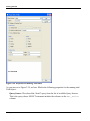
Once the Label object has been created, you may then define the Label object’s properties. To
define a Label object’s properties, double-click on the Label object. The following screen will
appear:
Figure 1.9: Label Properties
When defining the properties of a Label object, you are presented with the following options:
Text: Enter the text of the Label.
• Text entered here will display in the “Preview” section of the screen.
HAlign: Specify how you want text to be aligned horizontally within the Label object:
•
•
•
•
None: Select if you do not want to specify a horizontal alignment.
Left: Select to align text on the left margin.
Center: Select to align text in the center.
Right: Select to align text on the right margin.
VAlign: Specify how you want text to be aligned vertically within the Label object:
• None: Select if you do not want to specify a vertical alignment.
10 Report Writer User Guide
Labels
• Top: Select to align text on the top margin.
• Middle: Select to align text in the middle.
• Bottom: Select to align text on the bottom margin.
Position/Size: Specify how you want the Label object to be positioned and sized within
the section where it is located.
• X: Specify the distance, measured in inches, from the section’s left border to the
upper-left-hand corner of the Label object.
• Width: Specify the width of the Label object, measured in inches.
• Y: Specify the distance, measured in inches, from the section’s top border to the
upper-left-hand corner of the Label object.
• Height: Specify the height of the Label object, measured in inches.
Tip
The position and size of a Label object may be modified manually
when editing a report definition.
Preview: Displays a preview of the Label text, using the specified font.
• Selecting the FONT button will bring up the “Select Font” screen, where you may
specify font name, font style, font size, and font effects.
To the far right of the screen, the following buttons are available:
OK: Select to save your settings.
CANCEL: Closes the screen without saving any changes, returning you to the application
desktop.
Report Writer User Guide 11
Report Writer Basics
Fields
The “Field” option enables you to create new Field objects. Field objects are
used for pulling dynamically generated data into a report from the database
the report writer is connected to. For example, a Field object may be used to
include running totals in a report. By definition, Field objects are designed
to handle a single line of data. For multiple lines of data, use a Text Area
object.
Table 1.10: Field Object Button
To create a new Field object, first select the Field button. Then click in the section of the report
definition where you want the Field to be located. Doing so will create the Field object in that
section.
Note
For more information on using Field objects in report definitions,
see the Getting Started chapter.
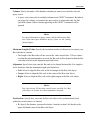
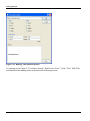
Once the Field object has been created, you may then define the Field object’s properties. To
define a Field object’s properties, double-click on the Field object. The following screen will
appear:
12 Report Writer User Guide
Fields
Figure 1.10: Field Properties
Note
By definition, Field objects are designed to handle a single line of
data. For multiple lines of data, use a Text Area object.
Report Writer User Guide 13
Report Writer Basics
When defining the properties of a Field object, you are presented with the following options:
Query Source: Select a query source from the drop-down menu by clicking on the arrow
to the right of the field.
• Query sources are used to populate report definition objects with dynamic data from
the database the report writer is connected to.
Column: Specify the name of the database column you want to use from the selected
query source.
• A query source may refer to multiple columns in its SELECT statement. By indicating a specific column, you instruct the query source to return data only for that
specified column. Other columns appearing in the SELECT statement will be
ignored.
Note
For more information on query sources and the link between database fields and report definition objects, please see the Getting
Started chapter.
Display as Running Total: Select if you want the data retrieved from the database to be
displayed as a running total.
• No running total will be used if this option is not selected.
Note
When running totals are calculated for columns designated as Boolean, the “true” values are assigned a value of “1,” while “false” values are assigned a value of “0.”
Total Format: If the “Display as Running Total” option is selected, specify one of the following formatting options:
• String Format: Enter a string format to use when formatting the total.
14 Report Writer User Guide
Fields
• Built-in Locale Format: Select this option and then choose one of the available
options from the drop-down menu by clicking on the arrow to the right of the field.
Built-in Locale Formats may only be available in some installations.
• Use Subtotal Value: Select if the running total represents a subtotal.
HAlign: Specify how you want text to be aligned horizontally within the Field object:
•
•
•
•
None: Select if you do not want to specify a horizontal alignment.
Left: Select to align text on the left margin.
Center: Select to align text in the center.
Right: Select to align text on the right margin.
VAlign: Specify how you want text to be aligned vertically within the Field object:
•
•
•
•
None: Select if you do not want to specify a vertical alignment.
Top: Select to align text on the top margin.
Middle: Select to align text in the middle.
Bottom: Select to align text on the bottom margin.
Position/Size: Specify how you want the Field object to be positioned and sized within the
section where it is located.
• X: Specify the distance, measured in inches, from the section’s left border to the
upper-left-hand corner of the Field object.
• Width: Specify the width of the Field object, measured in inches.
• Y: Specify the distance, measured in inches, from the section’s top border to the
upper-left-hand corner of the Field object.
• Height: Specify the height of the Field object, measured in inches.
Tip
The position and size of a Field object may be modified manually
when editing a report definition.
Preview: Displays a preview of the Field, using the specified font.
• Selecting the FONT button will bring up the “Select Font” screen, where you may
specify font name, font style, font size, and font effects.
To the far right of the screen, the following buttons are available:
Report Writer User Guide 15
Report Writer Basics
OK: Select to save your settings.
CANCEL: Closes the screen without saving any changes, returning you to the application
desktop.
Text Areas
The “Text Area” option enables you to create new Text Area objects. Text
Area objects are used for pulling dynamically generated, multi-line data into
a report from the database the report writer is connected to. By definition,
Text Area objects are designed to handle multiple lines of data.
Table 1.11: Text Area Button
To create a new Text Area object, first select the Text Area button. Then click in the section of
the report definition where you want the Text Area to be located. Doing so will create the Text
Area object in that section.
Note
For more information on using Text Area objects in report definitions, see the Getting Started chapter.
Once the Text Area object has been created, you may then define the Text Area object’s properties. To define a Text Area object’s properties, double-click on the Text Area object. The following screen will appear:
16 Report Writer User Guide
Text Areas
Figure 1.11: Text Area Properties
Note
By definition, Text Area objects are designed to handle multiple
lines of data.
When defining the properties of a Text Area object, you are presented with the following
options:
Query Source: Select a query source from the drop-down menu by clicking on the arrow
to the right of the field.
Report Writer User Guide 17
Report Writer Basics
• Query sources are used to populate report definition objects with dynamic data from
the database the report writer is connected to.
Column: Specify the name of the database column you want to use from the selected
query source.
• A query source may refer to multiple columns in its SELECT statement. By indicating a specific column, you instruct the query source to return data only for that
specified column. Other columns appearing in the SELECT statement will be
ignored.
Note
For more information on query sources and the link between database fields and report definition objects, please see the Getting
Started chapter.
Bottom Padding: Specify the minimum amount of space between the last line of text in
the Text Area object and the end of the section where the Text Area object is located, measured in inches.
• The amount of space between the last line of text and the end of a section will
always be equal to at least the bottom padding value.
HAlign: Specify how you want text to be aligned horizontally within the Text Area object:
•
•
•
•
None: Select if you do not want to specify a horizontal alignment.
Left: Select to align text on the left margin.
Center: Select to align text in the center.
Right: Select to align text on the right margin.
VAlign: Specify how you want text to be aligned vertically within the Text Area object:
•
•
•
•
None: Select if you do not want to specify a vertical alignment.
Top: Select to align text on the top margin.
Middle: Select to align text in the middle.
Bottom: Select to align text on the bottom margin.
Position/Size: Specify how you want the Text Area object to be positioned and sized
within the section where it is located.
18 Report Writer User Guide
Lines
• X: Specify the distance, measured in inches, from the section’s left border to the
upper-left-hand corner of the Text Area object.
• Width: Specify the width of the Text Area object, measured in inches.
• Y: Specify the distance, measured in inches, from the section’s top border to the
upper-left-hand corner of the Text Area object.
• Height: Specify the height of the Text Area object, measured in inches.
Tip
The position and size of a Text Area object may be modified manually when editing a report definition.
Preview: Displays a preview of the Text Area object, using the specified font.
• Selecting the FONT button will bring up the “Select Font” screen, where you may
specify font name, font style, font size, and font effects.
To the far right of the screen, the following buttons are available:
OK: Select to save your settings.
CANCEL: Closes the screen without saving any changes, returning you to the application
desktop.
Lines
The “Line” option enables you to create new Line objects. Line objects are
used for drawing vertical, horizontal, and diagonal lines.
Table 1.12: Line Button
To create a new Line object, first select the Line button. Then click in the section of the report
definition where you want the Line to be located. Doing so will create the Line object in that
section. Once the Line object has been created, click on the object and drag it with your
mouse. As you will see, dragging the Line object draws the Line in any direction and to any
length you wish.
Report Writer User Guide 19
Report Writer Basics
Tip
If you hold down the SHIFT key on your keyboard when you are
dragging a Line object, this will force the Line to straighten out.
Also, once a Line has been inserted, you may change its orientation
by clicking and dragging the whole Line or either one of its end
points.
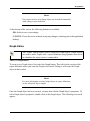
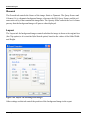
After you have inserted a Line object into a report definition, you may then define the width of
the Line object. To define the width of a Line object, double-click on the Line object. The following screen will appear:
Figure 1.12: Line Width
When defining the width of a Line object, you are presented with the following options:
Width: Specify the width of the Line, measured in pixels, by entering a number either
manually or by using the arrows to the right of the field.
• The maximum Line width is 100 pixels.
At the bottom of the screen, the following buttons are available:
OK: Select to save your settings.
CANCEL: Closes the screen without saving any changes, returning you to the application
desktop.
20 Report Writer User Guide
Bar Codes
Bar Codes
The “Bar Code” option enables you to create new Bar code objects. Bar
code objects are used to represent dynamic information stored in a database
in Bar code format.
Table 1.13: Bar code Button
To create a new Bar code object, first select the Bar code button. Then click in the section of
the report definition where you want the Bar code to be located. Doing so will create the Bar
code object in that section.
Note
For more information on using Bar code objects in report definitions, see the Getting Started and Advanced Topics chapters.
Once the Bar code object has been created, you may then define the Bar code object’s properties. To define a Bar code object’s properties, double-click on the Bar code object. The following screen will appear:
Report Writer User Guide 21
Report Writer Basics
Figure 1.13: Bar Code Properties
When defining the properties of a Bar code object, you are presented with the following
options:
Format: Select one of the Bar code formatting options from the drop-down menu by
clicking on the arrow to the right of the field.
• The report writer supports the following Bar code formats: 3of9, 3of9+, 128, ean13,
ean8, upc-a, and upc-e.
Query Source: Select a query source from the drop-down menu by clicking on the arrow
to the right of the field.
• Query sources are used to populate report definition objects with dynamic data from
the database the report writer is connected to.
22 Report Writer User Guide
Bar Codes
Column: Specify the name of the database column you want to use from the selected
query source.
• A query source may refer to multiple columns in its SELECT statement. By indicating a specific column, you instruct the query source to return data only for that
specified column. Other columns appearing in the SELECT statement will be
ignored.
Note
For more information on query sources and the link between database fields and report definition objects, please see the Getting
Started chapter.
Maximum Length of Value: Specify the maximum number of characters you expect your
Bar code data to contain.
• The length of the Bar code will not exceed the value entered here. If fewer characters than the maximum number are used, the Bar code will be aligned within the Bar
code object based on the alignment specified below.
Alignment: Specify how you want the Bar code to be aligned horizontally if its length is
fewer characters than the maximum length specified above:
• Left: Select to align the Bar code on the left margin of the Bar code object.
• Center: Select to align the Bar code in the center of the Bar code object.
• Right: Select to align the Bar code on the right margin of the Bar code object.
Note
Bar codes always fill the entire vertical space specified for a Bar
code object. As a result, no vertical alignment is required.
Position/Size: Specify how you want the Bar code object to be positioned and sized
within the section where it is located.
• X: Specify the distance, measured in inches, from the section’s left border to the
upper-left-hand corner of the Bar code object.
Report Writer User Guide 23
Report Writer Basics
• Width: Specify the width of the Bar code object, measured in inches.
• Y: Specify the distance, measured in inches, from the section’s top border to the
upper-left-hand corner of the Bar code object.
• Height: Specify the height of the Bar code object, measured in inches.
To the far right of the screen, the following buttons are available:
OK: Select to save your settings.
CANCEL: Closes the screen without saving any changes, returning you to the application
desktop.
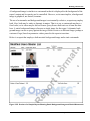
Images
The “Image” option enables you to create new Image objects. Image objects
are used to insert either static or dynamic Images into a report definition.
Static Images—a company logo displayed in the Report Header, for example—are embedded within the report definition. Dynamic Images—pictures
of products, for example—are pulled from the database the report writer is
connected to.
Table 1.14: Image Object Button
To create a new Image object, first select the Image button. Then click in the section of the
report definition where you want the Image to be located. Doing so will create the Image
object in that section.
Note
For more information on using Image objects in report definitions,
see the Advanced Topics chapter.
Once the Image object has been created, you may then edit the Image object’s properties. To
edit an Image object’s properties, double-click on the Image object. The following screen will
appear:
24 Report Writer User Guide
Images
Figure 1.14: Image Editor
When editing the properties of an Image object, you are presented with the following options:
Resize Mode: Specify one of the following resizing preferences:
• Clip: Select to have the Image imported as-is into the Image object. If selected, no
resizing of the Image will occur.
• Stretch: Select to enable manual resizing of the Image once it has been imported
into the Image object. When manually resizing an Image, the Image’s aspect ratio
will be maintained.
Static Image: Select if the Image you are importing is a static Image.
• Static Images are Images which are embedded within a report definition. They are
not pulled dynamically from a database. An example of a static Image would be a
company logo inserted on the top of a standard Form.
Database: Specify the following information if the Image you are importing will be
pulled dynamically from a database the report writer is connect to:
Report Writer User Guide 25
Report Writer Basics
• Query Source: Select a query source from the drop-down menu by clicking on the
arrow to the right of the field. Query sources are used to populate report definition
objects with dynamic data from the database the report writer is connected to.
Note
For more information on query sources and the link between database fields and report definition objects, please see the Getting
Started chapter.
• Column: Specify the name of the database column you want to use from the
selected query source. A query source may refer to multiple columns in its SELECT
statement. By indicating a specific column, you instruct the query source to return
data only for that specified column. Other columns appearing in the SELECT statement will be ignored.
Note
OpenMFG users can store Images in an OpenMFG Database using
the client interface. Images imported this way are stored in the
image_data column of the images table, using the UU encoding format.
Position/Size: Specify how you want the Image object to be positioned and sized within
the section where it is located.
• X: Specify the distance, measured in inches, from the section’s left border to the
upper-left-hand corner of the Image object.
• Width: Specify the width of the Image object, measured in inches.
• Y: Specify the distance, measured in inches, from the section’s top border to the
upper-left-hand corner of the Image object.
• Height: Specify the height of the Image object, measured in inches.
26 Report Writer User Guide
Graph Editor
Note
The position and size of an Image object may be modified manually
when editing a report definition.
At the bottom of the screen, the following buttons are available:
OK: Select to save your settings.
CANCEL: Closes the screen without saving any changes, returning you to the application
desktop.
Graph Editor
The “Graph” option enables you to create new Graph objects. Graph objects
are used to insert Graphs into a report definition using dynamic data stored
in a database the report writer is connected to.
Table 1.15: Graph Button
To create a new Graph object, first select the Graph button. Then click in the section of the
report definition where you want the Graph to be located. Doing so will create the Graph
object in that section.
Note
For more information on using Graph objects in report definitions,
see the Advanced Topics chapter.
Once the Graph object has been created, you may then edit the Graph object’s properties. To
edit a Graph object’s properties, double-click on the Graph object. The following screen will
appear:
Report Writer User Guide 27
Report Writer Basics
Figure 1.15: Graph Editor
When editing the general properties of a Graph object, you are presented with the following
options:
Query Source: Select a query source from the drop-down menu by clicking on the arrow
to the right of the field.
• Query sources are used to populate report definition objects with dynamic data from
the database the report writer is connected to.
28 Report Writer User Guide
Graph Editor
Note
For more information on query sources and the link between database fields and report definition objects, please see the Getting
Started chapter.
Position/Size: Specify how you want the Image object to be positioned and sized within
the section where it is located.
• X: Specify the distance, measured in inches, from the section’s left border to the
upper-left-hand corner of the Image object.
• Width: Specify the width of the Image object, measured in inches.
• Y: Specify the distance, measured in inches, from the section’s top border to the
upper-left-hand corner of the Image object.
• Height: Specify the height of the Image object, measured in inches.
Tip
The position and size of a Graphic object may be modified manually when editing a report definition.
Base Font: Select the base font to be used in the Graph object by clicking on the FONT
button located to the right of the field.
• Selecting the FONT button will bring up the “Select Font” screen, where you may
specify font name, font style, font size, and font effects. The base font may be used
throughout the Graph object.
Title: Specify the following details for the Graph object’s title:
• Title: Enter the title you want to appear centered at the top of the Graph.
• Use Base Font: Select to use the specified base font. If not selected, the title font
will be used.
Report Writer User Guide 29
Report Writer Basics
• Title Font: Specify the font to be used for the Graph object’s title by clicking on the
FONT button located to the right of the field. Selecting the FONT button will bring
up the “Select Font” screen, where you may specify font name, font style, font size,
and font effects.
At the bottom of the screen, the following buttons are available:
OK: Select to save your settings.
CANCEL: Closes the screen without saving any changes, returning you to the application
desktop.
To define the properties of the Graph object’s data axis—that is, the horizontal axis running
along the bottom of the Graph—select the “Data Axis” tab at the top of the “Graph Editor”
screen. The following screen will appear:
30 Report Writer User Guide
Graph Editor
Figure 1.16: Graph Editor Data Axis
When editing the data axis properties of a Graph object, you are presented with the following
options:
Data Axis Labels: Specify the following details for the data axis labels:
• Column: Specify the name of the database column you want to use from the
selected query source. A query source may refer to multiple columns in its SELECT
statement. By indicating a specific column, you instruct the query source to return
data only for that specified column. Other columns appearing in the SELECT statement will be ignored.
Report Writer User Guide 31
Report Writer Basics
Note
The term “data axis labels” refers to the identifying information
which describes each of the items in a Graph’s series. For example,
if a Graph displays information about a series of Item Numbers,
then data axis labels would be used to identify each of the Items in
the series.
• Use Base Font: Select to use the specified base font. If not selected, the data axis
font will be used.
• Data Axis Font: Specify the font to be used for the data axis labels by clicking on
the FONT button located to the right of the field. Selecting the FONT button will
bring up the “Select Font” screen, where you may specify font name, font style, font
size, and font effects.
Data Axis Title: Specify the following details for the data axis title:
• Title: Enter the title you want to appear centered along the bottom of the Graph’s
data axis.
• Use Base Font: Select to use the specified base font. If not selected, the data axis
title font will be used.
• Data Axis Title Font: Specify the font to be used for the data axis title by clicking
on the FONT button located to the right of the field. Selecting the FONT button will
bring up the “Select Font” screen, where you may specify font name, font style, font
size, and font effects.
At the bottom of the screen, the following buttons are available:
OK: Select to save your settings.
CANCEL: Closes the screen without saving any changes, returning you to the application
desktop.
To define the properties of the Graph object’s value axis—that is, the vertical axis running
along the left-hand side of the Graph—select the “Value Axis” tab at the top of the “Graph
Editor” screen. The following screen will appear:
32 Report Writer User Guide
Graph Editor
Figure 1.17: Graph Editor Value Axis
When editing the value axis properties of a Graph object, you are presented with the following
options:
Min: Specify the minimum value you want to have appear on the Graph object’s value
axis.
Max: Specify the maximum value you want to have appear on the Graph object’s value
axis.
Expand Min/Max if needed: Select to allow data represented in the Graph to expand
beyond the minimum and maximum values specified if needed.
Report Writer User Guide 33
Report Writer Basics
• If not selected, data will be restricted to the limits specified for the minimum and
maximum values.
Use Base Font: Select to use the specified base font. If not selected, the value axis font
will be used.
Value Axis Font: Specify the font to be used for values in the value axis by clicking on
the FONT button located to the right of the field.
• Selecting the FONT button will bring up the “Select Font” screen, where you may
specify font name, font style, font size, and font effects.
Value Axis Title: Specify the following details for the value axis title:
• Title: Enter the title you want to appear centered along the left-hand margin of the
Graph’s value axis.
• Use Base Font: Select to use the specified base font. If not selected, the value axis
title font will be used.
• Value Axis Title Font: Specify the font to be used for the value axis title by clicking on the FONT button located to the right of the field. Selecting the FONT button
will bring up the “Select Font” screen, where you may specify font name, font style,
font size, and font effects.
At the bottom of the screen, the following buttons are available:
OK: Select to save your settings.
CANCEL: Closes the screen without saving any changes, returning you to the application
desktop.
To define the properties of Graph object series, select the “Series” tab at the top of the “Graph
Editor” screen. The following screen will appear:
34 Report Writer User Guide
Graph Editor
Figure 1.18: Graph Editor Series
When editing the properties of a Graph object series, you are presented with the following
options:
Series: Select a series from the drop-down menu by clicking on the arrow to the right of
the field.
• Each Graph must contain at least one series—and may contain multiple series.
Using multiple series enables you to compare and contrast information from different database columns within a single Graph. To create a new series, select the NEW
Report Writer User Guide 35
Report Writer Basics
button. By default, a new series will be given the name “New Series.” You may edit
this default name within the “Name” field below. To remove a series from the list of
series, select the REMOVE button.
Note
You may assign different properties to each series in a graph (e.g.,
different colors) to make a clear visual distinction between series.
Series Properties: Specify properties for the selected series using the following options:
• Name: Displays the name of the series. You may edit the name of the series using
this field. Any editing changes will be saved automatically.
• Column: Specify the name of the database column you want to use from the
selected query source. A query source may refer to multiple columns in its SELECT
statement. By indicating a specific column, you instruct the query source to return
data only for that specified column. Other columns appearing in the SELECT statement will be ignored.
• Color: Specify the color you want to use to represent data in the series. Selecting
the EDIT button will bring up several color definition screens. You have the ability
to specify multiple colors, using either the included color wheel or standard RGB
values.
• Style: Specify one of the following options to be used for representing items in the
series: “Bars,” “Lines,” or “Points.”
At the bottom of the screen, the following buttons are available:
OK: Select to save your settings.
CANCEL: Closes the screen without saving any changes, returning you to the application
desktop.
Managing Report Definitions
Report definitions created using the report writer are saved in Extensible Markup Language
(XML) format. This is a universal standard file format, which simplifies the process of file
36 Report Writer User Guide
Loading Reports from a Database
sharing. Report definitions may be loaded into the report writer from a database, saved locally
as XML, transferred via email or other method, and then uploaded for use in a different database. In this section, we will describe how to manage report definitions—moving them from a
database to a local drive and back to a database again.
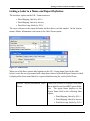
Loading Reports from a Database
For the purposes of this exercise, we will assume we are connecting to an OpenMFG Database, using the OpenMFG report writer. However, you would follow similar steps using the
standalone OpenRPT application connected to a different database.
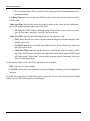
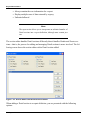
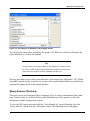
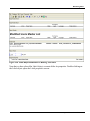
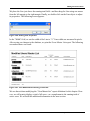
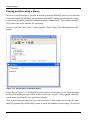
To begin with, let’s load an existing report definition into the report writer from an OpenMFG
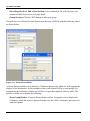
Database. From the Master Information section of the System Module, select the “Reports”
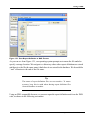
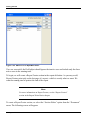
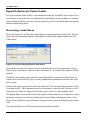
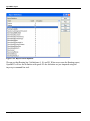
option. The master list of report definitions will appear, as shown below:
Figure 1.19: Master List of Report Definitions in OpenMFG Database
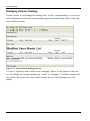
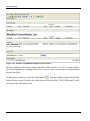
We will be working with an OpenMFG report definition called “UsersMasterList.” This is a
report which details information about OpenMFG user accounts. We can load the report definition into the report writer simply by opening it. To open the report definition, double-click
on it—or highlight it and then select the EDIT button. The following screen will appear:
Report Writer User Guide 37
Report Writer Basics
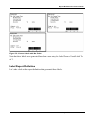
Figure 1.20: Load Report Definition from Database
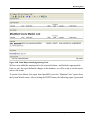
The “UsersMasterList” is now loaded into the report writer. Our next step will be to save the
report definition to a local drive.
Saving to XML
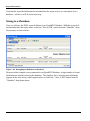
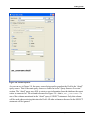
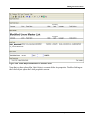
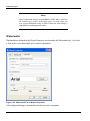
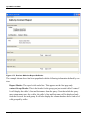
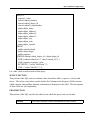
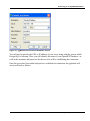
Now that we have loaded the “UsersMasterList” report definition into the report writer, let’s
save it to our local drive in XML format. To do so, select the “Save As” option from the “File”
drop-down menu. The following screen will appear:
38 Report Writer User Guide
Saving to XML
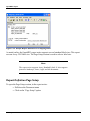
Figure 1.21: Save Report Definition to XML Format
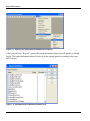
As you can see from Figure 1.21, our operating system prompts us to name the file and also
specify a storage location. We navigate to a directory where other report definitions are stored
and then give the file the same name it had when it was stored in the database. We also add the
“.xml” extension to the end of the file name.
Tip
The names of report definition files are case-sensitive. To ensure
accuracy, keep this in mind when sharing report definition files
from one database to another.
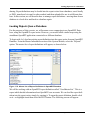
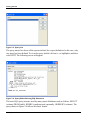
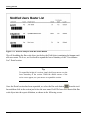
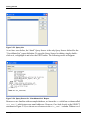
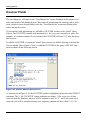
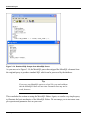
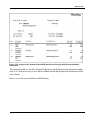
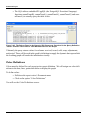
Using an XML-compatible browser, we can now open the report definition and view the XML
code, as shown in the following screenshot:
Report Writer User Guide 39
Report Writer Basics
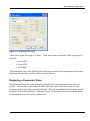
Figure 1.22: Report Definition XML Rendered in a Browser
So, we have stored the report definition on our local drive in the portable XML format. We are
now able to share the file with other users, load it into the report writer for editing, or save it to
another database.
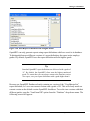
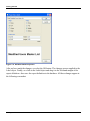
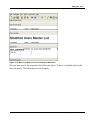
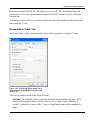
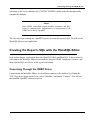
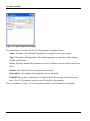
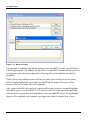
Loading from XML
Before we can save a locally-stored report definition to another database, we must first load
the XML file into the report writer. To load a locally-stored report definition into the report
writer, select either the “Open File” button or the “Open” option from the “File” drop-down
menu. The following screen will appear:
40 Report Writer User Guide
Loading from XML
Figure 1.23: Loading XML File into the Report Writer
As Figure 1.23 shows, our operating system prompts us to locate the file we want to load into
the report writer. Once we locate and select the file, the report writer loads it, as shown in the
following screenshot:
Figure 1.24: Report Definition Loaded from XML File
Report Writer User Guide 41
Report Writer Basics
Now that the report definition has been loaded into the report writer, we can transfer it to a
database—which we will do in our next step.
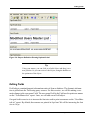
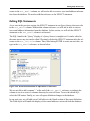
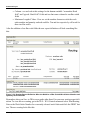
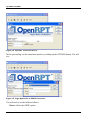
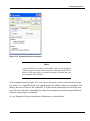
Saving to a Database
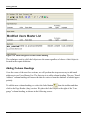
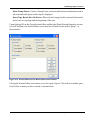
Next we will save the XML report definition to an OpenMFG Database. With the report definition loaded into the report writer, select the “Save to DB” option from the “Database” dropdown menu, as shown below:
Figure 1.25: Saving Report Definition to Database
Because in this example we are connected to an OpenMFG Database, a large number of report
definitions are already stored on the database. The complete list of stored report definitions
appears in the next screen, which appears after we select the “Save to DB” option from the
“Database” drop-down menu:
42 Report Writer User Guide
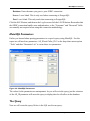
Saving to a Database
Figure 1.26: Save Report to Database with a Higher Grade
OpenMFG can only generate reports using report definitions which are saved to its database.
To distinguish between different versions of a report definition, the report writer employs
grades. By default, OpenMFG uses the report definition with the highest grade.
Tip
Standard OpenMFG report definitions are delivered with a grade of
“0”. By default, the OpenMFG client runs the highest numbered
grade. To ensure that you can always return to the baseline version
of a report, save your report definitions with a grade higher than 0.
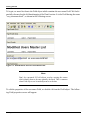
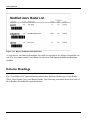
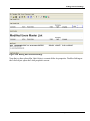
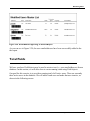
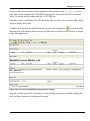
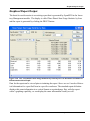
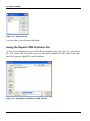
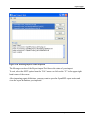
Because our OpenMFG Database already contains one version of the “UsersMasterList”
report definition, let’s save our current version with a grade of 50. This will clearly mark our
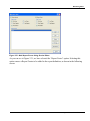
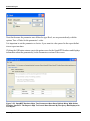
current version as the default version OpenMFG should use. To see the two versions with their
different grades, open the “Load from DB” option from the “Database” drop-down menu. The
following screen will appear:
Report Writer User Guide 43
Report Writer Basics
Figure 1.27: Note Multiple Grades for a Single Report
Keep in mind once again that OpenMFG will use the “UsersMasterList” report definition with
grade 50 when executing this report.
Parts of a Report Definition
Report definitions are structured documents used to extract data from a database and then print
that data on one or more pages. The report writer gives you the ability to define simple or complex structures. In this section, we will look at the parts of a report definition.
Section Editor
Report definitions created using the report writer consist of three basic sections. Those three
sections are as follows:
• Headers: Headers are frequently used for titles, column headings, and key report
information—such as Customer contact information on an Invoice. Headers may
contain queries, but unlike the Detail sections of a report, Headers will only display
the first row returned for a query.
• Footers: Footers often contain summary data—such as totals.
44 Report Writer User Guide
Report Headers
• Detail Sections: Detail sections typically contain the core information found in a
report. Detail section information is typically represented in the form of multiple
rows of values that were returned by a query.
To add sections to or remove sections from a report definition, use the section editor. To access
the section editor, open a report definition and select the “Section Editor” option from the
“Document” drop-down menu. The following screen will appear:
Figure 1.28: Section Editor
As you can see in Figure 1.28, the section editor contains controls for each of the three basic
section types. In the following examples, we will discuss all the controls found on the section
editor screen.
Report Headers
Report Headers are commonly used to create report titles. Report Headers have the following
characteristics:
• Always print on the report
• Always print at the top of the page, directly below Page Headers
Report Writer User Guide 45
Report Writer Basics
• Directly precede first Detail section
• Only print on the first page
• Only display the first row of data returned by a query
For the purposes of this exercise, we will assume we are working with a blank report definition
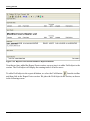
having no sections currently defined. To add a Report Header to a report definition, select the
“Report Header” option from the section editor screen. The Report Header section will be
added to the report definition, as shown in the following screen:
Figure 1.29: Report Header Section
When a section is added to a report definition, the name of the section appears in the upperleft-hand corner of the section. As you can see from Figure 1.29, our newly-added section is
clearly labeled “Report Header.”
To remove a Report Header from a report definition, simply uncheck the “Report Header”
option on the section editor screen.
Page Headers
Page Headers are commonly used to contain column headings. Page Headers have the following characteristics:
•
•
•
•
•
•
Always print at the top of a page
Always contain the first information printed on a page
Directly precede Report Headers
Only display the first row of data returned by a query
Allow multiple types for different pages
Only one allowed per page
46 Report Writer User Guide
Page Headers
To accomodate the requirements of multi-page reports, the report writer supports the following
five different types of Page Headers:
•
•
•
•
•
First Page: Prints at the top of the first page of a report
Even Page(s): Prints at the top of even pages of a report
Any Page(s): May be used to print at the top of any page of a report
Last Page: Prints at the top of the last page of a report
Odd Page(s): Prints at the top of odd pages of a report
Again, only one Page Header may be printed per page. When a report definition contains more
than one Page Header, the report writer recognizes the Page Headers in the following order of
precedence: 1) First Page; 2) Last Page; 3) Even Page(s); 4) Odd Page(s); 5) Any Page(s).
Tip
If your report definition includes both “Even Page” and “Odd
Page” Page Headers, don’t include an “Any Page” Header. Based
on the report writer’s precedence rules, the “Any Page” Header
would never print in this scenario.
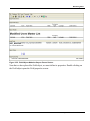
To add a Page Header to a report definition using the section editor, select the type of Page
Header you want to add from the “Page Header” section of the screen. For this exercise, we
will add a first Page Header, as shown in the following screen:
Report Writer User Guide 47
Report Writer Basics
Figure 1.30: First Page Header Section
As you can see in Figure 1.30, the Page Header section is added above the Report Header section. If subsequent Page Header sections are added, they will also be placed above the Report
Header section, but below the “First Page” Header.
To remove a Page Header from a report definition, simply uncheck the Page Header option
you selected on the section editor screen.
Report Footers
Report Footers are commonly used to display report totals. Report Footers have the following
characteristics:
•
•
•
•
•
Always print on the report
Always print at the bottom of the page, directly above Page Headers
Directly follow the last Detail section
Only print on the first page
Only display the first row of data returned by a query
To add a Report Footer to a report definition, select the “Report Footer” option from the section editor screen. The Report Footer section will be added to the report definition, as shown in
the following screen:
48 Report Writer User Guide
Page Footers
Figure 1.31: Report Footer Section
As you can see from Figure 1.31, the Report Footer section is added below the Report Header
section. To remove a Report Footer from a report definition, simply uncheck the “Report
Footer” option on the section editor screen.
Page Footers
Page Footers are commonly used to contain report totals. Page Footers have the following
characteristics:
•
•
•
•
•
•
Always print at the bottom of a page
Always contain the last information printed on a page
Directly follow Report Footers
Only display the first row of data returned by a query
Allow multiple types for different pages
Only one allowed per page
To accomodate the requirements of multi-page reports, the report writer supports the following
five different types of Page Footers:
Report Writer User Guide 49
Report Writer Basics
•
•
•
•
•
First Page: Prints at the bottom of the first page of a report
Even Page(s): Prints at the bottom of even pages of a report
Any Page(s): May be used to print at the bottom any page of a report
Last Page: Prints at the bottom of the last page of a report
Odd Page(s): Prints at the bottom of odd pages of a report
Again, only one Page Footer may be printed per page. When a report definition contains more
than one Page Footer, the report writer recognizes the Page Footers in the following order of
precedence: 1) Last Page; 2) First Page; 3) Even Page(s); 4) Odd Page(s); 5) Any Page(s).
Tip
If your report definition includes both “Even Page” and “Odd
Page” Page Footers, don’t include an “Any Page” Footer. Based on
the report writer’s precedence rules, the “Any Page” Footer would
never print in this scenario.
To add a Page Footer to a report definition using the section editor, select the type of Page
Footer you want to add from the “Page Footer” section of the screen. For this exercise, we will
add a first Page Footer, as shown in the following screen:
50 Report Writer User Guide
Detail Sections
Figure 1.32: Page Footer Section
As you can see in Figure 1.32, the Page Footer section is added below the Report Footer section. If subsequent Page Footer sections are added, they will also be placed below the Report
Footer section, but above the “First Page” Footer.
To remove a Page Footer from a report definition, simply uncheck the Page Header option you
selected on the section editor screen.
Detail Sections
The core information in a report is displayed in its Detail section. Detail sections have the following characteristics:
• Generally print in the middle of a page
Report Writer User Guide 51
Report Writer Basics
• Always contain the core information for a report
• Display multiple rows of data returned by a query
• Unlimited allowed
Note
The report writer allows you to incorporate an unlimited number of
Detail sections into a report definition, although most contain just
one.
The section editor handles Detail sections differently than it handles Header and Footer sections—that is, the process for adding and managing Detail sections is more involved. The following screen shows the section editor with a Detail section added:
Figure 1.33: Section Editor with Detail Sections Added
When adding a Detail section to a report definition, you are presented with the following
options:
52 Report Writer User Guide
Detail Sections
Detail Sections: Displays the names of Detail sections added to the report definition.
• Detail sections may be added, edited, removed, or moved up and down.
To the far right of the screen, the following buttons are available:
ADD: Opens screen for adding a new Detail section to the report definition, as described
below.
EDIT: Enables you to edit highlighted Detail section. The edit screen is the same as that
for adding a new Detail section—except that when editing, the fields will contain Detail
section information.
DELETE: Highlight a Detail section and then select this button to remove the Detail section from the list.
MOVE UP: Highlight a Detail section and then select this button to move the Detail section up the list.
MOVE DOWN: Highlight a Detail section and then select this button to move the Detail
section down the list.
CLOSE: Closes the screen, returning you to the application desktop.
To add a new Detail section to a report definition, select the ADD button. The following
screen will appear:
Report Writer User Guide 53
Report Writer Basics
Figure 1.34: Add New Detail Section
When adding a new Detail section to a report definition, you are presented with the following
options:
Section Name: Enter a name to identify the Detail section.
Query Source: Select a query source from the drop-down menu by clicking on the arrow
to the right of the field.
• Query sources are used to populate report definition objects with dynamic data from
the database the report writer is connected to.
Note
For more information on query sources and the link between database fields and report definition objects, please see the Getting
Started chapter.
Group Sections: Displays the names of Group sections added to the report definition.
54 Report Writer User Guide
Detail Sections
• Group sections may be added, edited, removed, or moved up and down.
To the far right of the screen, the following buttons are available:
ADD: Opens screen for adding a new Group section to the report definition, as described
below.
EDIT: Enables you to edit highlighted Group section. The edit screen is the same as that
for adding a new Group section—except that when editing, the fields will contain Group
section information.
DELETE: Highlight a Group section and then select this button to remove the Group section from the list.
MOVE UP: Highlight a Group section and then select this button to move the Group section up the list.
• The Group section appearing at the top of the list is considered the first, or outermost Group section. During processing, the outermost section is handled first, followed by the next innermost section, and then the next innermost, etc.
MOVE DOWN: Highlight a Group section and then select this button to move the Group
section down the list.
• The Group section appearing at the bottom of the list is considered last, or innermost Group section. During processing, the outermost section is handled first, followed by the next innermost section, and then the next innermost, etc.
CLOSE: Closes the screen, returning you to the application desktop.
When a Detail section has been added using the section editor, the report writer incorporates
the Detail section into the report definition, as shown in the following screen:
Report Writer User Guide 55
Report Writer Basics
Figure 1.35: Detail Section
As you can see in Figure 1.35, the Detail section has been added to the report definition. The
Detail section appears in the middle of the page, sandwiched between the Report Header and
Report Footer.
Group Sections
While most reports can be defined using a single Detail section having multiple columns and
rows of data, others require summary data—such as subtotals. For reports requiring summary
data, the report writer supports Group sections. Group sections have the following characteristics:
•
•
•
•
Always associated with Detail sections
Defined by Group Headers and Group Footers
Group Headers always print above Detail sections
Group Footers always print below Detail sections
56 Report Writer User Guide
Group Sections
•
•
•
•
Reference database column on which Group Headers and Group Footers will break
Force new Group Header each time the value of the referenced column changes
Force a new Group Footer each time the value of the referenced column changes
Unlimited allowd
To add a Group section to a report definition, select the ADD button from the “Detail Section
Properties” screen. The following screen will appear:
Figure 1.36: Group Section Editor
When adding a Group section to a Detail section, you are presented with the following
options:
Group Name: Enter a name to identify the Group section.
Column: Specify the name of the database column you want to use from the selected
query source.
Report Writer User Guide 57
Report Writer Basics
• A query source may refer to multiple columns in its SELECT statement. By indicating a specific column, you instruct the query source to return data only for that
specified column. Other columns appearing in the SELECT statement will be
ignored.
Note
For more information on query sources and the link between database fields and report definition objects, please see the Getting
Started chapter.
Show Group Header: Select to include a Group Header in the report definition.
• The Group Header will print above the Detail section. If not selected, no Group
Header will be included in the report definition.
Tip
Be sure to specify a Group Header and/or a Group Footer. Without
either, no Group section will print on the report definition.
Show Group Footer: Select to include a Group Footer in the report definition.
• The Group Header will print below the Detail section. If not selected, no Group
Footer will be included in the report definition.
At the bottom of the screen, the following buttons are available:
OK: Select to save your settings.
CANCEL: Closes the screen without saving any changes, returning you to the application
desktop.
When a Group Header and Group Footer have been added using the section editor, the report
writer incorporates both sections into the report definition, as shown in the following screen:
58 Report Writer User Guide
Group Sections
Figure 1.37: Group Headers and Footers
As you can see in Figure 1.37, the Group Header has been added above the Detail section, and
the Group Footer has been added below the Detail section.
To better understand the relationship between Detail sections and Group Headers and Group
Footers, let’s look at a sample report generated from data in an OpenMFG Database. The following Sales Analysis report is called “Time Phased Sales History by Customer by Item”:
Report Writer User Guide 59
Report Writer Basics
Figure 1.38: Sample Report Showing Group Headers and Group Footers
The “Time-Phased Sales History by Customer by Item” report contains a Detail section with
two Group sections associated with it. The outermost Group section refers to Customer information. The second, innermost Group section refers to Item information. Basically, if you
study the report shown in Figure 1.38, you will see that the sections are printed in the following descending order:
1. Group Header (Customers
2. Group Header (Items
60 Report Writer User Guide
Group Sections
3. Detail Section (Dates/Amounts)
4. Group Footer (Items)
5. Group Footer (Customers)
Because the report contains data for two Customers, you can see in the screenshot that the
sequence of sections repeats itself twice. You can also see that Group Footers are used to provide both Item and Customer subtotals. As we mentioned earlier, Group sections are commonly used for summary information.
Note
Group Headers and Group Footers are powerful features which
enable you to generate reports which provide multiple levels of
detail and roll-up values. However, you will find that most report
definitions will conform to the following basic structure:
•
Page Header: Any Page(s)
•
Detail Section
•
Page Footer: Any Page(s)
The report shown in Figure 1.38 is the actual report printed from data in an OpenMFG Database. The following screenshot shows the report definition used to generate the sample report.
Report Writer User Guide 61
Report Writer Basics
Figure 1.39: Report Definition Used for Sample Report
If some aspects of the report definition shown in Figure 1.39 seem confusing, don’t worry. We
will be covering the mechanics of report writing in subsequent chapters.
62 Report Writer User Guide
2
Getting Started
In this chapter, we will be taking a hands-on approach to illustrate fundamental report writer
functionality. The exercises will focus on the embedded OpenMFG report writer, connected to
an OpenMFG Database. However, the fundamentals described here also apply to the standalone OpenRPT application.
Modifying an Existing Report
The best way to illustrate report writer functionality is to work with an existing report definition—rather than create a new one from scratch. So, for this first exercise we will be modifying a report definition called “UsersMasterList.” The “UsersMasterList” report definition is a
stock OpenMFG report designed to provide information about OpenMFG users.
Note
The data used in this exercise is pulled from a sample OpenMFG
Database.
Report Writer User Guide 63
Getting Started
To begin, we must first log in to OpenMFG. By logging in, we automatically connect to an
OpenMFG Database. The user information we will be working with is stored in the OpenMFG
Database.
We can access the “UsersMasterList” report by selecting the “Reports” option from the “Master Information” section of the System Module. Scroll down the master list of report definitions until you reach the “UsersMasterList” report. Highlight the report, then select the EDIT
button. The following screen will appear:
Figure 2.1: Users Master List Report Definition
In the Report Writer Basics chapter, we discussed the importance of grades—and how multiple versions of the same report may be stored on a database using different grades. By default,
OpenMFG uses the report definition having the highest grade.
To differentiate our working version of the “UsersMasterList” report definition from the standard version, we will save it with a different grade. To save a report definition with a different
grade, select the “Save to DB” option from the “Database” menu. The following screen will
appear:
64 Report Writer User Guide
Query Sources Overview
Figure 2.2: Save Report to Database with a Higher Grade
We will keep the same name, but change the grade to 50. When we select the OK button, the
report definition is saved to the database.
Tip
If you want to save your changes to the database, be sure to select
the “Save to DB” option. Report definitions stored on a local or network drive may also be saved to a database in this way.
We have now made a copy of the report definition—and assigned it a high grade (“50”). When
OpenMFG runs the report, it will use our version of the report definition because ours has been
assigned the highest grade in the sample database.
Query Sources Overview
The report writer uses Structured Query Language (SQL) to retrieve information from a database. In this section, we will look at how report definitions use SQL queries to collect the
information which is displayed in a report.
To view the SQL query associated with the “UsersMasterList” report definition, select the
“Query Sources” option from the “Document” menu. The following screen will appear:
Report Writer User Guide 65
Getting Started
Figure 2.3: Query List
The query master list shows all the queries defined for a report definition. In this case, only
one query has been defined. To view the query, double-click on it—or highlight it and then
select EDIT. The following screen will appear:
Figure 2.4: Query Editor Showing SQL Statement
The basic SQL query structure used by many report definitions reads as follows: SELECT
(column) FROM (table) WHERE (condition) and, optionally, ORDER BY (column). The
query shown in Figure 2.4 follows this basic format.
66 Report Writer User Guide
Editing Labels
Readers familiar with SQL may have noticed portions of the statement surrounded by <?...?>
tags. These tags signal the use of MetaSQL. MetaSQL is an embedded query language
designed to make SQL queries dynamic. The MetaSQL language was developed by OpenMFG for use by the report writer.
Note
For more information on MetaSQL, the embedded query language
designed by OpenMFG to make SQL queries dynamic, please see
the Advanced Topics chapter.
We could edit the query shown in Figure 2.4, using the query editor. But at this point, we simply want to familiarize ourselves with the query. We will be making cosmetic changes to the
report in the next sections.
Editing Labels
Label objects contain static text displayed in a report. Text is considered static if it resides in a
report definition and is not pulled dynamically from a database. A report title is an example of
static text contained within a Label object. In our next exercise, we will show how to modify a
report title.
To change the title appearing on the “UsersMasterList” report definition, locate the Label
object containing the title in the Report Header section. The title of the report is “Users Master
List.” Double-clicking on the object will open the Label properties screen. We will change the
text of the Label and align the text on the left margin, as shown in the following screen:
Report Writer User Guide 67
Getting Started
Figure 2.5: Modified Label Properties
After we have made the changes, we select the OK button. The changes are now applied to the
Label object. Finally, we click on the Label object and drag it to the left-hand margin of the
report definition—then save the report definition to the database. All these changes appear in
the following screenshot:
68 Report Writer User Guide
Editing Fields
Figure 2.6: Report Definition Showing Updated Label
Tip
Using your mouse, you can click on a Label object and drag it to a
new position. Or you can resize a Label object, using the handles on
the perimeter of the object.
Editing Fields
Field objects contain dynamic information retrieved from a database. The dynamic information is pulled into the Field using query sources. For this exercise, we will be making a cosmetic change to the user name Field. The user name Field is the Field used to print user names
on the “UsersMasterList” report. Later, we will add a new Field object.
Our goal in this exercise is to increase the font size used to print user names on the “UsersMasterList” report. By default, these names are printed in 8-pt font. We will be increasing the font
size to 14-pt.
Report Writer User Guide 69
Getting Started
To begin, we must first locate the Field object which contains the user name Field. We find it
partially obscured on the left-hand margin of the Detail section. It is the Field having the name
“usr_username:detail”, as shown in the following screen:
Figure 2.7: Standard Size Font for User Name Field
Note
Don’t be concerned if Field objects overlap, causing the names
which identify them to become partially obscured. This is common
when Field objects are located adjacent to each other.
To edit the properties of the user name Field, we double-click on the Field object. The following Field properties screen will appear.
70 Report Writer User Guide
Editing Fields
Figure 2.8: Field Properties
As you can see in Figure 2.8, the query source being used to populate the Field is the “detail”
query source. This is the same query source we looked at in the “Query Sources Overview”
section. The “detail” query uses SQL to retrieve user information from the database the report
writer is connected to. The column referenced in Figure 2.8—that is, usr_username— is
one of the columns mentioned in the “detail” query’s SELECT statement. Only this column
will be used when retrieving data into the Field. All other columns referenced in the SELECT
statement will be ignored.
Report Writer User Guide 71
Getting Started
Note
This explains how Field names are determined: They begin with the
name of a column referenced in a query source, and are followed by
the name of the very same query source. And so, in our current
example, we get “usr_username:detail.”
For now, we are concerned only with changing the font size used to print user names on the
“UsersMasterList” report. We select the FONT button at the bottom of the screen and specify a
14-pt font size. After we select the OK button, we see the change reflected in the report definition, as shown below:
Figure 2.9: Enlarged Font Size for User Name Field
For now, we won’t worry about the length of the Field. We will, however, adjust the height of
the Field object to accommodate the larger font. Once we have saved our changes to the database, we can run the report and see how our updates have affected the printed results.
To run the report from within OpenMFG, open the “Maintain Users” option from the System
Module menu. After selecting the PRINT button, the report will print out as follows:
72 Report Writer User Guide
Adding Bar codes
Figure 2.10: Modified Report Output
As you can see in Figure 2.10, the user names have in fact been printed in 14-pt font, as
expected. The information contained in other Fields—active status, proper name, initials,
etc.—still appears in the default 8-pt font. Notice that the printed title of the report has also
been modified, per our report definition changes.
Adding Bar codes
Now that we have a made a few cosmetic changes to a report definition, we are now ready to
make a more significant change. In this next exercise, we will add a Bar code object to print
user names in Bar code format.
The mechanics of adding a Bar code object
Field object
are the same as adding a human-readable
. When we are done, we will have a report that looks like the following:
Report Writer User Guide 73
Getting Started
Figure 2.11: Preview of Report with Bar Codes Added
We will be adding the Bar code object just below the Field object containing the human-readable user name. To do so, we first need to expand the lower boundary of the “UsersMasterList” Detail section.
Tip
To expand the height of a section, simply hold your mouse over the
lower boundary of the section. When the double arrows of the
resize cursor appear, use your mouse to expand the section.
Once the Detail section has been expanded, we select the Bar code button
from the toolbar and then click in the section just below the user name Field. We have now inserted the Bar
code object into the report definition, as shown in the following screen.
74 Report Writer User Guide
Adding Bar codes
Figure 2.12: Bar Code Object Inserted into Report Definition
We must now specify the properties of the Bar code object. To do so, we double-click on the
Bar code object. The following screen will appear:
Report Writer User Guide 75
Getting Started
Figure 2.13: Bar Code Properties
Like Field objects, Bar code objects contain dynamic information retrieved from a database.
As you can see in Figure 2.13, the Bar code properties screen requires a Query Source and column name. The dynamic information we need for this exercise is the same as we needed in the
“Editing Fields” section—namely, user names retrieved from the usr table. The only difference here is that we will be representing user names in Bar code format. We enter the following parameters:
Format: 3of9
• The report writer supports the following Bar code formats: 3of9, 3of9+, 128, ean13,
ean8, upc-a, and upc-e.
Query Source: detail
Column: usr_username
Maximum Length of Value: 10
• Specifies the maximum number of characters the Bar code is expected to contain.
76 Report Writer User Guide
Adding Bar codes
After we select the OK button, we see the Bar code object has been updated in the report definition, as shown below:
Figure 2.14: Detail Section with Bar Code Added
As you can see, the Bar code object is now identified with the name “usr_username:detail barcode.” This name refers to the column and Query Source which will be used to generate user
name data in Bar code format. Before we save our changes to the database, we click on the
right side of the Bar code object and drag it to make it longer.
We have now successfully created a Bar code object that will print in “3of9” format—one of
several widely-used Bar code formats supported by the report writer. Now let’s print the report
and see the results.
To print the Users Master List, select the “Maintain Users” option from the System Module
menu. When the master list of users appears, select the PRINT button. The following screen
shows a portion of the printed report:
Report Writer User Guide 77
Getting Started
Figure 2.15: Report with Bar-Coded Username
As you can see, the final result matches the result we expected to see when we began this section. The user names on the Users Master List are now both human-readable and machinereadable.
Column Headings
The “UsersMasterList” report definition utilizes three different Header types: Page Header
(First), Page Header (Any), and Report Header. The following screenshot shows how each of
these Headers fits within the report definition:
78 Report Writer User Guide
Adding Bar codes
Figure 2.16: Technique for Managing Report Title and Column Headings
You may be wondering if we need both a Page Header (First) and a Page Header (Any)—particularly since the Page Header (First) is empty. But this technique actually serves a useful purpose, as explained below:
Page Header (First): This is blank because the Report Header, which always displays on
the first page only, contains column headings. The Page Header (Any) also contains column headings. Following the report writer’s rules of precedence, a Page Header (First), if
defined, prints in place of a Page Header (Any). This logic ensures the Page Header (Any)
does not print on the first page—and so we avoid having two sets of column headings on
the first page.
Note
For more information on precedence and other Header details, see
the “Report Headers” and “Page Headers” sections in the Report
Writer Basics chapter.
Page Header (Any): This Header contains the column headings that appear on the second
page and all subsequent pages. The Page Header (Any) will not print on the first page
because a Page Header (First) is defined.
Report Header: The Report Header displays on the first page only. In this case, the
Report Header contains both a report title and report columns.
Report Writer User Guide 79
Getting Started
Modifying Column Headings
For this exercise, we will change the wording of the “Locale” column heading. As you can see
in the following screenshot, this column heading appears in both the Page Header (Any) and
Report Header sections:
Figure 2.17: Locale Column Heading Selected
A Locale is frequently used to define a user’s language. And so, for the purpose of this exercise, let’s change the column heading from “Locale” to “Language.” To edit the column heading, double-click on the Label object which contains the text. The following screen will
appear:
80 Report Writer User Guide
Modifying Column Headings
Figure 2.18: Label Properties for Column Heading
As you can see in Figure 2.18, we have entered the new wording in the “Text” field. We make
the same change to the “Locale” column heading found in the Report Header. And after saving
the changes to the database, we see them both applied to the report definition, as shown below:
Report Writer User Guide 81
Getting Started
Figure 2.19: Label Changed for Locale Column Heading
The techniques used to edit Label objects are the same regardless of where a Label object is
located in the report definition.
Adding Column Headings
Over the course of the next few sections, we will perform the steps necessary to add email
addresses to our Users Master List. The first step is to add a column heading. The new “Email
Address” column heading will ensure the data we retrieve from the database is labeled appropriately.
To add the new column heading, we select the Label button
from the toolbar and then
click in the Page Header (Any) section. We place the Label object to the right of the “Language” column heading, as shown in the following screen:
82 Report Writer User Guide
Adding Column Headings
Figure 2.20: Adding New Column Headings
Now that we have placed the Label object, we must define its properties. Double-clicking on
the Label object opens the Label properties screen:
Report Writer User Guide 83
Getting Started
Figure 2.21: Column Heading Properties
As you can see in Figure 2.21, we have entered “Email Address” in the “Text” field. This is
the text which will appear as a column heading. We repeat the same steps to add the same new
column heading to the Report Header section. And after moving the Label objects into place
using our mouse and saving the changes to the database, the column headings are located
where we want them, as shown in the following screen:
84 Report Writer User Guide
Adding Column Headings
Figure 2.22: Email Address Labels Added to Report Definition
Adding column headings for email addresses is only the first step in the multi-step process of
inserting email addresses into the report. In the following sections, we will examine how to
retrieve the needed information from the database.
Modifying Query Sources
We’ve successfully added a column heading called “Email Address” to our report definition.
Now we need to work on retrieving user email addresses from the database. To begin, let’s
look at the Query Sources defined for this report definition. To view the available Query
Sources, select the “Query Sources” option from the “Database” menu. The following screen
will appear:
Report Writer User Guide 85
Getting Started
Figure 2.23: Query List
As we have seen before, the “detail” Query Source is the only Query Source defined for the
“UsersMasterList” report definition. To open the Query Source for editing, simply doubleclick on it, or highlight it and select the EDIT button. The following screen will appear:
Figure 2.24: Query Source for “UsersMasterList” Report
Because we are familiar with our sample database, we know the usr table has a column called
usr_email, which stores user email addresses. However, if we look closely at the SELECT
statement in Figure 2.24, we do not see references to the usr_email column. Without a ref86 Report Writer User Guide
Editing SQL Statements
erence to the usr_email column, we will not be able to retrieve user email address information from the database. We need to add that reference to the SELECT statement.
Editing SQL Statements
As we saw in the previous section, the SELECT statement in our Query Source does not refer
to the usr_email column. Without that column reference, we will not be able to retrieve
user email address information from the database. In this section, we will edit the SELECT
statement so the usr_email column is referenced.
The SQL found in the “Query” display of a Query Source is straight text. It can be edited in
the same was as any text can be edited. We simply click in the SELECT statement after the reference to the usr_initials column. Then, after hitting ENTER to create an extra line, we
type in the usr_email reference, as shown below:
Figure 2.25: Email Column Added to SQL SELECT Statement
We are careful to add a comma “,” at the end of the usr_email reference, to indicate the
column is one in a series of columns data may be retrieved from. To save the edited SQL,
select the OK button. Finally, we save all report definition changes to the database.
In our next step, we will add a new Field object to the Detail section of the report definition.
The Field object will handle the display of user email addresses retrieved from the database.
Report Writer User Guide 87
Getting Started
Retrieving Data
Field objects are used to display dynamic data retrieved from a database. Typically, they are
placed in the Detail section of a report definition. In this section, we will add a Field object to
handle our user email addresses.
To add a Field object to the report definition, we select the Field button
from the toolbar
and then click in the Detail section. We place the Field object to the far-right of the section,
lined up beneath the “Email Address” column heading, as shown in the following screen:
Figure 2.26: New Field Added to Report Definition
Now that we have placed the Field object, we must define its properties. Double-clicking on
the Field object opens the Field properties screen:
88 Report Writer User Guide
Retrieving Data
Figure 2.27: Properties for Email Address Field
As you can see in Figure 2.27, we have filled in the following information:
Query Source: We selected the “detail” query from the list of available Query Sources.
This is the query whose SELECT statement includes the newly-added reference to the
usr_email column.
Column: Here we enter the name of the usr_email column—since this is the column
whose data we need for the Field object. A column must be referenced in the SELECT
statement of the associated Query Source to successfully retrieve data from the database.
Report Writer User Guide 89
Getting Started
Preview: The preview shows us both the name assigned to the Field object
(“usr_email:detail”) and also the font choice. To make the font consistent with the other
Field objects in the report definition, we select the FONT button and specify 8-pt bold
Arial.
After we select the OK button, we see the Field object has been updated in the report definition, as shown below:
Figure 2.28: Field Object for Displaying User Email Addresses
We have now added the Field object to the report definition—and aligned it correctly beneath
the “Email Address” column headings. Once we save the report definition changes to the database, we will be ready to run the report and see the results.
To run the Users Master List report from OpenMFG, select the “Maintain Users” option from
the System Module menu. After selecting the PRINT button, the following report is generated:
90 Report Writer User Guide
Retrieving Data
Figure 2.29: Email Address Appearing on Printed Report
As you can see in Figure 2.29, the user email addresses have been successfully added to the
the report.
Total Fields
We have seen how Field objects may be used to retrieve text (i.e., user email addresses) from a
database. In this section, we will show how to create running totals using Field objects.
Our goal for this exercise is to provide a running total of all active users. There are currently
three active users in the database. We will add a fourth user and make that user inactive, as
shown in the following screen:
Report Writer User Guide 91
Getting Started
Figure 2.30: Master List of OpenMFG Users
If we are successful, the Field object should ignore the inactive user and include only the three
active users in the running total.
To begin, we will create a Report Footer section in the report definition. As you may recall,
Report Footers print only on the last page of a report—which is exactly what we want. We
want the running total to print at the end of the report.
Note
For more information on Report Footers, see the “Report Footers”
section in the Report Writer Basics chapter.
To create a Report Footer section, we select the “Section Editor” option from the “Document”
menu. The following screen will appear:
92 Report Writer User Guide
Retrieving Data
Figure 2.31: Add Report Footer Using Section Editor
As you can see in Figure 2.31, we have selected the “Report Footer” option. Selecting this
option causes a Report Footer to be added to the report definition, as shown in the following
screen:
Report Writer User Guide 93
Getting Started
Figure 2.32: Report Footer Section Added to Report Definition
Now that we have added the Report Footer section, our next step is to add a Field object to the
section. The Field object will display the running total of all active users.
To add a Field object to the report definition, we select the Field button
from the toolbar
and then click in the Report Footer section. We place the Field object in the section, as shown
in the following screen:
94 Report Writer User Guide
Retrieving Data
Figure 2.33: Field Object Added to Report Footer Section
Now that we have placed the Field object, we must define its properties. Double-clicking on
the Field object opens the Field properties screen:
Report Writer User Guide 95
Getting Started
Figure 2.34: Properties for Running Total Field
As you can see in Figure 2.34, we have filled in the following properties for the running total
Field object:
Query Source: We selected the “detail” query from the list of available Query Sources.
This is the query whose SELECT statement includes the reference to the usr_active
column.
96 Report Writer User Guide
Retrieving Data
Column: Here we enter the name of the usr_active column—since this is the column
whose data we need for the Field object. A column must be referenced in the SELECT
statement of the associated Query Source to successfully retrieve data from the database.
Display as Running Total: By selecting this option, we indicate we want the records on
active users to be displayed as a running total. When the running total is calculated, active
users will be assigned a value of “1,” while inactive users will be assigned a value of “0.”
Note
When running totals are calculated for columns designated as Boolean, the “true” values are assigned a value of “1,” while “false” values are assigned a value of “0.” In this example, active users would
be assigned a value of “1”, while inactive users would be assigned a
value of “0”.
Built-in Locale Format: We specify we want the running total to be displayed as a quantity.
Preview: The preview shows us both the name assigned to the Field object
(“usr_active:detail”) and also the font choice. To make the font consistent with the other
Field objects in the report definition, we select the FONT button and specify 8-pt bold
Arial.
After we select the OK button, we see the Field object has been updated in the report definition, as shown below:
Report Writer User Guide 97
Getting Started
Figure 2.35: Running Total Field Added
We have added the Field object which will retrieve data from the usr_active column and
display the information as a running total. Next, we need to insert a Label object to appropriately identify the Field.
To add the new Label, we select the Label button
from the toolbar and then click in the
Report Footer section. We place the Label object to the left of the “usr_active:detail” Field, as
shown in the following screen:
98 Report Writer User Guide
Retrieving Data
Figure 2.36: Label Object Added Next to Running Total Field
Now that we have placed the Label object, we must define its properties. Double-clicking on
the Label object opens the Label properties screen:
Report Writer User Guide 99
Getting Started
Figure 2.37: Running Total Label Properties
As you can see in Figure 2.37, we have entered “Total Active Users:” in the “Text” field. This
text identifies the running total, as shown in the following screen:
100 Report Writer User Guide
Retrieving Data
Figure 2.38: Label Object Identifying Running Total
We have now added the running total to the report definition—and labeled it appropriately.
Once we save the report definition changes to the database, we will be ready to run the report
and see the results.
To run the Users Master List report from OpenMFG, select the “Maintain Users” option from
the System Module menu. After selecting the PRINT button, the following report is generated:
Report Writer User Guide 101
Getting Started
Figure 2.39: Running Total Appearing on Printed Report
If we scrutinize Figure 2.39 closely, we see the appearance of the report would benefit if we
added a horizontal line separating the user names from the running total. In the next section,
we will add a separator line.
Adding Horizontal Lines
Lines make reports easier to view. In this section, we will add a horizontal Line to separate the
user names from the running total at the bottom of the report.
To add a Line, we select the Line button
Footer section.
from the toolbar and then click in the Report
Tip
If you hold down the SHIFT key when you are dragging a Line
object, this will keep the Line perfectly straight. Also, to reposition
a Line, simply click in its mid-point and drag the object to a new
location.
102 Report Writer User Guide
Adding Horizontal Lines
We place the Line just above the running total field—and then drag the Line using our mouse
from the left margin to the right margin. Finally, we double-click on the Line object to adjust
its properties. The following screen appears:
Figure 2.40: Setting Line Properties
In the “Width” field, we set the width of the Line to “2.” Line widths are measured in pixels.
After saving our changes to the database, we print the Users Master List report. The following
screenshot shows our result:
Figure 2.41: Line Added Above Running Total Field
We are almost done modifying the “UsersMasterList” report definition for this chapter. However, we still want to display a total of all users—as a complement to the running total of
active users. We will add this additional information in the next section.
Report Writer User Guide 103
Getting Started
Counter Fields
The last change we will make to the “UsersMasterList” report definition in this chapter is to
add a total count of all displayed users. This total will complement the running total of active
users, which we have already added, since the “UsersMasterList” report may display both
active and inactive users.
To provide this total information, we will add a COUNTER variable to the “detail” Query
Source. The COUNTER variable will increment by 1 for every row returned by a query. For
example, if a column contains 10 rows of data, the COUNTER will total “10” after the query
has been run.
To add the COUNTER, we open the “detail” Query Source by double-clicking on it from the
list of available Query Sources. Next, we add the COUNTER to the query’s SELECT statement, as shown in the following screen:
Figure 2.42: Counter Added to Query Source
As you can see in Figure 2.42, the COUNTER syntax is highlighted at the end of the SELECT
statement. The “1 AS COUNTER” syntax indicates two things: 1) For every row of data
retrieved from the database, that row will be assigned a value of “1,” and 2) the result set of
retrieved rows will be stored in memory in a temporary column we have called COUNTER.
104 Report Writer User Guide
Adding Horizontal Lines
Notice we have been careful to add a comma after the reference to the locale_code column. The comma separates the COUNTER from the other items in the SELECT statement
series. We do not insert a comma after the COUNTER line.
Now that we have inserted the COUNTER into the Query Source, we are ready to add a Field
object to display the results.
To add a Field object to the report definition, we select the Field button
from the toolbar
and then click in the Report Footer section. We place the Field object in the section, as shown
in the following screen:
Figure 2.43: Counter Field Added to Report Footer Section
Now that we have placed the Field object, we must define its properties. Double-clicking on
the Field object opens the Field properties screen:
Report Writer User Guide 105
Getting Started
Figure 2.44: Properties for Counter Field
As you can see in Figure 2.44, we have filled in the following properties for the COUNTER
Field object:
Query Source: We selected the “detail” query from the list of available Query Sources.
This is the query whose SELECT statement includes the reference to the temporary
COUNTER column.
106 Report Writer User Guide
Adding Horizontal Lines
Column: Here we enter the name of the temporary COUNTER column—since this is the
column whose data we need for the Field object. A column must be referenced in the
SELECT statement of the associated Query Source to successfully retrieve data from the
database.
Display as Running Total: By selecting this option, we indicate we want all the records
written to the COUNTER column to be displayed as a running total. When the running total
is calculated, each record (i.e., displayed user) will be assigned a value of “1.”
Built-in Locale Format: We specify we want the running total to be displayed as a quantity.
Preview: The preview shows us both the name assigned to the Field object
(“COUNTER:detail”) and also the font choice. To make the font consistent with the other
Field objects in the report definition, we select the FONT button and specify 8-pt bold
Arial.
After we select the OK button, we see the Field object has been updated in the report definition, as shown below:
Report Writer User Guide 107
Getting Started
Figure 2.45: Counter Field Added to Report Footer Section
We have added the Field object which will retrieve data from the COUNTER column and display the information as a running total. Next, we need to insert a Label object to appropriately
identify the Field.
To add the new Label, we select the Label button
from the toolbar and then click in the
Report Footer section. We place the Label object to the left of the “COUNTER:detail” Field,
as shown in the following screen:
108 Report Writer User Guide
Adding Horizontal Lines
Figure 2.46: Label Object Added Next to Counter Field
Now that we have placed the Label object, we must define its properties. Double-clicking on
the Label object opens the Label properties screen:
Report Writer User Guide 109
Getting Started
Figure 2.47: Counter Label Properties
As you can see in Figure 2.47, we have entered “Total Displayed Users:” in the “Text” field.
This text identifies the running total, as shown in the following screen:
110 Report Writer User Guide
Adding Horizontal Lines
Figure 2.48: Label Object Identifying Counter
We have now added a COUNTER to the report definition—and labeled it appropriately. Once
we save the report definition changes to the database, we will be ready to run the report and
see the results.
To run the Users Master List report from OpenMFG, select the “Maintain Users” option from
the System Module menu. After selecting the PRINT button, the following report is generated:
Report Writer User Guide 111
Getting Started
Figure 2.49: Counter Appearing on Printed Report
We have now reached the end of the exercises contained in the Getting Started chapter. Over
the course of this chapter we have taken a hands-on approach to learning fundamental report
writer functionality. You should now understand how the report writer retrieves information
from a database and displays that information in printed form. More advanced functionality
will be explored in subsequent chapters.
112 Report Writer User Guide
3
Advanced Topics
In this chapter we will cover a range of advanced topics. We touched on some of these topics
in earlier chapters. Others will be presented here for the first time. Subjects covered in this
chapter include the following:
•
•
•
•
•
•
MetaSQL
MetaSQL Editor
Report Renderer
Watermarks and Background Images
Barcodes
Graphs
MetaSQL
MetaSQL is a scripting language developed by OpenMFG for use by the report writer. The
language is designed to handle dynamic database queries. MetaSQL statements are embedded
within standard SQL—for example, within the Query Source of a report definition. When a
report is run, a parsing engine interprets the MetaSQL using a list of named parameters. The
parsed result is standard SQL, which in turn is sent to the target database. The following diagram illustrates this process:
Report Writer User Guide 113
Advanced Topics
Figure 3.1: MetaSQL Parser Handles Embedded MetaSQL
Dynamic queries are queries which contain conditional statements. Query results will vary
depending on how the conditions are satisfied. For example, a report may return one result if a
user makes one selection—or a different result if the user makes a different selection. The
report results are conditional upon choices made by the user. The MetaSQL scripting language
enables you to allow for and incorporate this conditionality into your report definitions.
MetaSQL in Practice
To illustrate how dynamic, conditional queries are handled using MetaSQL, let’s examine a
sample report definition called “UsersMasterList”. This is the same report definition we have
worked with in previous chapters.
114 Report Writer User Guide
MetaSQL in Practice
The “UsersMasterList” report definition is called whenever someone using the OpenMFG
application wants to print a copy of the users master list. That OpenMFG master list appears in
the following screenshot:
Figure 3.2: Master List of OpenMFG Users
When someone selects the PRINT button, the information displayed on the screen is printed
out using the “UsersMasterList” report definition.
If you look closely at Figure 3.2, you can see the option “Show Inactive Users” is selected. As
a result, the users master list is displaying both active and inactive users. The “Show Inactive
Users” option is an example of a dynamic condition. If the option is selected, one list of users
will be displayed. If it’s not selected, another list of users will be displayed. Logically, the
report definition must accommodate either of these two conditions.
The report definition uses MetaSQL to handle these conditions. Let’s look at the Query Source
for the “UsersMasterList” report definition to understand how MetaSQL is embedded within a
report definition:
Report Writer User Guide 115
Advanced Topics
Figure 3.3: Query Source for UsersMasterList Report Definition
To locate embedded MetaSQL in a Query Source, simply look for the <? and ?> tags. These
are the tags used to identify MetaSQL statements. As you can see in Figure 3.3, the WHERE
clause contains several MetaSQL tags. Let’s examine the WHERE clause to gain a better understanding for how MetaSQL works:
WHERE clause:
WHERE ((usr_locale_id=locale_id)
<? if not exists("showInactive") ?>
AND (usr_active=true)
<? endif ?>
)
MetaSQL:
MetaSQL is always contained inside <? and ?> tags. Our sample WHERE clause
contains the following two lines of MetaSQL:
1) <? if not exists("showInactive") ?>
2) <? endif ?>
MetaSQL Statements:
116 Report Writer User Guide
MetaSQL in Practice
if not – This statement begins a MetaSQL condition.
endif – This statement ends the condition.
MetaSQL Function:
exists – This MetaSQL function takes the name of the parameter provided. In
this case, the provided parameter is named showInactive.
Parameter:
showInactive – The conditionality of the report centers on this parameter. It is
this parameter which determines whether inactive users should be included in the
report. Like all valid parameters referenced in a MetaSQL statement, the parameter showInactive originates from within the source code of the application
utilizing the report writer. In this case, that application is OpenMFG—and the
parameter is included in the source code for the Users Master List screen. When
an OpenMFG user sends a print request from the Users Master List screen, the
MetaSQL parser interprets the existing conditions—namely, is the showInactive parameter being used, or not? The parser then uses this information to produce standard SQL meeting the specified conditions. This standard SQL, which
has been stripped of its MetaSQL elements by the parser, is then delivered to the
target database for processing.
Tip
The OpenMFG application automatically generates a parameter list
whenever a user submits a print request. The parameter list will
contain as many (or as few) parameters as pertain to the screen the
print request was sent from. When a MetaSQL statement in an
OpenMFG report definition refers to a parameter, that parameter
should be one which would appear on the generated parameter list.
Resulting SQL:
If a user selects the “Show Inactive Users” option, the MetaSQL parser will send
the following standard SQL to the target database:
SELECT usr_username,
usr_propername,
Report Writer User Guide 117
Advanced Topics
usr_initials,
formatBoolYN(usr_active) AS f_active,
formatBoolYN(usr_agent) AS f_pa,
locale_code
FROM usr, locale
WHERE ((usr_locale_id=locale_id)
AND (usr_active=true))
ORDER BY usr_username;
If the user does not select the “Show Inactive Users” option, the MetaSQL parser
will send the following standard SQL to the target database:
SELECT usr_username,
usr_propername,
usr_initials,
formatBoolYN(usr_active) AS f_active,
formatBoolYN(usr_agent) AS f_pa,
locale_code
FROM usr, locale
WHERE ((usr_locale_id=locale_id))
ORDER BY usr_username;
Note
You may have noticed the AND is excluded in the second example.
This occurs because in the second example the value of the parameter showInactive is false.
As the “UsersMasterList” example demonstrates, static report definitions can be made to handle dynamic conditions using MetaSQL. In the following sections, we will examine the range
of MetaSQL building blocks.
118 Report Writer User Guide
MetaSQL Syntax
MetaSQL Syntax
MetaSQL syntax is comprised of control statements and functions. Control statements contain
standard SQL which will be used if certain conditions are met. Functions are generally used to
evaluate parameters. Collectively, control statements and functions are referred to as “statements.” When these statements are embedded within standard SQL, they create MetaSQL.
As we have mentioned previously, MetaSQL statements are bracketed between an opening
angle bracket and question mark pair (“<?”) and a closing question mark and angle bracket
pair (“?>”). All content within (and including) the opening and closing character pairs is
referred to as a “tag.” Each tag is comprised of a single statement and also any additional arguments, parameters, or modifiers which apply to the statement. The first word following the tag
opening (i.e., “<?”) is the statement. Any additional text after the statement up to the closing
angle bracket (“?>”) is broken into tokens and processed accordingly.
Tip
You don’t need to worry about inserting excess blank spaces when
writing MetaSQL statements. The MetaSQL parser ignores excess
blank spaces.
Next we will look at the range of available control statements and functions, offering descriptions for how each may be used.
Control Statements
Control statements form blocks which contain standard SQL and MetaSQL tags. While control statements are not directly responsible for producing output, they do determine whether
their contents should be outputted or not. The complete list of available MetaSQL control
statements is described below:
• if – Use the if statement to begin a conditional control block. One or more tokens
(i.e., single elements) should follow this opening statement. Individual tokens may
be separated from each other using the “and” and “or” tokens. Explicit token
groups should be enclosed within parentheses “( )”. You can reverse the boolean
result of a token group by placing a “not” token directly proceeding the token
Report Writer User Guide 119
Advanced Topics
•
•
•
•
•
group. If the aggregate sum of all the token groups in a control block is a true value,
then the contents of the if block will be executed. If the condition is false, then the
next following elseif or else condition will be evaluated, assuming one exists.
elseif – Place an elseif statement within an if block to divide the if block
into multiple blocks. An elseif statement behaves in the same manner as an if
statement. Any number of elseif conditions may be included within an if
block.
else – An else condition, if present, is executed when both the if condition
and any elseif conditions are false. At most, there may be one else condition
included within an if block.
endif – Use this statement to end an if block.
foreach – This statement operates on the parameter which immediately follows
it. If the parameter represents a list of values, the foreach block will be executed
once for each value in the list. If the parameter represents a single value, then the
block will be executed once. If no values exists, the block will not be executed.
endforeach – Use this statement to end a foreach block.
Functions
Functions are independent statements which perform specific operations. If a function returns
a value, the value will be outputted. The complete list of available MetaSQL functions is
described below:
• value – This function operates on the parameter which immediately follows it and
returns the value of that parameter. If the parameter is called within a foreach
block and the parameter represents a list, the function will return the current item of
that list. If the parameter is called outside of a foreach block and the parameter
represents a list, the value will default to the first entry. If the parameter named does
not exist, then a blank or null value will be returned.
• exists – This function operates on the parameter which immediately follows it
and returns true if that parameter exists. If the parameter does not exist, then the
function returns false. If the parameter is null or blank, the function will still return
true because the parameter exists.
• reExists – This function takes a regular expression and returns true if one or
more parameter exists which match the regular expression. The regular expression
is case-sensitive.
120 Report Writer User Guide
MetaSQL Syntax
• isFirst – This function operates on the parameter which immediately follows it.
If the parameter is called inside a foreach block and the parameter represents a
list, the function will return true if the item returned by the call would be the first
item in the list. If the parameter is called outside a foreach block—or if the
parameter specified does not represent a list but does exist—then the function will
return true. In all other situations, the function will return false.
• isLast – This function operates on the parameter which immediately follows it. If
the parameter is called inside a foreach block and the parameter represents a list,
the function will return true if the item returned by the call would be the last item in
the list. If the parameter is called outside a foreach block and the parameter represents a list, the function will return true only if the list contains one item. In all
cases, the function will return true if the parameter does not represent a list, but
instead represents a single parameter. If the parameter does not exist—or in any
other case—this function will return false.
• continue – This function will cause the innermost loop to execute to the end and
continue as normal. If this statement is used outside of a loop, the function has no
effect. If a number is specified, the specified number determines how many loops
will be continued. If the number of specified loops is greater than the number of
nested loops, then the function will continue the outermost loop.
• break – This function will cause the current loop to execute to the end and stop. If
the function is used outside of a loop, the function will have no effect. If the number
of loops is specified, that determines how many loops will be terminated. If the
number of loops to break is greater than the number of nested loops, then all loops
will broken.
MetaSQL Editor
As we have seen, MetaSQL is a non-standard language embedded within standard SQL.
MetaSQL cannot be executed directly on a database, but must first pass through and be interpreted by the MetaSQL parser. The MetaSQL parser then generates standard SQL which is
sent to the target database for processing.
The MetaSQL Editor is a tool designed to facilitate the process of writing report definitions
having MetaSQL elements. Using the MetaSQL Editor, report authors can develop complex
queries, test them with different values for parameters, and then view the resulting standard
Report Writer User Guide 121
Advanced Topics
SQL. Report authors can save time and effort using the MetaSQL Editor to test any portion of
a complex query having MetaSQL elements.
Note
The MetaSQL Editor is a multi-platform tool, running identically
on Windows, Linux, and Mac. For testing report definitions linked
to the OpenMFG application, the MetaSQL binary file should be
installed in the same directory as the OpenMFG client.
The example we will be using in this section focuses on running the MetaSQL Editor against
an OpenMFG database. However, the MetaSQL Editor source code can be modified to work
with other database applications.
Connecting to a Database
The MetaSQL Editor can be an extremely useful tool for report authors who want to test the
accuracy of their MetaSQL statements during the process of writing report definitions. To
open the MetaSQL Editor, run it from the location where it is installed. The following screen
will appear:
122 Report Writer User Guide
MetaSQL Syntax
Figure 3.4: MetaSQL Editor
To perform tests using the MetaSQL Editor, you must first connect to your target database. To
connect to a database, select the “Database” option from the “File” submenu, as shown in the
following screen:
Report Writer User Guide 123
Advanced Topics
Figure 3.5: Connecting to a Database
For the purposes of this example, we will be connecting to an OpenMFG database. That
explains why, when we select the “Connect” option, we are brought to a database login screen
which has been customized for the OpenMFG application:
124 Report Writer User Guide
MetaSQL Syntax
Figure 3.6: MetaSQL Editor - Connecting to the Database
Under the OPTIONS button, we specify our server, database, and port connection information.
And then, as shown in Figure 3.6, we are asked to enter a valid username and password.
Once we have successfully connected to our target database, we can begin testing the accuracy
of embedded MetaSQL statements using the MetaSQL Editor.
Entering a Query
For this exercise, we will demonstrate the MetaSQL Editor functionality using a very basic
and simple query. The goal of the exercise is to leave you with an understanding of fundamental MetaSQL Editor mechanics. You are free to perform more complex and extensive testing
on your own.
Report Writer User Guide 125
Advanced Topics
Now that we are connected to a database—in this case, an OpenMFG database—we can write
a simple query and then test the results. To enter a query, simply type in the MetaSQL Editor’s
main text field, as shown in the following screen:
Figure 3.7: Simple SQL Query with Embedded MetaSQL
Note
Test queries may be saved for future use by selecting either the
SAVE or SAVE AS options from the “File” menu.
As you can see in Figure 3.7, the query begins with standard SQL. We are seeking to SELECT
four pieces of Item information FROM the item table. Our MetaSQL is inserted within the
WHERE clause. The MetaSQL states that the item_number for the selected Item must
match a specified item_code. The term item_code is a parameter. We can set different
values for the item_code parameter using the MetaSQL Editor—and then run the query to
test the results.
However, before we run the query, we must first define the parameter item_code and assign
it a value.
126 Report Writer User Guide
MetaSQL Syntax
Defining Parameters and Values
Earlier in this chapter we discussed parameters and how they enable reports to respond to
dynamic conditions presented by application users. The MetaSQL Editor enables you to simulate these dynamic conditions, by defining parameters and assigning values to them.
Let’s assign a value to the parameter we entered in our MetaSQL example—namely, the
parameter item_code. In our example, we are simulating a situation in which an OpenMFG
user inputs an item_code. The item_code, in turn, corresponds to an item_number in
the item table.
Before we can test our MetaSQL, we must first create the parameter item_code. To create a
parameter, we open the “Parameter List” option from the “View” menu. The following screen
will appear:
Figure 3.8: Parameter List
Note
Parameters will be saved only for the duration of the current
MetaSQL Editor session. Once the MetaSQL Editor is closed, any
saved parameters will be erased.
The parameter list screen displays information on all parameters which have been created for
testing purposes, including Active status, parameter name, data type, and value.
To create a new parameter, select the NEW button. The following screen will appear:
Report Writer User Guide 127
Advanced Topics
Figure 3.9: Enter New Parameter
When entering a new parameter, you are presented with the following options:
Name: Enter a name to identify the parameter.
• The names of parameters should correspond to parameter names referenced in your
test queries.
Type: Select the appropriate data type from the list of available data types.
• Data types are defined on the database—and may vary from column to column. To
be successful, your selection must match the data type for the target column in the
database. In our example, the target column is item_number. The data type for
this column is text. In the MetaSQL Editor, the text data type corresponds to
the String type.
To the far right of the screen, the following buttons are available:
OK: Select to save the entered values.
CANCEL: Select to cancel the transaction and return to the parameter list.
After we have entered the appropriate values and selected the OK button, the following screen
appears:
128 Report Writer User Guide
MetaSQL Syntax
Figure 3.10: Specify Value for Parameter
As you can see in Figure 3.10, we are asked to enter a value for the parameter. In this case, we
enter YTRUCK1. This is an item_number from our sample database. By entering that value
here, we are linking the parameter item_code to item_number YTRUCK1. Selecting the
OK button saves our information.
Back on the parameter list, we can verify the information has been entered correctly, as shown
in the following screen:
Figure 3.11: Parameter List Containing Sample Parameter
Now that we have our sample query and corresponding parameter, we are ready to begin our
testing.
Report Writer User Guide 129
Advanced Topics
Parsing and Executing a Query
Before we execute our query, we must first parse it using the MetaSQL parser. As we have discussed previously, the MetaSQL parser interprets MetaSQL statements embedded in a query,
evaluates the available parameters, and then produces standard SQL. The resulting standard
SQL is then sent to the database for processing.
To parse select the “Parse Query” option from the “Tools” menu. The following screen will
appear:
Figure 3.12: Parsed Query in MetaSQL Editor
Notice that in Figure 3.12, the MetaSQL parser creates a Log Output screen, where messages
related to the parsing process will be written. In our case, we get a “Query parsed” message,
which means our MetaSQL was parsed successfully.
Once a query has been parsed, we are ready to execute it. Executing a query means the standard SQL produced by the MetaSQL parser is sent to the database for processing. To execute a
130 Report Writer User Guide
MetaSQL Syntax
query, select the “Execute Query” option from the “Tools” menu. The following screen will
appear:
Figure 3.13: Results of Executed Query
When a query is executed successfully, the results will be displayed in a Results Output
screen, as shown in Figure 3.13. As you can see in the example, the value returned in the
item_number column equals the value assigned to the parameter item_code.
Resulting Standard SQL
One of the most powerful features of the MetaSQL Editor is the ability to view the standard
SQL generated by the MetaSQL parser. This is the same standard SQL the parser sends to the
database for processing. This visibility is especially helpful when attempting to troubleshoot
lengthy queries having complex MetaSQL statements and numerous parameters. To view the
standard SQL output, select the “Executed SQL” option from the “View” menu. The following
screen will appear:
Report Writer User Guide 131
Advanced Topics
Figure 3.14: Standard SQL Output from MetaSQL Parser
As you can see in Figure 3.14, the MetaSQL parser has stripped the MetaSQL elements from
the original query to produce standard SQL which can be processed by the database.
Tip
If you save your MetaSQL queries to a local file, you can load them
into the MetaSQL Editor at a later time. Parameter lists may not be
saved, however.
This concludes the section on using the MetaSQL Editor. Again, we used a very simple query
to illustrate the basic mechanics of the MetaSQL Editor. We encourage you to test more complex queries and parameter lists on your own.
132 Report Writer User Guide
Connecting to a Database
Report Renderer
The report renderer generates printed reports from report definitions. Like the report writer,
the report renderer is a multiplatform tool which is available as either a standalone application
or an embedded version bundled with OpenMFG. The report renderer is designed to connect to
PostgreSQL databases; however, the application’s source code could be modified to enable
connections to other databases, as well.
Tip
The standalone report renderer can be used by OpenMFG users to
generate custom reports—that is, reports which are not available
using the OpenMFG menu structure. This flexibility enables users
to extend the reporting capabilities of OpenMFG.
In this section, we will focus on the standalone report renderer. The standalone version gives
users the ability to connect to multiple databases—and generate custom reports from those
databases.
Connecting to a Database
To open the report renderer, locate the renderer application file on your system. It should be
installed in a directory along with its required support libraries. These support libraries will
vary depending on your operating system. Once you have opened the file, you will be presented with the initial log in screen, as shown in the following screenshot:
Report Writer User Guide 133
Advanced Topics
Figure 3.15: Report Renderer Log In Screen
As you can see in Figure 3.15, the server and database information has yet to be specified. To
specify connection details, select the OPTIONS button. The following screen will appear:
Figure 3.16: Specifying Database Connection Details
Note
The report renderer is designed to connect to PostgreSQL databases. However, the application’s source code could be modified to
enable connections to other databases, as well.
When specifying database connection details, you are presented with the following options:
134 Report Writer User Guide
Connecting to a Database
Server: Enter the host name for the server you want to connect to.
Database: Enter the name of the target database.
Port: Enter the port number for the target database.
Once you have entered connection details, the server and database information will display on
the initial log in screen, as shown in Figure 3.17:
Figure 3.17: Connection Details on Log In Screen
Finally, we enter username and password information, then select the LOGIN button. Once
authentication is complete, the report renderer’s main application screen will appear, as shown
below:
Report Writer User Guide 135
Advanced Topics
Figure 3.18: Report Renderer Main Application Screen
As you can see in Figure 3.18, no report definition has been loaded yet. Once a report definition is loaded—and parameters defined, if necessary—we can run the report and print the
results.
In the next section, we will look at a sample report definition—and later we will load this sample into the report renderer.
Ad Hoc Reports
As we have said, the report renderer can be used to generate miscellaneous reports using data
stored within PostgreSQL databases. The report renderer’s miscellaneous or “ad hoc” reporting capability also extends to OpenMFG databases, which run on PostgreSQL. For OpenMFG
users, this means you can use the report renderer to generate your own reports—thereby
extending your reporting capability beyond the range of standard reports included with the
OpenMFG application.
136 Report Writer User Guide
Ad Hoc Reports
Tip
The report renderer enables OpenMFG users to extend their reporting capabilities. Use the report renderer to generate ad hoc, or custom OpenMFG reports.
Before we can demonstrate report renderer functionality, we must first identify a report definition to work with. For this exercise, we created a simple report definition designed to retrieve
basic Item information from an OpenMFG database. As the following screenshot shows, we
created the report “AdHocItemReport” using the standalone OpenRPT application:
Figure 3.19: Report Definition for Ad Hoc Report
Report Writer User Guide 137
Advanced Topics
Note
OpenMFG users can create report definitions using either the
embedded report writer or the standalone OpenRPT application.
The report renderer then uses these report definitions to generate
printed reports.
As you can tell by looking at Figure 3.19, this simple “AdHocItemReport” will list Items and
report on whether they are sold or active. The “AdHocItemReport” report is not one of the
standard OpenMFG reports available in the application’s menu structure. However, we can
retrieve this data and generate an ad hoc report when we combine this report definition with
the standalone report renderer.
The next screenshot shows the Query Source the report definition will use to retrieve the data
from our database:
Figure 3.20: Ad Hoc Report Definition Query Source
As you can see in the Query Source, the SELECT statement retrieves basic Item information
from the item table. Then, MetaSQL is used in the WHERE clause to introduce two parameters: sold_param and active_param. The parameters refer to
the report must interpret to
138 Report Writer User Guide
Loading Report Definitions
to accomodate two dynamic parameters. These parameters will enable the
namely, whether application users have marked the Item as sold and/or active.
Note that the report displays whether or not an Item is sold and whether it is active. In the next
section we see the Query Source and corresponding SQL query that retrieves the data from the
database. As part of the SQL we will assign parameters that, when we generate the report with
the Renderer, filter data based on user provided values for these two parameters.
Later, using OpenRPT, we will pass runtime parameter values to the report definition when we
generate its output and in this way control the nature of the data displayed on the resulting
report.
Tip
To accelerate the creation of any report definition, use the
MetaSQL Editor to verify the accuracy of your SQL queries. Once
queries have been validated, you can then copy and paste them into
your report definition’s Query Source.
Loading Report Definitions
In this section we will look at a simple ad hoc report definition against the OpenMFG item
table. Keep in mind that you are not restricted to OpenMFG databases and tables when using
Report Writer User Guide 139
Advanced Topics
OpenRPT in conjunction with the OpenRPT Renderer. After reviewing a few key aspects of
the report definition we will look at how to generate the report’s output with the OpenRPT
Renderer.
This first step when using the OpenRPT Renderer is opening a report definition. Remember,
these definitions are created using OpenRPT and are saved in XML format.
Tip
XML report definitions may be saved to a network drive. In this
way many users can have access to a collection of Ad Hoc reports.
To open an XML report definition file:
• Pull down the OpenRPT Renderer File menu
• Select the option Open
• In the Operating System’s open file dialogue, locate the report definition’s XML
file and select it.
140 Report Writer User Guide
Loading Report Definitions
Figure 3.21:
Report Writer User Guide 141
Advanced Topics
Figure 3.22:
The top half of the OpenRPT Renderer contains a section called Report information. In it you
will see the following information read from the report definition’s XML file:
• Name
• Title
• Description
Developers of report definitions should utilize the Description section of a report definition to
communicate information about what the report does to those who will use it.
Adding OpenRPT Renderer Runtime Parameters
You may recall that when we created our report definition’s SQL, we embedded in it (within
the MetaSQL tags ‘<?’ and ‘?>’ parameters that will accept user defined values at run time.
142 Report Writer User Guide
Adding OpenRPT Renderer Runtime Parameters
After we open an OpenRPT report definition, we must define these parameters and set their
values before generating the report. The report definition we defined contains two parameters:
• sold_param
• active_param
Let’s look at how a parameter is defined and a value assigned.
Define Parameter
After opening the report definition click the ADD button. You will see the New Variant screen:
You must enter the exact Name of the parameter, as defined in the report definition, and assign
it a Type. Above we see the “sold_param” defined as a Type “Bool” (Boolean) which means it
has a True/False value in the database.
After clicking the OK button, you will be prompted to enter a value for the parameter and
check whether or not it is Active.
Set Parameter Value
Below we see the screen that enables us to set a value for the parameter we just define. This
screen displays after we click the OK button on the New Variant screen.
Report Writer User Guide 143
Advanced Topics
Note that because the parameter was defined as type Bool, we are presented only with the
options True of False for the parameter’s value.
It is important to set the parameter as Active if you want its value passed to the report definition at report run time.
Clicking the OK button returns you to the main screen for the OpenRPT Renderer and displays
information about the parameter(s) in the Parameters section of the screen
Figure 3.23: OpenRPT Renderer After Two Parameters Have Been Defined Along With Values
That Are Passed To The Report’s SQL To Control Data Selected By The Query And Displayed In
The Report.
144 Report Writer User Guide
Deleting a Parameter
Changing Parameter Values
Parameters values may changed by clicking the EDIT button found on the main OpenRPT
Rendered screen. The user first selects a parameter to edit by clicking on it and then clicks the
EDIT button. The OpenRPT Renderer displays the screen that enables the user to change the
parameter’s value or uncheck the Active option to deactivate the parameter.
Deleting a Parameter
Parameters may be deleted with the DELETE button found on the main OpenRPT Renderer
screen. The user first selects a parameter to delete by clicking on it and then clicks the
DELETE button. The OpenRPT Renderer removes the parameter from the list of parameters
displayed.
Note:
Currently parameters are not saved. When the Renderer is closed,
all parameter settings are lost and must be re-entered the next time
the report definition is opened with the OpenRPT Renderer.
Generating the Ad Hoc Report
Now that you have:
• Connected to the database
• Opened report definition’s XML file
• Defined parameters and set their values
It is possible to render the report’s output. Simply:
• Pull down the File menu on the main OpenRPT Renderer screen
• Select the Print option
• Choose a printer and start the print job
Below we see our Ad Hoc Item Report:
Report Writer User Guide 145
Advanced Topics
Figure 3.24: Ad Hoc Report Generated Through The OpenRPT Renderer.
Above we see that the user, prior to running this report, set parameters that show only Items
that are sold (sold_param = true) and that have been set to inactive status (active_param =
false). The user could return to the OpenRPT Renderer and change one or both of the parameter’s values to generate a different report.
Tip
Utilities exist on the three support client platforms that enable the
generation of printed output to a PDF formatted file (as seen above)
for viewing on-screen.
Watermarks and Background Images
The OpenMFG report writer supports two advanced features that enable you to make your
reports visually appealing and add a level of security that makes it easier to determine if a
printed report is the original or a duplicate. These two features are watermarks and background
images.
A watermark is text that is printed across the background of a report and is usually defined
with an opacity factor that cause the printing to be lighter than the report’s foreground content.
146 Report Writer User Guide
Deleting a Parameter
A background image is similar to a watermark in that it is displayed in the background of the
report’s output and its opacity can be controlled. However, as its name implies, a background
image is graphical, not textual, in nature.
The use of watermarks and background images is not mutually exclusive; a report may employ
both. Also, both may be static or dynamic in nature. That is to say, a watermark may have a
fixed value, or its value may be derived from a Query Source that retrieves it from the database. A static background image references a single image for the report. A dynamic background image can use a query against the images table to retrieve a different image (perhaps a
customer’s logo) based on parameter values passed to the report at run-time.
Below is a report that employes both an static background image and a static watermark:
Figure 3.25: Portion of a Sample Report Showing Static Background Image and Static Watermark
Report Writer User Guide 147
Advanced Topics
Both watermarks and background images are defined in the Report Properties session. To open
this session first open the report writer and then the report to which you want to add or change
the watermark or background image. Next:
• Pull down the Document menu
• Click on the “Properties” option
Figure 3.26: Report Properties Info Tab
The Info tab enables you to provide a descriptive title for your report and a detailed description
that may, in the future, help others understand how your report works or should be used.
Background Images
Background images are defined on the Report Properties session under the Background tab:
148 Report Writer User Guide
Background Images
Figure 3.27: General Tab for Background Images
To enable Background images, the Enable Background image box must be checked.
There are two types of Background image: static and dynamic. Our example depicts a static
background image; one where the image shown never changes.
A Dynamic background image can be displayed from the OpenMFG images table based on the
results of a the SQL in a Query Source. The column field would then reference the image_data
column which contains the image data. Company logos, product images, and employee photos, just to name a few, can be stored in the images table and pulled dynamically into a report
through the SQL in a Query Source.
Within the Background tab there are three sub-tabs: General, Layout, and Static Image.
Report Writer User Guide 149
Advanced Topics
General
The General tab controls the Source of the image: Static or Dynamic. The Query Source and
Column, if it is a dynamic background image, references the SQL Query Source and the column retrieved by it that contains the image data. The Opacity slider controls the level of transparency that the background image will posses when displayed.
Layout
The Layout tab for background images controls whether the image is shown at its original size
(the Clip option) or it is stretched (the Stretch option) based on the values of the fields Width
and Height.
Figure 3.28: Layout Tab for Background Images
Other settings on this tab control the position of the background image in the report
150 Report Writer User Guide
Background Images
Static Image
The Static Image tab for background images only applies to static background images.
Figure 3.29: The Static Image Tab Shows The Static
Image You Have Loaded For Display in the Background
of Your Report
When you click on the LOAD button, you are presented with your operating system’s locate
file dialogue. Selecting the image locally and clicking OK returns you to the Static Image tab
and a view of the image.
Report Writer User Guide 151
Advanced Topics
Note:
Static background images are embedded in XML that is stored in
the column report_source in the table report. As such, when you
save a report definition locally in XML format, the static image is
embedded in it and transported with it.
Watermarks
Watermarks are defined on the Report Properties session under the Watermarks tab. Let’s take
a look at the screen that enable us to control watermarks:
Figure 3.30: Watermark Tab on Report Properties
Like background images, watermarks can also be static or dynamic.
152 Report Writer User Guide
Watermarks
The value of a dynamic watermark may be provided through the results of an SQL query referenced in the fields Query Source and Columns. Likewise, the value of a parameter value
passed to the report at run-time can also be displayed by selecting Parameter Query in the
Query Source field and entering the name of the parameter in the Column field.
The characteristics of the watermark, its size, font, and opacity, are controlled by the other
fields on the Watermark tab.
Bar Coding
The two major benefits to Bar coding are accuracy and speed during data collection. The
report writer makes it easy to add Bar coded information to report definitions. In this section
we look at a simple but powerful example.
The photo below is of a wedge type Bar code scanner. This type of scanner is attached to a PC
running the OpenMFG Client. When a Bar code is scanned, the information read by the scanner is entered on the screen wherever the cursor is currently located. Put another way, a wedge
scanner is a substitute for the user’s manual data entry. Today these scanners are durable, inexpensive, and easy to connect.
Figure 3.31: Low Cost Bar Code Scanner
Frequently Bar code scanners are used to collect information on the shop floor. Below is the
OpenMFG Post Production screen:
Report Writer User Guide 153
Advanced Topics
Figure 3.32: The Post Production Screen Requires the
Entry of a Work Order Number and Quantity
Completed Information That Could Be Entered Via a
Bar Code Scan
Users posting production are required to enter two pieces of information: the Work Order
Number and the Quantity to Post. This information is available on the Work Order’s Router.
But the standard Router (see below) contains this information only in human readable form.
154 Report Writer User Guide
Watermarks
Figure 3.33: Output of the Standard OpenMFG Work Order Routing With Human Readable
Information.
The information that we need for Posting Production is on the Routing, but in human readable
form. Let’s look at how easy it is to add two addition fields that display this information in Bar
code Format.
Below we see the report definition called Routing:
Report Writer User Guide 155
Advanced Topics
Figure 3.34: Standard Work Order Routing Report Definition Before the Addition of Bar Coded
Work Order Number and Quantity Ordered.
To added the human readable fields we are interested in at referred to on the screen as “wonumber:Head field” and “qtyord:Head field”. We will leave these fields as they are, but, we will
need to move the “wonumber:Head field” and its corresponding label up a little to make room
for the Bar code field which we will place underneath it.
Once we have room on the report definition for the Bar code we can use the Bar code tool
to place Bar code in the report definition. Below we see the Bar code Properties screen:
156 Report Writer User Guide
Watermarks
Figure 3.35: Bar Code Properties Definition
For the Work Order Number Field
There are four critical settings on this screen:
• Format - You should check which formats your scanner supports. Most modern
scanners enable autoselection which means that the scanner can read more than one
format and determine the format when the Bar code is scanned. OpenMFG provides
the following standard Bar code formats:
• 3 of 9
• 3 of 9+
• 128
• ean13
• ean8
• upc-a
• upc-e
• Query Source - we can look at this settings for the human readable “wonumber:Head field” and “qtyord: Head field” fields and use that same query for our Bar
coded fields
Report Writer User Guide 157
Advanced Topics
• Column - we can look at this settings for the human readable “wonumber:Head
field” and “qtyord: Head field” fields and use that same column for our Bar coded
fields
• Maximum Length of Value - Here we set the number characters wide the work
order number and quantity ordered could be. Ten and six respectively will work for
these two Bar codes.
After the addition of our Bar code fields the new report definition will look something like
this:
Figure 3.36: Routing Report Definition After the Addition of Bar Coded Work Order Number and
Quantity Ordered Fields
Remember when you Save to DB to use a grade other than 0 for your new routing report definition. To view the new routing, go to the W/O - W/O Control menu and select Print Routing.
Enter a the Work Order Number for a currently released work Order and click the PRINT button. The new routing looks like this:
158 Report Writer User Guide
Watermarks
Figure 3.37: New Routing After The Addition of Bar Coded Fields to Enhance the Accuracy and
Speed of Collection.
Now, a user recording production on the Post Production screen need only scan the Work
Order Number and the Quantity to Post from the new Routing, and click the POST button.
Report Writer User Guide 159
Advanced Topics
Figure 3.38: After the Addition of Bar Codes to
the Router, The User Records Production by
Scanning the Work Order Number Quantity
Bar Codes and Clicking the POST
PRODUCTION Button.
As you become more and more familiar with OpenMFG and the data collection screens in it
that you use to run your business, pay close attention to the OpenMFG documentation that
users rely on to provide that data. You will likely find many other opportunities to add Bar
coded fields to report definitions and by doing so, improve the speed and accuracy of the information that is collected.
Graphing
The report writer provides the capability to display information graphically. In this section we
will examine this functionality by looking at how an existing report definition defined in the
OpenMFG ERP application suite that displays inventory history can be enhanced to show the
information in both numerical and graphical form.
160 Report Writer User Guide
Graphical Report Output
Graphical Report Output
The basis for our discussion is an existing report that is generated by OpenMFG in the Inventory Management module. The display is called Time-Phased Item Usage Statistics by Item
and the report is generated by clicking the PRINT button.
Figure 3.39: The Time-Phased Item Usage Statistics by Item Report is an Excellent Candidate for
Enhancement with a Graph.
Data for the report can be viewed prior to initiating the report. Above we see 8 weeks of historical information for a specified Item in a specific warehouse. The standard report definition
displays this same information in a vertical format on a printed page. But, with the report
writer’s graphing capability, we can display the same information visually as well.
Report Writer User Guide 161
Advanced Topics
Figure 3.40: Data That Appears in the Body of the Report (Partially Seen at the Bottom) Is
Displayed in Graphical Form in the Header.
To do this, the standard report definition was enhanced so that the Header area at the top was
large enough to accommodate the new graph. Then, the same columns in the query definition
that were used in the body of the report to display the period were used to plot the Y axis.
Likewise, the columns in the query definition that were used to display the quantity information (Received, Issued, etc.) were used to define the X axis. Let’s take a look under the hood
and see how this was done.
Graphical Report Definition
The nature of a report definition that displays information graphically is fundamentally the
same as one that displays information textually. Indeed, a report definition that displays
numerical information is often a good candidate for graphical enhancement.
162 Report Writer User Guide
Graphical Report Definition
Below we see the report definition for the Time Phased usage Statistics By Item after the section Report Header has been enlarged and a Graph object has been added to it:
Figure 3.41: The Report Definition’s Report Header Section Has Been Enhanced With a Graph
Defined in the Object Called “detail graph”.
A Graph object is added using the
graphing tool on the toolbar. Start by clicking on the
graphing tool. Then, click on the area in the section of the report definition where you want
the graph to display. Next, resize the resulting Graph object box with your mouse. Finally,
doubleclick on the Graph object to define detailed information about its behavior.
We will cover Graphing object definition shortly. First, let’s take a look at the SELECT clause
in the report’s Query Definition to see the origin of the column values that will be used to
define values and information for the X and Y axes.
Query Source
The SELECT clause in the SQL statement that is used in the report’s Query Definition is
shown below. It is important to note two factors in relation to this Query Source:
• The existing report definition’s Query Source was not modified in any way to
accommodate the graph.
Report Writer User Guide 163
Advanced Topics
• The SQL utilizes embedded PL/pgSQL (the PostgreSQL Procedural Language)
functions summTransR(), summTransI(), summTransS(), summTransC() and summTransA() to actually query the table invhist.
Figure 3.42: The Select Clause in the Report’s SQL Statement Contained in the Query Definition
“detail” Contains The Columns That Will Referenced in the Graph.
Ultimately the query returns values for columns: received, issued, sold, scrap, adjustments,
and period. These will be used in the graph’s definition to supply the dynamic data upon which
the resulting graph will render the information visually.
Color Definitions
Colors must be defined for each report writer report definition. We will assign our color definitions to the bars, lines, points that define to display the graph.
To define colors:
• Pull down the report writer’s Document menu
• Click on the option “Color Definitions”
You will see the Color Definitions screen:
164 Report Writer User Guide
Graphical Report Definition
Figure 3.43: Bars, Lines, and Points Are Assigned Names and
Component Values Which May be Determined From a Color
Wheel Using the COLOR Button.
The color Definitions Screen enables you to add, edit, and delete a color. To add a color, click
the ADD button. The report writer displays the Color Editor screen. You may define a color in
two ways:
• If you know the levels of Red, Green, and Blue that define the color you want simply enter the color’s Name, fill in the values in the Components fields, and click the
OK button.
• You may also have the Component values filled in for you by entering the Name for
your color and clicking the COLOR button. This displays the Select color screen
which provides a color palette.
Report Writer User Guide 165
Advanced Topics
Figure 3.44: The Select Color Screen is used to Chose a
Color and Automatically Assign its Component Values.
You may use the color palette to select the exact color you want to define. When you click the
OK button, you are returned to the Color Editor screen. The color Component values are filled
in for you based on your selection.
Defining the Graphing Object
Now that we have looked at the Query Source and identified the columns that will provide the
data we want to graph, and we have defined colors that we will associate with bars, lines, and
points in our graph, we can define the details of our graphing object. Double-clicking on the
Graph object we placed in our report definition displays a dialogue with four tabs. Let’s take a
look at each:
Graph Editor General Tab
The most significant aspect of the General tab is that it is the place where we link our Graph
object to a Query Source. We also can precisely control the size and location of the graph on
the report give it a title and assign a base Font that can be used throughout the rest of the Graph
object’s definition or overridden by exception.
166 Report Writer User Guide
Defining the Graphing Object
Figure 3.45: The Graph Editor General Tab is
used to Assign a Query Source and Provide a
Graph’s Title.
The Graph Editor tab provides the following options:
Query Source: From the pull down list select the Query Source that provides the columns
containing the values you want graphed.
Position/Size: It is easiest to simply drag the Graph object in the report definition and
resize it with your mouse. However, for very precise control you may enter X and Y coordinates for the location and a Width and Height defined in inches.
Base Font: You may click the FONT button to define the characteristics of a base font for
your graph. Then, on other tabs in the Graph Editor, simply check “Use Base Font” to
select it for use on that element of the graph.
Title: Enter the title you want to appear above (but within) your graph
Next we will define the Data Axis.
Report Writer User Guide 167
Advanced Topics
Graph Editor Data Axis Tab
The Data Axis tab in the Graph Editor defines your graph’s X axis.
Figure 3.46: The Graph Editor Data Axis Tab is
used to a Column That Shows Dynamic Data
Along the X Axis (in this Case a Date Range)
and Assign the X Axis a Title.
You may define the following information in the Data Axis tab:
Data Axis Labels: The Column field in this section refers to columns that are the Query
Source you referenced under the General tab. This column contains the dynamic data you
want displayed along the bottom of the X axis. In our example, the column “period” contains the date for each period that will be displayed in our time-series graph of inventory
activity.
Data Axis Title: This section enables you to provide a static description for the X axis that
displays along its base.
168 Report Writer User Guide
Defining the Graphing Object
Both sections under the Data Axis tab enable you to select the base font defined under the
General tab, or, leave the option unchecked and use the FONT button to specify a different
font and size.
Now that the X axis is defined, it is time to define the static information and other parameters
that control the Y axis.
Graph Editor Value Tab
The Graph Editor’s Value Axis tab enables you to define properties of a graph’s Y Axis.
Figure 3.47: The Graph Editor Value Tab is
used to Define Y Axis Behavior and Provide
Title for It.
There are two main sections in the Value Axis tab:
Min/Max: The Min/Max values control the minimum and maximum value that will for
displayed for a graphed element. If the values are set to 0 and “Expand Min/Max if
needed” is checked, the limits of the Y axis will equal largest and smallest graphed element.
Report Writer User Guide 169
Advanced Topics
Value Axis Title: The value of the field Title is static and will display vertically along the
Y axis of the graph.
Both sections under the Value Axis tab enable you to select the base font defined under the
General tab, or, leave the option unchecked and use the FONT button to specify a different
font and size.
Graph Editor Series Tab
The Series tab in the Graph Editor enables you to define one or more series that are plotted on
your graph.
Figure 3.48: The Graph Editor Series Tab is
used to Define the Dynamic Series Data That Is
Displayed in the Graph.
To Establish a series click the NEW button and then fill in the following:
Name: Assign your new series a descriptive name. This name is for internal reference
only and is not displayed on the graph.
170 Report Writer User Guide
Defining the Graphing Object
Column: Link your series to a column in the Query Source (linked to the graph under the
General tab) that contains the information you want graphed.
Color: Select from the drop down list a color that you defined earlier.
• You may also click the EDIT button and define one or more new colors.
Style: Check one or more styles to define how the data will display in the graph:
• Bars: Displays the series in bar format, or stacked bars for multiple series defined as
bars.
• Lines: Displays the series in line format.
• Points: Displays the series as a point on the graph.
If you want to continue by adding another series, click the NEW button. The series you are
defining is saved and all values cleared so you can defined the new series’ properties.
If you are done entering series information, you may click the OK button to exit the Graph
Editor, or click on another tab under it.
This completes the mechanics for defining a graph in the report writer. Earlier in this section
we saw the output of a report with an embedded graph. The definition process was easy and
straight forward. The graphing capability enables you to quickly enhance existing reports or
define new reports that improve how complex information is presented to users.
Report Writer User Guide 171
Advanced Topics
172 Report Writer User Guide
4
OpenRPT and ODBC
OpenRPT and its suite of tools enable you to connect natively to the PostgreSQL database.
However, OpenRPT can also be used to connect to other databases using an ODBC (Open
DataBase Connectivity) connection. In this chapter we will examine how to connect to an
alternate database—for our example, an Access database—using ODBC. We will be showing
you how to build a new report from the ground up, as we address the following steps:
•
•
•
•
•
Look at the Access database tables
Configure settings for the ODBC connection
Use the MetaSQL Editor to create the query
Use OpenRPT to create the report definition
Use the Report Renderer to view the report’s output
The Access Database
An Access database was chosen to demonstrate the ODBC connectivity capability of OpenRPT because it is widely used and easy to understand. The Contacts database used in the
example is in fact one of the sample databases delivered with Access 2000. Below we see two
of the tables we will be accessing throughout the example in this chapter:
Report Writer User Guide 173
OpenRPT and ODBC
Figure 4.1: Contacts and Calls Tables in the Sample Access Database
We will generate a report that connects to the Access database through ODBC, performs a
SQL query that joins these two tables grouping all calls by caller, and displays each call’s
duration, subject, and notes fields. The report output will look like this:
174 Report Writer User Guide
Figure 4.2: Sample Report Generated with Report Renderer
This report was generated using the Report Renderer (RPTRender) and a connection to the
Access database using ODBC.
Report Writer User Guide 175
OpenRPT and ODBC
Sample ODBC Connection
It is important to keep in mind that ODBC drivers have differing levels of capability. For
example, SQL written against one database using a specific driver may not function the same
way when accessing the same database using an ODBC driver. OpenRPT was developed with
a native connection to PostgreSQL. It can also connect to other databases using ODBC, but
you should temper your expectations by the limitations of the ODBC driver you implement.
Below we see the ODBC settings used to establish the connection to the Access database we
will use throughout this chapter:
Figure 4.3: ODBC Connection Settings
The name of this connection is “contacts,” and as you will see, this is the reference we will use
when connecting OpenRPT tools to the database. The connection also identifies the location
176 Report Writer User Guide
Connecting Through the ODBC Driver
and name of the Access database file (CONTACTS.MDB), which is the file that physically
contains the database.
Note
Some ODBC connections require database usernames and passwords for authentication. Authentication is implemented by the
ODBC driver; not by OpenRPT.
The first step when creating any OpenRPT report is to create the report’s SQL. We will use the
MetaSQL editor to accomplish this.
Creating the Report’s SQL with the MetaSQL Editor
In an earlier chapter you learned about the MetaSQL Editor and MetaSQL. In this section we
will connect the MetaSQL Editor to our database using the ODBC connection ‘contacts’ and
then craft the SQL we will use in the report’s definition.
Connecting Through the ODBC Driver
Upon starting the MetaSQL Editor, we should next connect to the database by clicking the
“File” drop down menu option. Next, select “Database” and finally “Connect”. You will see
the standard OpenRPT connection screen:
Report Writer User Guide 177
OpenRPT and ODBC
Figure 4.4: OpenRPT Connection Screen
Before proceeding, set the connection options by clicking on the OPTIONS button. You will
see:
Figure 4.5: Login Options for an ODBC Connection
You will need to set the fields as follows:
Driver: Select the ODBC option.
178 Report Writer User Guide
MetaSQL Parameters
Database: Enter the name you gave to your ODBC connection.
Server: Leave blank. This is only used when connecting to PostgreSQL.
Port: Leave blank. This only used when connecting to PostgreSQL.
Click the SAVE button, and then on the Log In screen click the LOGIN button. Remember that
the ODBC connection handles user authentication, so the “Username” and “Password” fields
are normally not required when using this connection methodology.
MetaSQL Parameters
Earlier you learned about passing parameters to a report’s query using MetaSQL. For this
report we will need two parameters: All_ID and Caller_ID. Use the drop-down menu option
“Tools” and then “Parameter List” to create these two parameters:
Figure 4.6: MetaSQL Parameters
The values for the parameters are unimportant. As you will see in the query, just the existence
of the All_ID parameter will cause the query to display data for all callers in the database.
The Query
Now we will create the query. Below is the SQL used in our query:
Report Writer User Guide 179
OpenRPT and ODBC
SELECT
contacts.FirstName,
contacts.LastName,
calls.Subject,
calls.Notes,
calls.Duration
FROM
calls,
contacts
WHERE
<? if exists("All_ID") ?>
contacts.ContactID = calls.ContactID
<? elseif exists("Caller_ID") ?>
contacts.ContactID = <? value("Caller_ID") ?>
AND
contacts.ContactID = calls.ContactID
<? endif ?>
ORDER BY contacts.LastName;
This query joins the calls table and the contacts table on the contactID. The MetaSQL checks
for the existence of the All_ID parameter. If it exists then the WHERE clause displays all calls.
If the All_ID parameter does not exist then the WHERE clause displays all calls where the
contacts.ContactID equals the value of the parameter Caller_ID.
If we select the “Tools” drop down menu and click “Execute Query” we see:
180 Report Writer User Guide
The Query
Figure 4.7: MetaSQL Results Output
Tip
Remember that you can use the “View” menu option “Log Output”
to troubleshoot your query.
Once we have a working query, we may save it to a text file by using the “File” menu option
“Save As”. In the next section, we will Copy and Paste this SQL into the report definition’s
Query Source.
Report Writer User Guide 181
OpenRPT and ODBC
Report Definition
Now that we have a working query for our report, we will create the report’s definition. Again,
you learned how to do this in previous chapters of this user guide.
Note
The report definition we will be building introduces the Group section concept, which was not covered in depth in previous chapters.
We will begin by running OpenRPT. Note that OpenRPT opens automatically. It does not
require authentication to a database. Unless your report definition resides in a PostgreSQL
database (such as OpenMFG), you will save the reports locally as XML definition files.
First let’s define our report’s Properties. Then we will create our Query Source with the SQL
we validated using the MetaSQL editor. Next we will use the section editor to create our
report’s sections. Then we will define the report’s parameters (we will use the ones tested with
the MetaSQL editor and embedded in our query). And finally we will save our report to the
XML definition file.
Report Properties
Start a new report by selecting the “New” option from the “File” menu. Then, define the
report’s Name, Title, and Description using the “Properties” option under the “Document”
menus, as shown below:
182 Report Writer User Guide
Creating the Query Source
Figure 4.8: Report Properties
Click OK after defining the report’s Properties.
Creating the Query Source
Before proceeding to the next step, open the query you created in the last section using the
MetaSQL Editor. Select the query and Copy it to the copy buffer. Then, in OpenRPT, use the
“Document” drop down menu and select the “Query Sources” option. Click the ADD button
and place your cursor in the Query portion of the screen. Right-click and paste your query
here. In the Name field enter “detail”. When you are done the screen should look as follows:
Report Writer User Guide 183
OpenRPT and ODBC
Figure 4.9: Query Source “detail” in OpenRPT Report Definition
Click the OK button and CLOSE the Query List screen.
Establishing Report Sections
Earlier in the user guide you learned about report sections. Next we will activate our report’s
sections. From the “Document” menu, select the “Section Editor” option. The following
screen will appear:
184 Report Writer User Guide
Establishing Report Sections
Figure 4.10: Initial Section Editor Settings
Select the following options using your mouse:
•
•
•
•
Report Header
Report Footer
PageFooter, Any Page(s)
Page Footer, Last Page
You’ll see later that we will leave the contents of the Page Footer, Last Page blank, as this will
suppress the printing of the Page Footer, Any Page(s) so that only the Report Footer will print
at the end of the report and we will not have a redundant section. This technique also applies to
report headers, but not in this case as this report will contain only a Report Header and a Group
Header, which we are about to define:
From the Detail Sections display, select the “unnamed” Detail Section and click the EDIT button. Set the following:
Section Name: Change to “group”.
Query Source: Select the one you just entered called “detail”.
Report Writer User Guide 185
OpenRPT and ODBC
Insert Page Break At End of Last Section: Leave unchecked. We will only have one
section and will chose not to set a page break.
Group Sections: Click the ADD button to add a new group
You will now see a Group Section Editor screen that you will fill in with the following values
as shown below:
Figure 4.11: Group Section Editor
A Group Section enables you to identify a Column in the query by which we will organize the
display of the information. In this example we have call reports filed by several people. By
grouping on the LastName column, we will have a report that organizes calls by caller. The
options available to us include the following:
Show Group Header: Creates a Group Header section. Frequently used to display the
Column by which the report is grouped (in this case the caller’s last name) and report column descriptions.
186 Report Writer User Guide
Establishing Report Sections
Show Group Footer: Creates a Group Footer section in which footer information, such as
sub-total and total query results, may be displayed.
Insert Page Break After the Footer: When selected, a page break is inserted between the
end of one set of groups and the beginning of the next.
Upon clicking OK on the Group Section Editor and then the Detail Section Properties screens,
you will find that your Section Editor screen now has a Detail Section called “group”, as
shown below:
Figure 4.12: Section Editor Screen After Detail Section Added
Closing the Section Editor now returns you to the report’s layout. This will now include space
for all of the sections you have created, as shown below:
Report Writer User Guide 187
OpenRPT and ODBC
Figure 4.13: Sections Added to Report Definition
The example shown above has been populated with the following information defined by section:
Report Header: The report’s title and a line. This appears on the first page only.
contact Group Header: This is the header for the group you just created called “contact”.
It will display the caller’s first and last names from the query. Note that while the query
may return many rows for a caller, the caller’s first and last name will be displayed only
from the first row for each group. It will also display the column headers above each set of
calls grouped by caller.
188 Report Writer User Guide
Defining Parameters
group Detail: This section displays the rows returned for each caller. In the group header
we display the caller’s name. Here we display the details for one or more calls made by
this caller.
contact Group Footer: The contents of this section display at the end of each set of calls
for each caller.
Report Footer: The Context Query called “page_number” is used here to display a page
number on the bottom the last page of the report.
Page Footer (Last): The next section is a Page Footer (any) which will put a page number
on every page, including the Report Footer—which would be redundant if we take no
action. A blank Page Footer (Last) serves to override the Page Footer (Any) with a blank
footer on the last page so that the only page number displayed on this page is the one from
the Report Footer.
Page Footer (any): This places a page number on every page of the report. We suppress
this on the last page of the report with a blank Page Footer (Last) so that only the Report
Footer is used.
Next we will define the parameters that will be used at run time when the report is generated
with the Report Renderer.
Defining Parameters
For our example we will create two parameters. One of them, if present, will cause the report
to display call information for all callers. The other enables the user to select a specific caller
for whom to display information. We already identified these parameters when we created the
report’s query using the MetaSQL Editor.
To define parameters click on the “Document” menu and select the “Defined Parameters”
option. Then click the ADD button to add a parameter called All_ID. Below is an example of
the All_ID parameter:
Report Writer User Guide 189
OpenRPT and ODBC
Figure 4.14: Static Parameter Example
The information we entered for the All_ID parameter is explained below:
Name: The name of the MetaSQL parameter as it appears in the report’s query.
Type: The format of the parameter. The following formats are possible: String, Integer,
Double, and Boolean.
Active: Specifies whether the parameter is active by default at run time in the Report Renderer.
Default: The default value for the parameter at run time.
Description: A description of the parameter for use internally.
Defined List: A static or dynamic list of options which the user may select from at run
time. The All_ID parameter uses the static Defined List functionality.
The next parameter, Caller_ID, uses the dynamic option for the Defined List capability:
190 Report Writer User Guide
Defining Parameters
Figure 4.15: Dynamic Parameter Example
Note
A static Defined List enables you to define a discrete list of options
which the user may chose from at run time. A dynamic Defined List
utilizes a SQL query that is executed at run time so that the user can
see a dynamic list of options.
In the example shown in Figure 4.15, you can see the query we have entered will return the
key value (i.e., ContactID) in the first column and the Last Name in the second column. Ultimately, the user will not see the ContactID. It is the second column that is the label the user
can click on at run time to determine the value of the parameter sent to the report definition
when the report output is generated.
So, our Parameter List now includes two Parameters, as shown below:
Report Writer User Guide 191
OpenRPT and ODBC
Figure 4.16: Parameter List
It is now time to save the report definition.
Saving the Report’s XML Definition File
To save a report definition for use with the Report Renderer, select the “Save As” option from
the “File” menu. This will enable you to save the report definition in XML, which is the standard file format for OpenRPT report definitions.
Figure 4.17: Saving Report Definition to XML Format
192 Report Writer User Guide
Connecting Through ODBC to the Database
Tip
By saving to a shared drive you can easily make your reports available to others who have access to the Report Renderer.
Now that we have saved our report definition, we can close OpenRPT and use the Report Renderer to generate the report’s output.
Generating Reports with RPTRender
RPTRender is a report rendering tool that enables users to open an OpenRPT report’s XML
definition, select or edit parameter values, and then generate the report’s output.
Connecting Through ODBC to the Database
The Report Renderer connection to the database through your ODBC connection works similarly to the connection you established with the MetaSQL Editor earlier in this chapter:
Report Writer User Guide 193
OpenRPT and ODBC
Figure 4.18: Connecting Report Renderer with an ODBC Connection
To connect, simply click on the OPTIONS button, select ODBC under Driver, and then enter
the name of the connection in the Database field. Click SAVE and then LOGIN. All other
fields may be left blank.
Opening the XML Report Definition
From the Report Renderer main screen, select the “Open” option from the “File” menu to load
the XML report definition:
194 Report Writer User Guide
Opening the XML Report Definition
Figure 4.19: Report Loaded in Report Renderer
If we are satisfied with the parameter settings—which in this example means printing call
detail for all callers—we can simply select the “Print” option from the “File” menu to generate
the following report:
Report Writer User Guide 195
OpenRPT and ODBC
Figure 4.20: Report Output for All Callers
In the next section, we will see how it is possible to change the parameters and generate the
report again.
196 Report Writer User Guide
Setting Parameters at Run Time
Setting Parameters at Run Time
The MetaSQL for our report generates rows for all callers if the All_ID parameter exists. Its
value is not a factor. In our next example, we want to generate a report for a single caller—not
all callers. This means that at run time we will want to delete the All_ID parameter. To do this
we must first click on it and then use the DELETE button.
Note
Deleting a parameter at run time only deletes it temporarily—for
the one time the report is being rendered. The parameter will still be
present in the report’s XML definition the next time you open it.
Once the All_ID parameter has been temporarily removed, we will use the LIST button to
select a specific caller for whom we want to generate the report.
Report Writer User Guide 197
OpenRPT and ODBC
Figure 4.21: Setting the Caller_ID Parameter Value
As you can see in Figure 4.21, we have indicated we want to run a report on the caller named
“Fuller.” We are now ready to print the report. The following shows the results we get:
198 Report Writer User Guide
Setting Parameters at Run Time
Figure 4.22: Report Output After Setting Dynamic Parameter’s Value
To generate this report we first created a connection to an ODBC data source, in this case an
Access database. Then we used the OpenRPT MetaSQL editor to create the SQL Query source
with MetaSQL parameters that enabled the user to specify all callers or a specific caller. We
then used OpenRPT to create the report’s definition, in which we specified a group in the detail
section to organize calls together by caller. We saved the definition to an XML definition file.
Finally, we opened the XML report definition with the Report Renderer, set the embedded
parameter values, and generated two versions of the report. This is the normal development
cycle for an OpenRPT report.
Report Writer User Guide 199
OpenRPT and ODBC
RPTRender Run Time Switches
The Report Renderer supports switches that enable values to be passed to it at run time. These
switches and a description of their use are provided below:
-databaseURL=
• Establishes the connection to the database:
-databaseURL=odbc:///
• Contacts connects to the database through the ODBC connection called “contacts”
-databaseURL=odbc:///
• Contacts connects to the database through the ODBC connection called “contacts”
-noAuth
• Indicates that no username and password are required as is typically the case when
this information is defined in the ODBC connection
-username=
• The database username
-passwd=
• The database user’s password
-param=
• Establishes a parameter, its type and its value. For example param=Caller_ID:string='3' establishes a parameter called Caller_ID of type string
with a value of ‘3’. This example, -param=show_inactive:bool='Y' establishes a
parameter called “showInactive” of type boolean with a value of ‘Y’
-print
• The presence of this switch simply opens the operating system’s print dialogue
immediately upon opening the Report Renderer
-printerName=
• The value of this switch is the name of the printer that is selected automatically
when the operating system’s print dialogue is opened. This example, -printerName="Laser6l" will automatically select the client computer’s printer with the
name Laser6l.
-close
200 Report Writer User Guide
RPTRender Run Time Switches
• The presence of this switch simply closes the Report Renderer after the user prints
or cancels printing.
Tip
When saving parameters to a report definition, the last position
should contain the location and name of the OpenRPT report definition file. For example, on Windows this would look like this:
c:\OpenMFG\Contacts-Calls-Report.xml
Below are two examples of scripts that call the Report Renderer, passing to it switch settings
for a specified report definition.
Figure 4.23: Example of a Script that Connects to an ODBC Data Source
Figure 4.24: Example of a Script that Connect to a PostgreSQL Data Source
The switches that the Report Renderer enables make it possible for you to store OpenRPT
XML report definition files on a shared drive and script end user access to them for ad hoc
reporting capability.
Report Writer User Guide 201
OpenRPT and ODBC
202 Report Writer User Guide
5
OpenMFG Topics
This chapter contains focuses on topics related to the report writer embedded within the OpenMFG ERP Suite. While OpenRPT users may find useful information here, this chapter is dedicated primarily to OpenMFG users.
Labels and Forms
The OpenMFG report writer enables you to customize report definitions that produce standard
sized labels for shipments and generate them from the OpenMFG client. It also enables you to
define unique report definitions, called forms, for packing lists and bills of lading that can be
linked to one or more customers. There are three steps necessary to define and generate a label
or form:
Step 1 - Report Definition
• Define the label or form’s report definition
with the OpenMFG report writer
Step 2 - Report Definition Link
• Link the label or form to the report definition
• For forms, link the form to one or more customers
Step 3 - Generate Labels or Forms
• Generate labels or forms from the OpenMFG client using options on S/R - Forms
menu
Report Writer User Guide 203
OpenMFG Topics
There are six sessions that generate labels of forms and they are accessed through S/R - Forms
menu: They are:
•
•
•
•
•
•
Print Packing List
Print Shipping Form
Print Shipping Forms
Print Shipping Labels by S/O #
Print Shipping Labels by Invoice
Print Receiving Labels by P/O #
Though several of these forms and labels can be generated from other places within OpenMFG, the S/R, Forms menu is a single menu from which all can be generated:
Figure 5.1: OpenMFG Forms Menu
In the next few sections we will examine the setup for producing custom labels and forms.
Remember, forms are named report definitions that are linked to a customer. Labels are report
definitions that are linked to a unique name but not a specific customer. However, you could
create a report definition for a label and assign it a name that references a customer. This is
appropriate when a customer has a unique label requirement and you want the name of the
report definition to reflect this.
204 Report Writer User Guide
Linking a Form Name to a Report Definition and Customer
Linking a Form Name to a Report Definition and Customer
The cross referencing capability in OpenMFG is a very powerful feature that makes if possible
to, for example, to define report definitions that are unique to a customer or types of customers.
When you define a Customer (see below) you will assign the customer a Customer Type and a
preferred Shipping Form:
Figure 5.2: Customer Master
The entries that display in the Shipping Form choice field are first defined using the session
Shipping Forms located on the S/O - Master Information menu:
Report Writer User Guide 205
OpenMFG Topics
Figure 5.3: Shipping Forms
This session enables the creation of a unique form name that is linked to an OpenMFG report
definition. Running the session Print Shipping Form from the menu S/R - Forms causes OpenMFG to display the customer’s preferred shipping form in the field Shipping Form.
This technique makes it possible to create logical form names that are tied to specific report
definitions and to one or more customers.
Referring back to the Customer master you will also note the Customer Type field. This also
controls the printing of forms. The following session enables you to define, by Customer
Type, the report definition that is used to generate the specific documents listed:
Figure 5.4: Customer Form Assignments
The following diagrams recap the setup just described for Customer Form Assignments:
206 Report Writer User Guide
Linking a Form Name to a Report Definition and Customer
Figure 5.5: Linking Customers to Customer Form Assignments
We have also looked at the screens that link a customer to a shipping form. The following diagram recaps this setup:
Report Writer User Guide 207
OpenMFG Topics
Figure 5.6: Linking Report Definitions to Sales Orders
Later in this section we will look at the parameters values that are passed to the report definition when Print Shipping Form and Print Packing List are run from the S/R Forms menu. But
first, let’s look at how OpenMFG enables you to define unique label definitions.
208 Report Writer User Guide
Linking a Label to a Name and Report Definition
Linking a Label to a Name and Report Definition
The last three options on the S/R - Forms menu are:
• Print Shipping Labels by S/O #
• Print Shipping Labels by Invoice
• Print Receiving Labels by P/O #
The cross-reference to the report definition for these three is a little simpler. On the System
menu’s Master Information a sub-menu is the Label Forms option:
Figure 5.7: Label Forms
When one of the three options label options on the S/R - Forms menu (listed in the table
below) is run, the user is presented with a drop down choice field called Report Name in which
is displayed the form name linked to a report definition using the session Label Form.
System - Master Information: Label
Forms
Enables the creation of a unique form name
that is linked to an OpenMFG report definition. The report name displays in the
Report Name field on the following label
reports:
• Print Shipping Labels by S/O #
• Print Shipping Labels by Invoice
• Print Receiving Labels by P/O #
Report Writer User Guide 209
OpenMFG Topics
Label and Form Parameters
When a user runs generates a form or a label from an option on S/R, Forms menu, the OpenMFG client passes parameter values to the selected form’s definition (more on this shortly)
based on the user’s entries. These parameter values can be used by the report’s SQL to retrieve
information from the database.
The tables below identify fields on the sessions that are available on the S/R Forms menu. The
parameters column provides the name of the parameter that corresponds to the field if it is in
fact a parameter (not all are). Also provided, in the Table Reference column is the name of a
table that the author of the report may choose to query to locate information in the database
based on the parameter value provided by the user.
It is important to note that some fields are not parameters and some parameters do not correspond to tables. For example the parameters labelTo and labelFrom pass parameter values that
can be used in the report definition to control the number of labels that print. These parameters
do not correspond to a table.
Print Packing List
The option Print Packing List, located on the S/R - Forms menu, enables you to generate a
packing list by entering a sales order number (see the section Linking a Form Name to a
Report Definition and Customer to see how this is setup). At run-time, the order’s internal reference number is passed to the report definition as the value for the parameter sohead_id. This
parameter can be employed in a query that derives information from a join on the tables
cohead and shipto to retrieve information pertinent to shipping labels.
Field
Parameter
Table Reference
Sales Order #
sohead_id
cohead
Print Shipping Form
The option Print Shipping Forms, located on the S/R - Forms menu, enables you to see a customer’s default Shipping Form by entering a sales order number (see the section Linking a
Form Name to a Report Definition and Customer to see how this is setup) and override it if
you chose.
210 Report Writer User Guide
Label and Form Parameters
At run-time, the order’s internal reference number is passed to the report definition in the
value of the parameter cosmisc_id. This parameter can be employed in a query that derives
information from a join on the tables cosmisc and shipto to retrieve information pertinent to
shipping labels.
The table below shows these and other parameters that are passed to the report definition and
may be used to query other tables (if applicable) or display their value on the report. For
example, the user’s input for Watermark is passed in the parameter watermark and may be referenced in a report’s Properties and displayed as a dynamic watermark.
Field
Parameter
Table Reference
Sales Order #
cosmisc_id
cosmisc
Shipping Form
not a parameter
n/a
Shipping Charges
shipchrg_id
shipchrg
# of Copies
not a parameter
n/a
Watermark
watermark
n/a
Show Prices
showcosts
n/a
Print Shipping Forms
The session Print Shipping Forms prints all orders that are at shipping and have not yet had
shipping forms printed or for which a shipping change has been recorded. You can see orders
at shipping and the status of their shipping forms by going to the session Maintain Shipping
Contents on the menu S/R - Shipping. The column “Prnt’ed” indicates the status of shipping
forms.
Using Print Shipping Forms an order’s shipping forms may only be printed once unless the
shipment has been changed and then the field Print Shipping Forms for Changed Shipments
must be checked. Note, the session Print Shipping Form (the second option on the S/R Forms menu) will always enable you to print a specific sales order’s shipping form.
The table below identifies screen literals, parameters, and a table reference to assist you in creating your report definitions for labels:
Report Writer User Guide 211
OpenMFG Topics
Field
Parameter
Table Reference
Print Shipping Forms for New Shipments
not a parameter
n/a
Print Shipping Forms for Changed
Shipments
not a parameter
n/a
# of Copies
not a parameter
n/a
Watermark
watermark
n/a
Show Prices
showcosts
n/a
Print Shipping Labels by S/O #
The Print Shipping Labels by SO # session is found on the S/R - Forms menu. The is user
prompted to enter a Sales Order number, select a label form (remember that these were defined
in the System - Master Information: Label Forms session) in the Report Name field, and enter
a range in the Labels: from and to fields to control the number of labels printed. This approach
enables you to pre-define a variety of label formats.
The table below identifies screen literals, parameters, and a table reference to assist you in creating your report definitions for labels. Note that address information for orders that are destined for customer ship-to addresses is contained the table shipto and can be accused with a
join to information in the table cohead using the value passed by the parameter sohead_id.
Screen Literal
Parameter
Table Reference
Sales Order #
sohead_id
cohead
Report Name
not a parameter
n/a
Label from
labelFrom
n/a
Labels to
labelTo
n/a
Print Shipping Labels by Invoice
The Print Shipping Labels by Invoice session is found on the S/R - Forms menu. The user is
prompted to enter an Invoice Number, select a label form (remember that these were defined
in the System - Master Information: Label Forms session) in the Report Name field, and enter
212 Report Writer User Guide
Label and Form Parameters
a range in the Labels: from and to fields to control the number of labels printed. This approach
enables you to pre-define a variety of label formats.
The table below identifies screen literals, parameters, and a table reference to assist you in creating your report definitions for labels:
Screen Literal
Parameter
Table Reference
Invoice #
invchead_id
invchead
Report Name
n/a
n/a
Label from
labelFrom
n/a
Labels to
labelTo
n/a
Print Receiving Labels by PO #
The Print Receiving Labels by PO # session is found on the S/R - Forms menu. The user is
prompted to enter an Purchase Order number, select a label form (remember that these were
defined in the System - Master Information: Label Forms session) in the Report Name field,
and enter a range in the Labels: from and to fields to control the number of labels printed. This
approach enables you to pre-define a variety of label formats.
The table below identifies screen literals, parameters, and a table reference to assist you in creating your report definitions for labels. Note that receiving line item information is contained
in the table porecv and can be accessed with a join to information in the table pohead using the
value passed by the parameter pohead_id. In this way, receiving labels that contain item,
description, quantity and other information pertinent to receiving and putaway can be generated.
Screen Literal
Parameter
Table Reference
P/O #
pohead_id
pohead
Report Name
n/a
n/a
Label from
labelFrom
n/a
Labels to
labelTo
n/a
Report Writer User Guide 213
OpenMFG Topics
Report Definition for Custom Labels
To begin you must define a label’s report definition using the OpenMFG report writer. Previous sections of this guide have provided detailed explanations on the mechanics of creating
report definitions. Below are areas of interest that are specific to a label definition in general
and the sample label shown.
Generating a Label Sheet
Before we begin, let’s see how the custom label was printed and what it looks like. The customer label was printed through the Print Labels by Sales Order option found on the S/R,
Forms menu:
Figure 5.8: Custom Shipping Labels by Sales Order
Note that the user enters the Sales Order for which the labels are to be generated, selects a
Report Name, and enters a value for Labels From and To - this controls the number of labels
printed.
The Sales Order number is passed to the report definition as a parameter called sohead_id
which can be used in an SQL query to look up additional information about the order in the
table cohead.
Likewise the values entered for Label From and Label To are passed as the parameters labelFrom and labelTo. These parameters do not correspond to a specific table, but later we will
learn how to use them in conjunction with the sequence table to create multiple labels.
The Report Name choice field lists all of the Reports Names that have been linked to a report
definition using the session Forms found on the System, Master Information menu. Only
Report Names linked to report definitions using the Forms session will display in this choice
field.
The report definition we will look at generates the following labels:
214 Report Writer User Guide
Report Definition for Custom Labels
Figure 5.9: Custom Labels with Bar Codes
Note that three labels were generated based on a user entry for Label From of 1 and Label To
of 3.
Label Report Definition
Let’s take a look at the report definition that generated these labels.
Report Writer User Guide 215
OpenMFG Topics
Figure 5.10: Sample Report Definition for a Shipping Label
As noted earlier, the OpenMFG report writer supports several standard label sizes. This report
uses an Avery 5263 label size. The Page Setup session is used to select a label size.
Note
The report writer supports Avery Standard Labels. It also supports
portrait or landscape, Letter, Legal, and A4 documents.
Report Definition Page Setup
To open the Page Setup session, in the report writer:
• Pull down the Document menu
• Click on the “Page Setup” option
216 Report Writer User Guide
Report Definition Page Setup
Figure 5.11: Selecting Label Type
Labels use a Paper Size type of “Labels”. Then, one of three predefined Label Types may be
selected:
• Avery 5263
• Avery 5264
• Avery8460
This controls the size of the Detail section of the report which is the only portion of the report
definition that should be used for a label report definition.
Displaying a Parameter Value
We noted earlier that one of the parameters passed to the report definition at run-time was
labelTo. You may have noticed that the labels show the value of the user’s input for this
parameter in the lower right corner of each label. This was accomplished by creating a special
Properties (Field) that references “Parameter Query” in the Query Source field and the name
of the parameter (labelTo) in the Column field.
Report Writer User Guide 217
OpenMFG Topics
Figure 5.12: Parameter Values for Label
The other values for fields on this report definition were retrieved from the database through
and SQL query.
Label Report Query Definition
The query in the report definition is sophisticated and yet fairly straight forward. It is shown
below:
218 Report Writer User Guide
Report Definition Page Setup
SELECT
sequence_value,
cohead.cohead_number,
cohead.cohead_shipto_id,
cohead.cohead_custponumber,
shipto.shipto_name,
shipto.shipto_address1,
shipto.shipto_address2,
shipto.shipto_address3,
shipto.shipto_city,
shipto.shipto_state,
shipto.shipto_zipcode
FROM
public.cohead cohead,
public.shipto shipto,
public.sequence
WHERE cohead.cohead_shipto_id = shipto.shipto_id
AND ((cohead.cohead_id=<? value("sohead_id") ?>)
AND (sequence.sequence_value
BETWEEN <? value("labelFrom") ?>
AND <? value("labelTo") ?>));
Let’s take a look at each section of this query:
SELECT SECTION
This portion of the SQL retrieves column values from three tables: sequence, cohead, and
shipto. The values retrieved are used to define the Columns in the Property (Fields) session
which controls what and how dynamic information is displayed on the label. The descriptions
of these fields are self explanatory.
FROM SECTION
This portion of the SQL specifies the tables from which the query retrieves the data:
cohead
This table contains Header information for Sales Orders
Report Writer User Guide 219
OpenMFG Topics
shipto
This table contains customer shipping addresses
sequence
This table contains a sequence of numbers from 1 to 1000 and
facilitates the execution of the SQL multiple times in order to
generate multiple labels
WHERE SECTION
The WHERE section of the SQL does the following:
• Retrieves the row in the table cohead where the column cohead_id equals the value
for the parameter passed from the user (the user enters the order number but the program passes the order’s system generated cohead_id).
• Joins the tables cohead and shipto on the columns cohead_shipto_id and shipto_id.
• Causes the SQL to “fire” multiple times to print multiple labels. The table sequence
contains a sequential list of integers from 1 to 1000 and is used by the query such
that it repeats for the number of times contained in the range defined by the labelFrom and labelTo parameters. The information returned is the same each time but
by design the report writer generates one label each time the SQL returns a row of
information.
The table shipto contains the specific the shipping address information that appears on the
label. Also note that parameters are contained inside the MetaSQL tags <? and ?>.
Note:
Finally, for the sake of simplicity, this sample label’s SQL only generates labels for orders in which the shipping address is selected
from the list of Ship-To’s by customer. In this case this scenario the
shipping address is contained in the table shipto. For orders where
the ship to address is merely copied using the button COPY TO
SHIP-TO -> button, the address information is contained in the
table cohead. A more sophisticated query, leveraging MetaSQL
could test for this condition (the value of column cohead_shipto_id
= -1 in table cohead) and retrieve the shipping information directly
cohead. If you decide to re-create this label, make certain to test it
against a Sales Order that uses an address from the list of predefined customer ship-to’s.
220 Report Writer User Guide
Report Definition Page Setup
Linking Label Name to Report Definition
Once the report definition is created, it is time to link it to a user defined Form Name:
•
•
•
•
Pull down the OpenMFG System menu
Click on the Master Information menu
Select the option “Forms”
Click the NEW button
Figure 5.13: Linking Label Names to Report Definitions
The Form Name field is a user friendly description of the label displayed to the user when the
user is selecting a label type to print. It could, for instance, link to a special report definition in
the Report field that is unique to a specific customer. The # of Labels per Page field is not
used.
To print your labels, first create a Sales Order that uses a pre-defined customer ship-to address.
Then:
• Pull down the OpenMFG S/R menu
• Click on the Forms menu
• Select the option Print Shipping Labels by SO #
Report Writer User Guide 221
OpenMFG Topics
Figure 5.14: Generating Custom Shipping Labels
• In the field Sales Order #, enter the order number sales order you just created
• In the choice field Report Name, select the name of the label you just liked to your
report definition using the Forms session
• Set the Label from field to 1 and the To field to 3
• Click the PRINT button
OpenMFG will print 3 labels, based on the unique report definition you linked to the Report
Name selected, that contain information for the customer’s ship-to address tied to the order
you entered.
CSVimp
CSVimp is a tool used for data migration.
Report Importing Tools
In Chapter One we learned how to save a report definition to an XML (Extensible Markup
Language) file that is external to the OpenMFG database. These files may be used as a backup
and as a means to share reports definitions throughout the OpenMFG community.
In this chapter we will learn about two tools that facilitate the importation of one or more
report definitions using their XML definition file. We have already seen that it is possible to
use the report writer itself to open a report from its XML definition file so the main benefit to
222 Report Writer User Guide
importrptgui
these tools is the ability to import multiple files simultaneously, or, in the case of the command
line tool, write scripts that do the importation.
importrptgui
The first tool we will look at is the Report Import Tool. This tool runs on all supported client
platforms and provides a simple, easy to use graphical user interface importation capability.
The name of the binary file that you execute from a command line to start the Report Import
Tool is importrptgui (note that on the Windows platform you will include the ‘.exe’ suffix).
The Report Import Tool is designed to simplify the process of uploading multiple reports to an
OpenMFG database. For optimal performance, the importrptgui file should be placed in the
same directory as the OpenMFG (‘.exe’ on Windows) client file.
When you open the utility, you will notice that you are brought to the standard OpenMFG log
in screen. Log in to the database where you want to upload your reports. As with the OpenMFG client, you may click the OPTIONS button to change these settings.
From the command line, and in the directory where the OpenMFG client files and the importrptgui binary files are co-located, run importrptgui. You will see:
Report Writer User Guide 223
OpenMFG Topics
Figure 5.15: Main Screen of importrptgui Tool
The definitions that you import with this tool may be newly created reports, or, updated versions of already existing reports.
Using the ADD button on the GUI screen, browse for the directory where you have saved your
report definition .xml files. Once you have located and opened the directory where the files are
stored, you may add them individually by double-clicking on them one-at-a-time. Or, you may
select all or a subset of the total using your window manager.
224 Report Writer User Guide
importrptgui
Figure 5.16: Importing Report Definitions in XML Format
As you load reports into the list, you will see a number in brackets following the name of each
report. This number is the grade assigned to each report. The reports will be loaded into the
database using the grade you see here. By default this grade is zero. If you choose to change
this value, you may double-click on any of the reports in the list to bring up a dialog that will
allow you to set the value for the grade.
Report Writer User Guide 225
OpenMFG Topics
Figure 5.17: Report Grading
It is important to remember that when running a report, OpenMFG uses the report definition
with the highest grade (for example, 10 runs before 9). OpenMFG recommends that you never
overwrite the report definition with grade 0, reserving this for the definition provided by
OpenMFG.
If after you are done adding reports to the list you find a report which you do not want to
upload, simply highlight the report and select the REMOVE button. The report will be
removed from the list, and it will not be uploaded.
Once you are satisfied with your list of reports and the grades you have assigned, highlight
individual reports or use the SELECT ALL button to select all of the reports for importing.
After the desired reports have been highlighted, select the IMPORT button. The highlighted
reports will be uploaded to the database you logged into when you started your session.
226 Report Writer User Guide
importrptgui
Figure 5.18: Selecting Reports To Be Imported
The Messages section of the Report import Tool shows the status of your import.
To exit, select the EXIT option from the “File” menu--or click on the “X” in the upper-right
hand corner of the screen.
After importing report definitions, you may want to open the OpenMFG report writer and
view the report definitions you imported.
Report Writer User Guide 227
OpenMFG Topics
Figure 5.19: Updated Grade After Import
While report definitions can be loaded from the .xml definition file through the report writer
itself, the Report Import Tool expedites this process when multiple report definitions require
importation.
Now let’s look at a tool that enables you to import from the operating system’s command line
on a client computer.
importrpt
The command line import tool functions on all supported client environments and enables the
importation of .xml report definitions over the network through a command line on a client
computer. Systems administration personnel may embed the command line import tool in
scripts that import multiple report definitions in a single run or use it iteratively from the command line.
The example provided in this document shows the command line report import tool being used
on a Window client computer. The syntax is the same regardless of the operating system.
228 Report Writer User Guide
importrpt
Figure 5.20: Using importrpt Tool
The name of the binary is importrpt (with the ‘.exe’ extension on Windows) and should be collocated with the OpenMFG client application files. The table below shows the command, as
executed above, in a more readable fashion:
importrpt
-databaseURL=psql://openmfg.application/newdemo:5432
-username=jsmith
-passwd=js1app
-f=C:\OpenMFG\report_xml\Routing.xml
-grade=10
Figure 5.21: Sample importrpt Output
Let’s take a look at all of the options available in importrpt to understand each a little better:
Report Writer User Guide 229
OpenMFG Topics
Option
Syntax
-databaseURL=<connection URL>
Specify the connection information that importrpt
should use when loading a report definition. The
connection URL is in the following format:
psql://servername/database[:port]
In the connection URL, the servername is the host
or IP address of the server where the database is
running.
For example: somehost.openmfg.com
The database is the name of the actual database
you want to connect to on the specified server.
For example: mydb
The last option, port, is optional. If included, it
must follow a colon and be a valid port number. If
the port is not specified, the default port of '5432'
is used.
For example, if you wanted to connect to the database 'mydb' on the server 'somehost.openmfg.com'
using the default port, you would use the following
connection URL:
psql://somehost.openmfg.com/mydb
Similarly, if you wanted to connect to the database
'dbtest' on the server '192.168.128.64' using the
port 2345 you would use the following connection
URL:
psql://192.168.128.64/dbtest:2345
230 Report Writer User Guide
importrpt
-username=<user name>
This is user name you are using to connect to the
server and database. It is the same username that
the user enters when logging on through the OpenMFG client and must be setup using the OpenMFG client session Maintain Users.
-passwd=<password>
This is the password for the user name you specified in Maintain Users. This is the same password
that the user enters when logging in through the
OpenMFG client.
-grade=<number>
The grade used to load a report into the database.
A numeric value from 0 to 99 is valid. The default
value is 0 if this option is not specified. Grade 0
should generally be reserved for the baseline
report definition supplied by OpenMFG.
-f=<report definition>
The name of the report definition file (as it appears
on your disk) that you are loading into the database. The path may be included if the file is
located in a directory that is different from the one
in which importrpt is located and the syntax for the
path will vary by operating system.
You may have noticed that the report definition loaded in our example above was for the Routing report and that grade was assigned a value of 20. If, after running importrpt, we start the
OpenMFG report writer and browse the report definitions, we will find that we now have an
additional report definition for the Routing:
Report Writer User Guide 231
OpenMFG Topics
Figure 5.22: Report Grade Updated
We can see that Routing has 3 definitions: 0, 10, and 20. When a user runs the Routing report,
OpenMFG will use the definition with grade 20: the definition we just imported using the
importrpt command line tool.
232 Report Writer User Guide
6
Tools
In this chapter we will examine several third party tools you may find useful when creating
OpenRPT report definitions. The tools can also be helpful to system administrators responsible
for maintaining OpenMFG Databases and/or other PostgreSQL databases.
The first tool we will look at is pgAdmin III, an open source database administration utility for
PostgreSQL. Next we will look at the ODBC driver available for PostgreSQL. We will show
you how to install and configure an ODBC connection from a Windows client to a PostgreSQL database. Finally, we will examine how a query tool can be used to generate SQL that
can then be copied and pasted into an OpenMFG report definition Query Source to accelerate
the development of a new report.
pgAdmin III
The best description of pgAdmin III can be found on the project’s website:
“pgAdmin III is the most popular and feature rich Open Source administration and development platform for PostgreSQL, the most advanced Open Source database in the world.
The application may be used on Linux, FreeBSD, Solaris, Mac OSX and Windows platforms to manage PostgreSQL 7.3 and above running on any platform, as well as commercial versions of PostgreSQL such as Pervasive Postgres, EnterpriseDB, Mammoth
Replicator and SRA PowerGres.
Report Writer User Guide 233
Tools
“pgAdmin III is designed to answer the needs of all users, from writing simple SQL queries to developing complex databases. The graphical interface supports all PostgreSQL
features and makes administration easy. The application also includes a syntax highlighting SQL editor, a server-side code editor, an SQL/batch/shell job scheduling agent, support for the Slony-I replication engine and much more. Server connection may be made
using TCP/IP or Unix Domain Sockets (on *nix platforms), and may be SSL encrypted for
security. No additional drivers are required to communicate with the database server.
“pgAdmin III is developed by a community of PostgreSQL experts around the world and
is available in more than a dozen languages. It is Free Software released under the Artistic
License.”
Those who use pgAdmin III find it to be invaluable for performing database maintenance,
along with simply examining database structures and data.
Where Can I Find pgAdmin III?
You can download pgAdmin III for free either from the pgAdmin website (http://www.pgadmin.org/) or from the PostgreSQL website (http://www.postgresql.org). It is available for multiple operating systems and features an easy-to-use installation utility.
Connecting to an OpenMFG Database
Once you have completed the installation of pgAdmin III, it is time to configure a connection
to your OpenMFG Database. To begin, select the “Add Server” option from the pgAdmin III
“File” menu. You will be presented with the following screen:
234 Report Writer User Guide
Connecting to an OpenMFG Database
Figure 6.1: pgAdmin III Connection Definition Screen
You will need to provide the URL or IP address of your server along with the port on which
PostgreSQL is listening. Then, you will identify the name of your OpenMFG Database—as
well as the username and password for the user who will be establishing the connection.
Once the server has been added and you have established a connection, the pgAdmin will
screen will look as follows:
Report Writer User Guide 235
Tools
Figure 6.2: Table View in pgAdmin III
pgAdmin III will add your new connection to its list of servers. In the future, you can simply
double-click on the name of a server to initiate a connection.
Using pgAdmin III is helpful when creating OpenRPT reports because it enables you to see all
of a database’s tables and their corresponding columns. It is also possible to see data—and
even maintain data—by drilling down to a specific table, right clicking on it, and selecting the
“View Data” from the resulting menu. The following screenshot illustrates the data view:
236 Report Writer User Guide
Connecting to an OpenMFG Database
Figure 6.3: Viewing and Maintenance of Data
The pgAdmin III utility is a very powerful tool. Be sure to take care when using the “View
Data” option, as it enables you to manually update data in the database.
Note
Also worth noting is pgAdmin’s SQL Help option located under the
Help menu. These help filed provide very detailed descriptions and
examples of SQL commands, syntax, and statements.
What is ODBC?
The online technical resource Whatis.com provides the following definition for ODBC:
“Open Database Connectivity (ODBC) is an open standard application programming
interface (API) for accessing a database. By using ODBC statements in a program,
you can access files in a number of different databases, including Access, dBase, DB2,
Excel, and Text. In addition to the ODBC software, a separate module or driver is
Report Writer User Guide 237
Tools
needed for each database to be accessed. The main proponent and supplier of ODBC
programming support is Microsoft.
“ODBC is based on and closely aligned with The Open Group standard Structured
Query Language (SQL) Call-Level Interface. It allows programs to use SQL requests
that will access databases without having to know the proprietary interfaces to the
databases. ODBC handles the SQL request and converts it into a request the individual
database system understands.”
Locating the ODBC Driver For PostgreSQL
The ODBC driver for PostgreSQL can be downloaded from the PostgreSQL web site. If you
are running Windows, the driver also comes with an installer.
Configuring an ODBC Connection to OpenMFG
After installing the PostgreSQL ODBC driver, it is time to configure it. This is a simple task. If
you are running Windows, you perform the configuration by opening your Windows Control
Panel, selecting Administrative Tools, and then Data Sources (ODBC), as shown in the following screen:
Figure 6.4: Configuring ODBC Connection
238 Report Writer User Guide
Configuring an ODBC Connection to OpenMFG
On the ODBC Data Source Administrator Panel, click the ADD button to begin configuring a
connection to your OpenMFG PostgreSQL database. The following screen will appear:
Figure 6.5: Selecting PostgreSQL Driver
Select the PostgreSQL driver from the list of available drivers and click the FINISH button.
You will be presented with the following screen:
Figure 6.6: Final Driver Set Up
When finalizing the set up of the PostgreSQL driver, you are presented with the following
options:
Data Source: Give your connection a name (leave out spaces).
Description: Describe your connection.
Report Writer User Guide 239
Tools
Database: Enter the name of the PostgreSQL database.
Server: Provide the name or IP address of the PostgreSQL server.
Port: Enter the port on which the PostgreSQL database is listening.
User Name: Provide a database user’s user name.
Password: Provide the database user’s password.
Now that our ODBC configuration is complete, we will use the connection to access data in an
OpenMFG Database.
Capturing SQL with MS Query
If you know of a query tool that generates SQL statements, you may consider using that tool to
facilitate the writing of queries used in OpenRPT report definitions. Having an external query
builder can help to accelerate the creation of report definitions. In this section we will look at
an example of how this process works using one such query builder: Microsoft Query, which
is a component of the Excel program.
Note
Using external query tools can be helpful, as OpenRPT does not
currently have a native query builder.
What is MS Query?
Microsoft defines the query builder embedded within its Excel application as follows:
“Microsoft Query is a program for bringing data from external sources into other Microsoft
Office programs— in particular, Microsoft Excel. By using Query to retrieve data from your
corporate databases.”
Remember, we are most interested in MS Query as a means for generating SQL statements
which we can then run against our OpenMFG Database. Again, having predefined queries will
help accelerate the report building process in OpenRPT.
240 Report Writer User Guide
Using Predefined Queries in OpenRPT
Using Predefined Queries in OpenRPT
In this section we will illustrate how to use Excel’s MS Query to build a query which we will
then insert into an OpenRPT report definition to generate a report. Below is the final SQL generated by MS Query using our ODBC connection to the usr table in our OpenMFG Database:
SELECT
usr.usr_id,
usr.usr_username,
usr.usr_propername,
usr.usr_passwd,
usr.usr_locale_id,
usr.usr_initials,
usr.usr_agent,
usr.usr_active,
usr.usr_email
FROM
public.usr usr
ORDER BY
usr.usr_username
Figure 6.7: Predefined Query
Now we will show the steps involved to generate the predefined query shown in Figure 6.7.
First, open the Excel application. From the “Data” menu select the “Get External Data” option.
Then select the “New Database Query” option. You will be presented with the following
screen:
Report Writer User Guide 241
Tools
Figure 6.8: Selecting ODBC Data Source
Select the new ODBC connection you just created against your PostgreSQL database, and then
click the OK button.
Figure 6.9: Choosing Columns with Query Wizard
In the left column, scroll to the table usr and click on it. Then select the “>” button to select
all columns in the table. Finally, select the NEXT button to be brought to the following screen:
242 Report Writer User Guide
Using Predefined Queries in OpenRPT
Figure 6.10: Filtering Data with Query Wizard
Next, the Query Wizard provides you with the opportunity to filter the data. For this exercise,
we will choose not apply a filter to the data. Click the NEXT button to reach the following
screen:
Figure 6.11: Sorting Criteria with Query Wizard
Report Writer User Guide 243
Tools
We will define one sort criteria. In the “Sort by” field select the column usr_username and
check “Ascending” next to it. Click the NEXT button to reach the next screen:
Figure 6.12: Multiple Output Options
Because we are only using Query to generate an SQL statement, we check the option “View
data or edit query in Microsoft Query.” Click the FINISH button.
244 Report Writer User Guide
Using Predefined Queries in OpenRPT
Figure 6.13: Viewing the SQL
Initially, Query displays the results of the query we just created with the Query Wizard. To see
the syntax of the SQL statement, click the SQL tool in the toolbar.
To copy this SQL statement for importing into an OpenRPT report definition, select the statement and then right click and use the “Copy” option. Later you can paste the statement into an
OpenRPT Query Source.
Earlier chapters in this user guide covered the details of modifying and creating OpenRPT
report definitions. The next few screens show the core elements of a report definition and the
resulting output.
Report Writer User Guide 245
Tools
Figure 6.14: SQL Pasted in Query Editor
Above you can see the SQL statement exactly as it was copied from Microsoft Query and
pasted into an OpenRPT Query Source for a new report definition. We will run this report
using the OpenMFG application—and so we will save it with the already-existing report definition name “UsersMasterList.” To distinguish this version of the report from others, we will
assign this version a Grade of “20.” In OpenMFG, report definitions having the highest grade
are used. Assuming “20” is the highest grade for “UsersMasterList,” our new version will be
run with users select PRINT from the OpenMFG master list of users.
246 Report Writer User Guide
Using Predefined Queries in OpenRPT
Note
The SQL in our example is the exact same SQL statement as it was
copied from Microsoft Query. MetaSQL has not been added to it.
When printing the user master list from OpenMFG, the client passes
the parameters locale_id and showInactive to the report
definition at run time. These parameter values can be used to create
sophisticated WHERE clauses that show data on the report based
on user entries on the User screen. Remember, you can use the
MetaSQL Editor to test SQL that contains MetaSQL before pasting
into a report’s Query Source. MetaSQL is covered in another chapter of this user guide.
Below is a look at the report definition we created using the query we built with Microsoft
Query.
Figure 6.15: View of Report Definition
This report definition will be run when an OpenMFG user selects PRINT on the following
OpenMFG screen:
Report Writer User Guide 247
Tools
Figure 6.16: OpenMFG Users Master List
After we select PRINT, the report definition is printed just as we planned:
Figure 6.17: Final Report Output
The report shown above was generated using the SQL we copied from Microsoft Query. It
demonstrates the speed and ease with which new reports can be created and deployed using
OpenRPT.
248 Report Writer User Guide