1
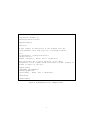
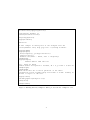
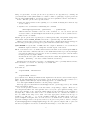
\ documentclass [ a4paper ]{ article }
\ title { Sweave Example 1}
\ author { Friedrich Leisch }
\ usepackage { Sweave }
\ begin { document }
\ maketitle
In this example we embed parts of the examples from the
\ texttt { kruskal . test } help page into a \ LaTeX {} document :
\ begin { Schunk }
\ begin { Sinput }
> data ( airquality , package =" datasets ")
> library (" stats ")
> kruskal . test ( Ozone ~ Month , data = airquality )
\ end { Sinput }
\ begin { Soutput }
Kruskal - Wallis rank sum test
data : Ozone by Month
Kruskal - Wallis chi - squared = 29.2666 , df = 4 , p - value = 6.901 e -06
\ end { Soutput }
\ end { Schunk }
which shows that the location parameter of the Ozone
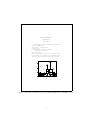
distribution varies significantly from month to month . Finally we
include a boxplot of the data :
\ begin { center }
\ includegraphics { example -1 -002}
\ end { center }
\ end { document }
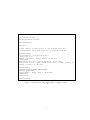
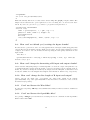
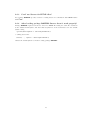
Figure 2: Running Sweave("example-1.Rnw") produces the file ‘example-1.tex’.
4