1
National Aquatic Ecosystem
Biomonitoring Programme
Rivers database: A user manual
NAEBP Report Series No
Department of Water
Affairs and Forestry
11
Department of Environmental
Affairs and Tourism
Water Research
Commission
Published by the
Department of Water Affairs and Forestry
March 2000
All enquiries should be addressed to:
The Director: Institute for Water Quality Studies
Private Bag X313
PRETORIA 0001
Republic of South Africa
Tel: (012) 808-0374
Copyright reserved
This report should be cited as:
Fowler, J, H Dallas and P Janssens. 2000. Rivers database: A user manual.
NAEBP Report Series No 11. Institute for Water Quality Studies,
Department of Water Affairs and Forestry, Pretoria, South Africa.
Compiled by:
J. Fowler, H. Dallas & P. Janssens*
Southern Waters Ecological Research and Consulting cc
Freshwater Research Unit
University of Cape Town
CAPE TOWN
South Africa
And
Soft Craft Systems*
P O Box 30169
TOKAI
South Africa
TABLE OF CONTENTS
1.
INTRODUCTION .......................................................................................................................... 1
1.1
1.2
1.3
1.4
1.5
1.6
2.
BACKGROUND .................................................................................................................................... 1
CURRENT DATA .................................................................................................................................. 1
MAINTENANCE AND FUTURE LINKS TO THE WATER MANAGEMENT SYSTEM (WMS).................................... 1
USER CONTROL AND DATA SECURITY .................................................................................................... 1
LAYOUT OF THE MANUAL ..................................................................................................................... 2
CURRENT STATUS OF THE RIVERS DATABASE ......................................................................................... 2
STRUCTURE OF THE DATABASE AND VIEWING DATA..................................................... 2
2.1
VIEWING INFORMATION IN TREE VIEW .................................................................................................. 4
2.1.1 Filtering the Tree View ..................................................................................................................... 4
2.1.2 Navigating to sites ............................................................................................................................ 4
2.1.3 Adding a new river, subregion or segment......................................................................................... 5
2.2
SITE AND SITE VISIT INFORMATION ....................................................................................................... 6
2.2.1 Adding a new site ............................................................................................................................. 7
2.2.2 Viewing data in Section A ................................................................................................................. 7
2.2.3 Adding site data to Section A .......................................................................................................... 10
2.2.4 Viewing Site Visit data in Section B................................................................................................. 11
2.2.5 Adding Site Visit data to Section B .................................................................................................. 12
2.2.6 Viewing Site Visit data in Section C ................................................................................................ 12
2.2.7 Adding Site Visit data in Section C.................................................................................................. 16
2.2.8 Reference Condition ....................................................................................................................... 17
3.
QUERY CENTRE ........................................................................................................................ 17
3.1
STEP-BY-STEP INSTRUCTIONS ON USING THE QUERY DATA DESIGNER .................................................... 17
Query Notes ................................................................................................................................... 19
3.2
SETTING CRITERIA ............................................................................................................................ 19
3.2.1 Operators and Wildcards................................................................................................................ 19
3.2.2 More about criteria ........................................................................................................................ 20
4.
TECHNICAL INFORMATION .................................................................................................. 21
4.1
SOFTWARE AND HARDWARE REQUIREMENTS ....................................................................................... 21
4.1.1 Application Architecture................................................................................................................. 21
4.2
INSTALLING THE RIVERS DATABASE APPLICATION ................................................................................ 22
4.3
STARTING THE RIVERS DATABASE APPLICATION .................................................................................. 22
4.4
SYNCHRONISING AND REPLICATING THE DATABASE .............................................................................. 22
4.4.1 REPLICATING OR BACKING UP THE DATABASE ...................................................................................... 23
Creating a Backup Replica ............................................................................................................. 23
4.4.2 CREATING A REPLICA TO SEND TO THE CENTRAL AUTHORITY
23
4.4.3 SYNCHRONISING A USER REPLICA WITH THE CENTRAL MASTER FILE....................................................... 24
4.5
TROUBLESHOOTING TIPS ................................................................................................................... 24
4.6
UTILITIES ........................................................................................................................................ 25
5.
USER SUPPORT FOR THE RIVERS DATABASE................................................................... 25
6.
REFERENCES ............................................................................................................................. 26
APPENDIX 1. GLOSSARY OF TERMS USED IN THIS MANUAL ................................................................................. 27
APPENDIX 2. SCREEN DUMPS OF THE DIFFERENT FORMS IN EACH SECTION OF THE RIVERS DATABASE .................. 29
APPENDIX 3. A STEP-BY-STEP EXAMPLE OF A QUERY SETTING SPECIFIC CRITERIA ..................................................45
Rivers Database
1.
INTRODUCTION
1.1
Background
The development of the Rivers Database was initiated as a small component of the Ecological
Reference Condition project which began in August 1997 within the national River Health Programme
(RHP). Initially, the purpose of the Rivers Database was to store data collected for the derivation of
ecological reference conditions for Mpumalanga. However, during the course of this project, the need
for a system which would ensure the efficient storage and management of all ecological information
collected as part of the RHP became evident.
Consequently, the Rivers Database project was
expanded to include all aspects of general importance to the RHP thereby providing a standard
biomonitoring data protocol for the collation and management of data on a national scale.
1.2
Current data
Besides its basic framework for the inclusion of biomonitoring data, the Rivers Database currently
houses a considerable amount of data. In particular, data collected as part of the pilot study from the
Mpumalanga region for the final design phase of the RHP (Roux 1999), together with historic data for
primary catchments B and X are included in the database [Institute for Water Quality Studies (IWQS),
Department of Water Affairs & Forestry (DWAF)]. Using existing spatial information captured in
Geographic Information Systems (GIS), basic information regarding rivers and their subregions was
extracted for the design of the tree view. Also, basic site information such as longitude/latitude,
geological- and vegetation-type has been extracted from GIS covers. Most of the biological data that
are available relate to invertebrate taxa (using SASS), water chemistry and habitat characteristics
collected for water quality assessments undertaken by IWQS since 1993.
1.3
Maintenance and future links to the Water Management System (WMS)
It is envisaged that a central body such as DWAF would maintain the national “Rivers Database”, with
each province or authority having their own regional “Rivers Database”. Although mechanisms of
updating the “Rivers Database” at provincial and national levels are being explored, the exact process
of data transferral has not yet been finalised. However, it is likely that the “Rivers Database” will link
up with the Water Management System (WMS) which is being developed by DWAF and will
ultimately house all water resource related data. Discussions are currently underway with the database
architects of the WMS to determine the most efficient means of transferring data between the “Rivers
Database” and the WMS.
1.4
User control and data security
It will be the responsibility of each regional authority or "champion" to facilitate and regulate the
capture of data at regional level. All authorities applying the RHP (or components thereof) and who
1
Rivers Database
wish their data to contribute to the national database will need to work through their regional
"champion". For security purposes all users will need to register and will be allocated a user name and
password. All users will be able to view the data, but only the "owner" of a particular data-set will be
able to edit data that has been added under their user name. A site transaction form tracks changes
made to site level components of the database and enables a detailed record to be kept of such
changes.
1.5
Layout of the manual
This manual has been written as a guide to users of the Rivers Database application. It is divided into
the following sections:
• General structure of the database, viewing and editing data, and adding new data
• Querying the database
• Technical Information
Terms used in this manual are described in the glossary appended (Appendix 1). Additional details are
available in the manual written for the ecological reference condition project (Dallas 2000) and on
which the Rivers Database is based.
1.6
Current status of the Rivers Database
This manual accompanies the Rivers Database currently distributed on CD. Most components of the
database are finalised with the exception of the riparian vegetation and fish indices. Both of these
indices require testing and further refinement.
It is likely that additional components such as
hydrological and geomorphological indices may be incorporated in subsequent phases of the Rivers
Database. Further development on the reference condition aspect of the database is also planned for
future phases.
2.
STRUCTURE OF THE DATABASE AND VIEWING DATA
The Rivers Database is divided into two broad components as follows:
• Editing and viewing the data - this facilitates the entry and viewing of data via a hierarchical
Tree View.
• Querying the data - this allows for the extraction of data already entered in the database.
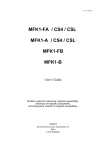
A schematic diagram of the database structure and the various components is given in Figure 2.1. The
different forms from each section are displayed in Appendix 2. Note: Neither the riparian vegetation
or fish components are populated with real data and forms displayed are therefore merely fictitious
examples.
2
Rivers Database
Tree View: Rivers: "parent" and tributaries
Adding River(s) and
subregion(s) via the Tree View
Subregions: geomorphological zones
Sites
Adding a new site via the Tree
View or Section A: General
Information
Section A
• General information
• Geo-reference
• Location details
• Physical characteristics and
geomorphology
• Site transaction record
• Photographs
(Assessed during initial site
visit and checked during
each subsequent site visit)
Section B
• Catchment and land -use
• Water quality impacts
• Channel condition
• Channel morphology
• Present status
Reference condition (data from relevant
components are compared with historical
or reference data)
• Riparian vegetation
• Invertebrates (still to be established)
• Fish (separate fish database, only for
Mpumalanga region at present)
(Assessed during each site
visit)
Section C
• General
Ø Site Visit information
Ø Stream dimensions
Ø Substratum composition
• Invertebrates
Ø Biotopes
Ø Invertebrate taxa
Ø Habitat assessment
• Water chemistry
Ø Chemistry - general
Ø Chemistry - data
• Riparian vegetation
Ø Riparian zone description
Ø Vegetation cover
Ø Invasion of riparian zone
Ø Riparian vegetation species list
Ø Abundance and ranking of riparian
vegetation
Ø Riparian vegetation index
• Fish
Ø Fish sam ples
Figure 2.1 Schematic diagram showing the various components included in the Rivers
Database
3
Rivers Database
2.1
Viewing information in Tree View
The purpose of the Tree View is to allow one to efficiently navigate to rivers, their tributaries and
subregions or segments either to view sites on rivers already entered into the database or to add new
sites or new site visits to existing sites (see section 2.2.3).
The Tree View is divided into two sections as follows:
• all existing “parent” rivers and their tributaries are viewed in the left hand block.
• subregions and site codes are viewed in the right hand block.
2.1.1
Filtering the Tree View
A searching function has been added to the Tree View to enable the user to navigate and locate sites
within a specific region (political, bioregion, ecoregi on), catchment (secondary or quaternary),
subregion, hydrological type, rainfall region, or by river, site code, map reference or DWAF gauging
station code.
Once a selection has been made using the drop -down lists in the fields "Filter trees for" and "=", all
parent rivers and associated tributaries in which the selected criteria are met and returned. Matching
sites are returned and may be viewed in the drop -down list "Matching sites".
The navigational
sequence to the selected site is displayed and inclu des: the name(s) of all rivers above it in the
hierarchy together with the subregion in which the site occurs.
To clear the selection criteria, click the "Clear" button and refresh screen to view all rivers.
2.1.2
1)
Navigating to sites
Click the cross to the left of the river name of a given “parent” river to expand the tributaries of
that river. (To reverse the operation and contract the tributaries click on the minus sign next to
the appropriate river).
2)
Select the desired sort order of rivers and their tribut aries by selecting either the “alphabetical”
order or “sequential” order which sorts the rivers and their tributaries either alphabetically or in
the order of occurrence from "source to sea" along a parent river respectively.
3)
Continue clicking the cross to the left of each river in the hierarchy until the desired river has
been found.
4)
Highlight the desired river by clicking on the river name.
5)
Select the desired “navigational” sequence by selecting either “subregions” or “segments” at the
bottom left hand side of the tree view. All subregions (or segments, depending on the desired
sequence selected) of the highlighted river will automatically appear in the block on the right of
the Tree View in order of their occurrence from source to its confluence with t he parent river.
4
Rivers Database
6)
Click the cross to the left of the subregion (or segment) to view the site codes (see section 2.2. for
an explanation of the site codes) of all existing sites in that subregion (or segment).
7)
Double click the site code or click “go” to view detailed site information. This action opens
“Section A”, “Section B” and “Section C” which houses all site and site visit information.
8)
Click "Refresh" to return the screen to the original form of the Tree View.
9)
Click "Rebuild Tree" to incorporate chan ges made to the Tree View.
10) Click "River/Subregion" to add, edit or delete rivers or subregions (see Section 2.1.3)
11) "Picklist Options" is an administrative function whereby drop -down lists etc. are edited. Access
to this is strictly controlled.
12) Click "Exit " to close the database.
2.1.3
Adding a new river, subregion or segment
With the exception of the Mpumalanga region, users will need to enter information at the river,
subregion and segment (if appropriate) level before entering information for specific sites.
The
process of adding a new river and subregions or segments to the Tree View is explained in this
section.
To add a new river:
1)
Click "River/Subregion"
2)
Type in the name of the new river to be added. If it is a tributary of a river which already exist s
in the database then select the relevant river from a drop -down list which appears when the down
arrow to the right is selected. If the new river is a parent river then the “is a tributary of” box is
left blank but the “parent river” box is ticked by c licking in the relevant box.
3)
Select the secondary catchment code into which that river falls from the existing dropdown list.
4)
Type in the order of occurrence of a river if it is a tributary of another river in the “Sort Order”
box. E.g. if the Klip River i s the 23rd tributary of the Blyde River by counting tributaries from the
source of the Blyde River to its confluence with the Olifants River, then type 23 in this box. If
the sort order is unknown, then the rivers and their tributaries are automatically s orted
alphabetically in the tree view.
5)
Click the “Add Record” button.
To add a new subregion:
1)
Choose the river to which a new subregion will be added from the drop -down list at the top of the
form.
2)
Once the details of that river appear on the form select the “subregions” tab.
5
Rivers Database
3)
Select a subregion from the drop-down list and enter its sequence from the source of the river.
The same subregion may be added more than once with a different number indicating the
sequence each time.
4)
If the subregion is unknown, se lect the “unspecified” option from the drop -down list.
5)
Click the “Add Record” button.
To add a new segment:
Repeat the steps outlined above for adding a new subregion to the tree view but select the “segment”
tab. Once all new details have been added, r eturn to the Tree View by clicking the “Close Form”
button.
2.2
Site and Site Visit information
Sections A, B and C of the Rivers Database form the main body of the database for the inclusion of
information which both characterises a site and provides informa tion for the assessment of the
condition of a river at a particular site at a given time. The field datasheets for the collection of
biomonitoring data form the basis for the design of this component of the Rivers Database and a full
description of some of the information included in the database has been taken from the associated
field manual (Dallas 2000). Each section varies with regard to the nature of information entered and
the frequency of assessment as follows:
TYPE OF INFORMATION
FREQUENCY OF ASSESSMENT
SECTION A
Site specific information
Entered during or after the first site visit
SECTION B
Site visit information
Entered during the first site visit and is
checked and reassessed on each site visit
SECTION C
Site visit information
Assessed during each site visit
The basic layout for all 3 sections is as follows:
• The active bar with separate buttons for “Section A”, “Section B”, “Section C” and the Reference
Condition and Admin sections. Click these buttons to list the forms which are inclu ded within
each section.
• A header with information about the current user, the organisation to which the user is affiliated
and the "owner" of the data. The site code selected in the Tree View is displayed, and the user is
able to switch to another site within the same river and subregion by selecting the appropriate site
from the drop-down list. To show all sites, regardless of river or subregion, click the "Show All
Sites" button. In the case of Sections B and C, the date of the site visit is displaye d. In Section C,
a drop-down list enables Section C to be divided into subcategories, namely general, invertebrates,
6
Rivers Database
water chemistry, riparian vegetation and fish. Details of each section are given in sections 2.2. to
2.2.4 respectively.
2.2.1
Adding a new site
A new site can be added by clicking the "Add Site" button which appears in both the Tree View form
and the General Site Information form of Section A. To add a site on the Tree View form:
1)
Navigate to the river and subregion into which a site needs to b e added (see section 2.1.3).
2)
Click the "Add Site" button. This opens the general site information form.
3)
Type in the new site code.
4)
Click the "Add Site" button on the form. This will update the site code in the header and
populate the drop-down list with the new site code. Note: If the "Add Site" button is clicked
again at this point, the site code box will be cleared and a new site may be added to the same
river and subregion.
5)
The river name is confirmed by checking the drop -down list of river name, together with the
secondary catchment code, tributary of, subregion and tributary sequence. All additional site
information is added into the appropriate text or numeric fields directly or using the drop -down
lists.
6)
To add a site to a different river or subregion, return to the Tree View form, navigate to the
appropriate river and subregion and repeat this process.
2.2.2
Viewing data in Section A
Section A contains five forms which display general information about a site and a sixth form which
summarises any chang es made to this information. The following procedure outlines the steps taken
when viewing data for a specified site code selected in the Tree View.
1)
Click “Section A” to view all forms which apply to this section.
2)
Double click “General” to open the gener al site information.
3)
Repeat step 2 to view each separate form in the section.
Details pertaining to each form are given below. The process by which a new site is added is described
in section 2.2.1.
(a) General Site information
General site information spans two forms, and includes information which characterises the site. Each
field is described briefly below and the reader is referred to the glossary or Dallas (2000) if additional
clarification is required. In all cases data are either added directly as t ext or by selecting from the
appropriate drop-down list. Note: The red asterisks indicate those components which must be entered
as a minimum requirement.
7
Rivers Database
Site Code: A standardised unique site code is allocated to each site. A duplicate site code will no t be
accepted and will require the user to modify the site code by changing the location component of the
code when adding a new site. (The date on which the site code was entered automatically appears
below the site code once it has been entered for the first time).
River name: name of river assessed. This will appear automatically in the correct box based on the
navigation sequence followed in the tree view. By clicking the drop -down list to the right, the river
name, together with the secondary catchme nt code, tributary of, subregion and tributary sequence will
appear. This allows one to check whether the correct river has been entered in this box.
Note: This is
particularly important in cases where river names are common and rivers of the same name ma y occur
in different catchments.
Once the river name has been entered, the information described above
automatically appears on the right hand side of the form.
Subregion: This appears automatically since the user has to specify the subregion within whi ch the site
falls. An "unspecified" option is given if the subregion is not known.
Segment: Based on the subdivision of rivers into homogenous stretches in terms of fish habitat as defined
by Kleynhans (1999).
Description: details of site location, e.g. farm name, road, bridge, village, etc.
Map Reference: either 1: 250 000 or 1: 50 000 .
Site Length: length of river being assessed.
Political Region: one of seven regions.
BioRegion: one of 18 bioregions as identified in Brown et al. (1996).
Ecoregion: one of 18 as identified in Kleynhans et al. (1998).
WQ Region: one of seven water quality regions as identified in Day et al. (1998).
Secondary Catchment Code: DWAF secondary drainage region.
Catchment Area: area (km 2) of the secondary catchment.
Quaternary Catchment Code: DWAF Quaternary drainage region.
Comment: Any additional information which may be pertinent to the site which has not been included
in the forms.
Source Distance: distance from source of river estimated from 1: 50 000 map.
Contour Range: altitude range within which site falls estimated off 1:50 000 map (50 m intervals).
Stream Order: order estimated of 1: 50 000 map using the Strahler method.
Slope/gradient: calculated as the vertical difference between contours (m) divided by horizontal distance
between contours, estimated from 1: 50 000 map.
Geological Type: based on Vegter's (1995) simplified lithostratigraphic units.
8
Rivers Database
Vegetation Type: based on Low and Rebelo's (1996) potential natural vegetation of South Africa,
Lesotho and Swaziland.
Hydrological Type: based on the following types: perennial, seasonal or ephemeral.
Rainfall Region: season in which the majority of rain falls.
DWAF Gauging Station: the presence of a DWAF gauging station is indicated. If present, the greyed
boxes becomes active and the DWAF Code and estimated distance upstream or downstream of the site
is recorded.
Associated System: important systems associated with the site or river (e.g. wetlands or estuaries),
together with distance from the site, are shown.
(b) Geo-reference
Three different formats for longitude and latitude co -ordinates are available in the database. i.e.
conventional format (degree/minutes/seconds), GPS format (degrees and minutes+seconds) and GIS
format (decimal degrees). Data may be entered via any format by selecting the desired format after which
the other formats are calculated automatically. Records are stored by clicking the “Save” button.
(c) Location Detail
This form provides a text box for entering a relatively detailed description of how to find the site and
whose land must be traversed to access the site. Provision is made to indicate whether or not a permit
is required, where to obtain the permit, whether or not a key is needed and where to obtain the key.
This is a descriptive form to fa cilitate future access to the site for monitors who may not have visited
the site previously.
(d) Physical Characteristics and Geomorphology
Five components, namely "Valley Form", "Lateral Mobility", "Channel Form", "Channel Pattern" and
"Channel Type" are in cluded. Selection and descriptions of these geomorphological components are
taken from Rowntree and Wadeson (1998) and are summarised in the field manual for the collection
of biomonitoring data (Dallas 2000). One or more "Valley Form" features may be pr esent, but only
one type is selected for "Lateral Mobility", "Channel Form", "Channel Pattern" and "Channel Type".
When the "Channel Type" selected is alluvial, the "Dominant Type"(s) of substratum are recorded.
(e) Site Transaction
The “site transaction” fo rm is an inventory of all changes that are made to the information entered in
Section A. When a user changes information that was entered on a previous occasion in Section A, the
user is asked to confirm whether the change should be made. If the user con firms these changes then
9
Rivers Database
the database automatically updates the Site Transaction form with these changes. The following
information is recorded on this form: the field which has been changed, the information that was
initially recorded for that field, the new information added to that field, the date that the changes were
made, the user who is responsible for making the changes and the organisation to which the user is
affiliated. In this way, a complete record is kept of any changes that may be made to th e site
information. Although the information included in Section A is site specific and therefore should not
change over time, it is important to allow changes to be made for e.g. if land ownership changes or
improved GPS technology allows more accurate geo-referencing of a site.
(f) Photographs
Photographs of the upstream, downstream or bankside views or specific features at the site are stored
on a website which is linked to the database. Each photograph has a unique “Photographic ID Code”
which consists of basic site code plus the letter “u” for upstream, “d” for downstream, "b" for bankside
or “s” for a specific feature and then the site visit date. The date is specified using the convention
"ddmmyyyy" to indicate the day, month and year.
2.2.3
Adding site data to Section A
Most information is added directly into the text boxes or using the drop -down lists. Specifics are as
follows:
Adding general site information data:Populate each field from the drop -down lists or by typing in
the free text boxes.
Adding geo-reference data: Select the format of the co-ordinates to be entered (i.e. conventional,
GPS or GIS) and enter the values in the appropriate fields.
Adding location details:Add text directly to the appropriate fields. Certain free text boxes only
become active when the appropriate tick boxes are ticked, including the "Permit Required", "Permit
Acquired" and "Key Needed" fields.
Adding physical characteristics and geomorphology data:Add "Valley Form Detail" using the
"Add Valley Form" drop-down list. Several valley forms may be added for each site. Use drop -down
lists to add other information. If "Alluvial with Dominant Types" is selected as the "Channel Type",
then "Dominant Types" becomes active and is populated using the drop -down lists in the "Add
Dominant Types". Several types may be added for each site.
Site transaction: This form is automatically updated and cannot be edited.
Adding photographs: The area or feature photographed is selected from a drop-down list and the
“spool number” and “photo nu mber” are entered to a keep a record of user-specific photographs. A
unique “Photographic ID Code” is allocated to each photograph. This ID Code consists of the Site
Code combined with the first letter of area photographed combined with the date of the sit e visit (e.g.
X2SABI-HOXAN-U-28111999).
10
Rivers Database
2.2.4
Viewing Site Visit data in Section B
Section B consists of five forms which include fields that relate to catchment condition and channel
features.
Components of this section are checked and reassessed if necessar y and therefore the
information is site visit specific, i.e. the information is related to a specific sampling date. The
following procedure outlines the steps taken when viewing data for a specified site code and date.
1)
Click “Section B” in the active bar to view all forms which apply to this section.
2)
To view site visit data, select a "Site Visit" from the drop -down list on the right hand side of the
form.
3)
Click “Catchment and Land Use” in the active bar to view details for the first form in this
section.
4)
Repeat step 3 to view details for each separate form within Section B. The details of each form in
Section B are summarised below.
(a) Catchment and Land Use
This form includes features regarding the condition of the local catchment and land -use within the
catchment. The presence and extent of each land -use "within" and "beyond 5m" is given with specific
details included if relevant.
(b) Water Quality Impacts
Water quality impacts are linked to the land -uses specified in the previous form. Each impact present
at a site is listed and rated according to the extent of the impact on the receiving water body. If the
impact originates from a point source it is ticked in the associated box.
(c) Channel Condition
In-channel and bank modifications are listed, the extent of their impact both upstream and downstream
of the site is rated, and the distance of each modification upstream or downstream specified. Four
erosional and four depositional features are listed and rated according to the extent of each at the site.
This is modified from a report of Rowntree and Ziervogel (1999) and is detailed in Dallas (2000).
(d) Channel Morphology
Additional information related to channel morphology may be added in this form. It is based on a
diagram from Kemper (1999) and is particul arly relevant for interpretation of the riparian index. The
presence of each cross-section feature is noted for both the left and right banks by clicking the
appropriate box.
(e) Present Status
Scores allocated to each instream and riparian component are dis played and "Instream Status",
11
Rivers Database
"Riparian Status", "Overall Status" are automatically calculated and displayed together with the
associated "Present Status Class". Details of the methodology are given in Dallas (2000).
2.2.5
Adding Site Visit data to Section B
To add a new site visit, click the "Add New Site Visit" button and enter the date in the following
format "dd/mm/yy". You are prompted to confirm the new site visit date, which when confirmed
enables one to add additional site visit data for that date. A dditional data are added as follows:
Adding catchment and land-use data: One or several land -uses are selected from the drop-down list
and the extent of each “within 5 m” and “beyond 5 m” rated depending on the level of the impact. Any
specific information about each entry can be included in the free text box titled “detail” on the form.
Adding water quality impactdata: The impact of each land -use is automatically added to this form
from the previous section. It may be altered if necessary via the drop -down list. The extent of impact
is rated and whether or not the impact is from a point source is indicated by clicking the appropriate
box. Any specific comments about the impacts can be included in the free text box.
Adding channel condition data:In-channel and bank modifications are selected from the drop -down
list, the extent of each upstream and/or downstream of the site rated and the distance upstream or
downstream specified. Comments about the impact can be included in the free text box next to each
modification. The extent of each erosion and deposition feature is rated from the drop -down list.
Adding channel morphology data:The presence of each cross-sectional feature is noted for both the
left and right banks by clicking the appropriate box.
Adding present status data: Scores for each factor used in the calculation of present status are added
directly in the numeric field (use "tab" to move down the column). The Instream Status, Riparian
Status, Overall Status and Present Status Class are calcula ted automatically.
Note: When adding a second site visit, the user is notified that all fields in section B for the new site
visit are automatically updated using the previous site visit's data. If certain aspects have changed
since the last site visit, for example land -use, the user must go to the appropriate form and field and
update the record.
2.2.6
Viewing Site Visit data in Section C
(a) General
• General Site Visit Information
This form provides information pertaining to each site visit or sampling occasion . All users may view
the data but only the Owner may edit the data linked to the particular site visit. Each field is described
briefly below and the reader is referred to the glossary or Dallas (2000) if additional clarification is
required. Details of each field are given below.
12
Rivers Database
Note: If data in this section is collected on different dates but which is still considered to be part of the
same site visit, then the earliest date should be used. For example, if SASS data was collected on
06/06/1999 and fis h data on 07/06/1999 both should be entered as 06/06/1999. This is necessary to
enable subsequent queries to be linked to common site visits.
Date Visited: date (dd mmm yyyy) of site visit
Time: time ( hh.mm) of assessment
Assessor: name of assessor
Organisation: organisation to which assessor is affiliated
Water Level: water level at time of sampling (dry, isolated pools, low flow, moderate flow, high flow,
flood)
Rainfall in the last 4 days? Indicates the presence and extent of any rainfall event prece ding the site
visit
Water Turbidity: the colour and degree of visibility is indicated (clear, discoloured, opaque or silty)
Vegetation Sampling Instructions: details of the exact position at which the riparian vegetation
assessment was conducted
Canopy Cover: extent of canopy cover (open, closed, partially open)
Impact on channel flow: rate of the impact on channel flow of coarse woody debris or any other
obstruction. Specify if the source is local or upstream and add additional comments in the text box.
• Stream Dimensions
Macro-channel, active channel and water surface widths, left and right bank heights, and minimum,
maximum and average depths of the available deep - and shallow -water biotopes are given. The type
of deep- or shallow-water biotope can also be detailed if necessary. Details of the methodology are
given in Dallas (2000).
• Substratum Composition
The relative percentage contribution of each substratum type (bedrock, boulder, cobble, pebble,
gravel, sand and silt/mud) is given for the bed and ba nk. These substratum types, together with an
additional substratum type, soil, is assessed for the riparian zone (Kemper 1999). The degree of
embeddedness is also provided. Details of the methodology are given in Dallas (2000).
(b) Invertebrates
• Biotopes
Biotopes have been included at two levels, namely SASS biotopes (e.g. SIC, SOOC, marginal
vegetation, aquatic vegetation, gravel, sand, mud/silt) and specific biotopes (e.g. cobble riffle, bedrock
rapid, backwater, Palmiet, etc.).
The presence of each is recorded and relative percentage estimated
for each level. Details of the methodology are given in Dallas (2000).
13
Rivers Database
• Invertebrate Taxa
SASS data for invertebrates is given at either the site visit level or the biotope level depending on
whether biotopes were sampled separately or not. To view taxa from each biotope, the appropriate
biotope is selected from the drop-down list. A "<Site Visit>" option is included to view all SASS data
at the level of site visit. SASS4 Score, Number of Taxa and ASPT are calc ulated automatically for all
taxa, as are the scores for air-breathing taxa.
• Habitat Assessment
Three habitat assessments are included, namely Habitat Assessment Matrix (HAM), Habitat Quality
Index (HQI) and Invertebrate Habitat Assessment System (IHAS).
Only one of these per site visit is
given and scores for each are calculated below the entry data. Sub -components of the IHAS score are
given in the various tabs at the bottom of the form. Details of the methodology are given in Dallas
(2000).
(c) Water Chemistry
The water chemistry information is divided into two sections, namely chemistry -general and
chemistry-data.
"General" includes sampling process details and information related to water
condition, whilst "data" tabulates actual chemistry data coll ected in the field or analysed in the
laboratory.
• Chemistry-general
Fastest flow? Were the meters positioned in the fastest flowing section of the stream.
Samples collected? Details of the filtering, freezing, preservation and analysis method.
Macrophytes and algae: The presence and percentage cover of each is estimated and additional
details such as species is recorded in the comment text field.
• Chemistry data
All chemistry data for the site visit is given together with the standard units of measurement a nd
values.
(d) Riparian Vegetation
The riparian vegetation component has been developed by Kemper (1999) and details pertaining to the
method are described in Kemper (1999). Six forms constitute the riparian vegetation component of
the database. Details for viewing information within each form are as follows:
• Riparian Zone Description
Vegetation cover and width of the riparian zone on the left and right bank of the active channel and
islands are recorded together with disturbances to the riparian zone rate d in terms of severity. Extent
of Vegetation Cover (EVC) scores 1 and 2 are calculated automatically.
14
Rivers Database
• Vegetation cover
Percentage contribution of grasses, sedges, reeds, shrubs and trees, as well as bare ground, is given,
together with the relevant distr ibution pattern of each, i.e. clumped, continuous, scattered, sparse. The
reason for the current distribution pattern, relative to the natural condition at the site (i.e. land -use) and
the "problem" score or rate (low, medium, high and very high), is also recorded.
A Structural
Intactness (SI) score is automatically calculated according to a comparison matrix between the present
day and reference state (see Section 2.2.8 for a description of the reference condition component).
• Vegetation invasion
The extent of the invasion of the riparian zone (bank, bed, island and bars) by exotic, reeds and
terrestrial vegetation is recorded. An exotic Percentage Cover of Indigenous Species (PCDI) and a
terrestrial (PCDI) score are calculated.
• Vegetation Species List
A list of species present is given together with the type (tree, reed, shrub, forb or sedge) and status
(exotic, introduced or native). For each species both the number of individuals in each height class
and the abundance measured (low, medium, high and v ery high) for each height class is recorded.
• Vegetation Abundance
The dominant vegetation types are ranked on the basis of either recruitment, biomass or abundance.
The Recruitment of Desirable Indigenous species (RDI) is rated.
• Vegetation Index
All scores calculated for the vegetation section are displayed, including EVC, PCDI, SI and RDI.
From these sub-scores the Riparian Vegetation Index (RVI) is calculated.
(e) Fish
The fish component has been developed by Kleynhans (1999) and details pertaining to the method are
described in Kleynhans (1999). Currently one form is available for this component.
• Fish samples
Data are given for different combinations of depth and flow, including deep slow, shallow slow, deep
fast and shallow fast. Fish species collected (using established fish codes) via each of three sampling
methods (cast net, seine net or shock apparatus) are recorded, together with sampling effort. The
extent of aquatic vegetation, overhanging vegetation, stream substratum and undercut bank and root s
is rated.
15
Rivers Database
2.2.7
Adding Site Visit data in Section C
(a) General
• General Site Visit Information
Data is added directly in the text boxes or using the drop -down lists. Date and time formats are
specified (see section 2.2.6) and tick boxes are used for some fields.
• Stream Dimensions
Values for each of the fields may be added directly within each field and additional comments may be
added. The type of deep- or shallow-water habitat may also be detailed.
• Substratum Composition
An estimate of the relative percen tage contribution of each substratum type (bedrock, boulder, cobble,
pebble, gravel, sand and silt/mud) is entered for bed and bank cover. An additional substratum type is
available for the riparian zone cover, namely soil. The degree of embeddedness is selected from the
drop-down list.
(b) Invertebrates
• Biotopes: To enter data:
1)
Click the boxes of the SASS biotopes present.
2)
Add a percentage for each. Note the total should be 100%.
3)
Position the mouse on the SASS biotope for which specific biotope data need to be added.
4)
Select specific biotopes from the drop-down list and enter the percentage of each.
• Invertebrate Taxa: To enter data:
1)
Select a biotope or "Site Visit" from the drop-down list.
2)
Click on the first field in the taxon column.
3)
Type the first letter of the invertebrate taxon and then select the appropriate taxon from the drop down list.
4)
Press tab to move the cursor to the abundance column and enter abundance (A, B, C or D).
5)
Repeat until all taxa have been entered.
6)
Repeat step 1 to 5 for the next biotope if appropriate.
7)
Click "Site Visit Taxa" if site visit scores are desired.
• Habitat Assessment: To enter data:
1)
Select habitat assessment method (HAM, HQI or IHAS) from the drop-down list.
2)
Click "Add Habitat Assessment".
3)
Position mouse in the first field under the "Score" column and enter value.
4)
Tab down and click "Calculate" to return score(s).
16
Rivers Database
5)
To remove an assessment, select the appropriate habitat assessment from the drop -down list and
click "Remove Habitat Assessment".
(c) Water Chemistry
• Chemistry-general
To add data click the appropriate boxes and enter data into the associated text boxes. Note that some
fields only become active once the preceding box has been clicked.
• Chemistry data: To enter data:
1)
Position the cursor in first field of the chemistry column.
2)
Type the first letter of the chemistry code and scroll down until the correct variable is
highlighted.
3)
Press tab to move the cursor to the value column and enter value.
4)
Tab to comment field and add text if necessary.
5)
Tab to chemistry and repeat process until all chemistry variables have been added.
(d) Riparian Vegetation
Data are entered using the appropriate drop -down lists, text boxes and tick boxes.
(f) Fish
Data are entered using the appropriate drop -down lists, text boxes and tick boxes.
2.2.8
Reference Condition
Reference or historical conditions are in the process of being developed for each of the major
components, namely invertebrates, riparian vegetation and fish. They are all in different stages of
development but all aim to facilitate comparisons between monitoring sites and a baseline or
benchmark data set derived in a component -specific way. Thus far, a historical fish database has been
developed for the Mpumalanga region (Kleynhans 1999) and a riparian component has been included
(Kemper 1999).
3.
QUERY CENTRE
The Query Centre is a tool which allows the end -user to construct user-defined queries by combining
the available attributes (fields) of registered data components (pre -defined queries), sort and/or
aggregate and set criteria on these attri butes to control the data that is returned by the query.
3.1
1)
Step-by-step Instructions on using the Query Data Designer
To create a new query, click on “New Query”.
17
Rivers Database
2)
Select a 1Data Joiner. To return data relevant to a site only, select “site -linked data”. To return
data relevant to a site visit or to both a site and a site visit, select “site visit -linked data”. Click on
“Next” to view all the available components that are linked via the selected data joiner.
3)
Select one or more components (at least one component should be a General Component) in the
list of "Available Components" by first selecting the component and then clicking on the Right
Arrow to place your selection in the “Select Components” list box. To unselect any component,
highlight that componen t in the "Select Components" list box and click on the Left Arrow.
4)
Select the fields that are desired to appear in the query from the "Available Fields" list box. This
is achieved by first selecting all the desired fields and then by clicking on the Down
Arrow to
place the selection in the "Select Fields" list box. To unselect any field, highlight the field in the
"Select Fields" list box and click on the Up Arrow.
Note: Data from only one of the specific components can be included in the final query.
5)
Set the order in which the fields should appear in the query by selecting a field and moving it up
or down by clicking on the Up or Down Arrow.
6)
The data in the query can now be sorted or aggregated. To sort the data, select the field by which
the data is to be sorted, click on Down Arrow of the first drop-down box to see the available
options, i.e. None, Asc (Ascending), Desc (Descending). It is possible to sort according to more
than one field. To aggregate the data, select the field by which to apply an a ggregate function
and click on the Down Arrow of the second drop-down box to see the available options, i.e. Avg,
Count, Sum, etc.
7)
It is possible to supply different aliases (column headings) for each of the selected fields.
8)
To set 2criteria for a query, e.g.. “only return records for province of Mpumalanga”, select the
appropriate provincial field from the Available Fields list box, and click on “Edit”.
• Choose the field again on the keypad, e.g. [Province]
• Choose an operator e.g. =
• Click on “Refresh” under the Values List Box to see the distinct, available data items, and
choose a value e.g. Mpumalanga by clicking on “Add”.
• You should now see “[Province] = ‘Mpumalanga’
If data are being aggregated, the user has the option to filter the returned data based o n the value of
this aggregation (e.g. to only return sites where the average pH for all collected data >7.5).
The use of different operators and wildcards is described in section 3.2.
9)
The Query Data Designer will now indicate that all the necessary data re quired to generate the
query has been collected.
1
2
The Data Joiner defines a common link between the different data components that have been defined.
The conditions that control which records to display in a query; the words or values used to determine the d ata
that appears in a data list.
18
Rivers Database
10) Click on "View Results" to run a spot check on the resulting data. If no data is returned, an error
may have occurred during the specification of criteria. The user may return and re -specify
criteria in th e query.
11) Click on “Finish” to view your "Query Result" in a query datasheet within the Microsoft Access
Application.
12) Go to “File”, then “Office links” to link the query results to either Microsoft Word or Microsoft
Excel for futher manipulation.
An exampl e of running a query is outlined in Appendix 3.
Query Notes
1)
Because great care has been taken to ensure that no inadvertent duplication of data occurs during
the querying process, certain queries may take a very long time to complete. Such cases should
be reported to the technical support.
2)
Additional query components can then be generated to improve the performance of the query. A
good example of this is the difference in performance that can be obtained by querying against
the specific component (A) that returns invertebrate data in rows (many taxa per site visit), versus
the component (B) that returns one record of invertebrate data per site visit (each taxon cross tabulated into a column). For example: returning chemistry data per chemistry code, with avg,
min, max, and count of value, when setting criteria simultaneously against data from the
invertebrate component: i.e. where Taxon = "Aeshnidae". The query against component B
completes in a fraction of the time that component A does.
3.2
Setting criteria
3.2.1
Operators and wildcards
Below is a short explanation of the different operators that can be used to set criteria:
AND
This key is normally used to test whether two or more conditions are true
i.e.[RiverRegion] = 'North West' AND 'North' this will retu rn all records where the
requested data can be found in both regions;
BETWEEN
This key will return all fields which have values between those specified for that
criteria i.e. [Chem Value] BETWEEN '5' AND '8' and includes both 5 and 8;
OR
This key is nor mally used to test which conditions are true i.e. [RiverRegion] =
'North West' OR 'North' OR 'East' this will return all records where the river can
be found in any one of the regions;
19
Rivers Database
LIKE
This key is normally used to compare two strings i.e. [RiverNa me] LIKE
'Limpopo' will return all records for Rivers with that name;
NOT
This key can be used with LIKE to exclude certain strings from the search
[RiverName] NOT LIKE 'Limpopo' will return records for all rivers with names
that are not ‘Limpopo’;
<>
This key works in the same way as NOT LIKE and means that something IS NOT
EQUAL TO something else i.e. [RiverName] <> 'Limpopo' will return all rivers
except for those associated with 'Limpopo';
=
This key is used to select one value or item i.e. [RiverNam e] = 'Limpopo' will
return all records for the ‘Limpopo River’(compared with the use of “IN”);
IN
This key is used when searching for more than one item. All selected items should
be between square brackets using inverted commas, and separated by commas i.e.
[RiverName] IN ['Limpopo','Vaal','Orange'] will return all records for the rivers
with these names (compare with the use of “=”);
<, >
These keys are used to return all records where the specified field has values or
items either “smaller than” or “ greater than” a given value or an item where the
records are sorted on a numerical or alphabetical basis respectively.
i.e.
[RiverName] < 'Limpopo'. This will return all river names starting with any letter
below than L in the alphabet.
The use of wildcards to return fields :
Whereas most programmes use the “*” key to indicated a wildcard, Microsoft Access relies on the
“%” key to set wildcards. Therefore in order to return all records for river names starting with “A”, set
the criteria as follows: [Rive rName] LIKE 'A%.
3.2.2
More about Criteria
Please note that it is possible to set criteria on more than one field and on fields that are not displayed
in the query result.
20
Rivers Database
Specifying criteria enables the user to:
• Find records that meet one criteria and/or a nother criteria for the same or different fields
• Find records containing values between, greater or less than, equal to, or not equal to specified
values
• Find records with values that start or end with certain characters or words, or contain certain
characters or words
• Find records that do not match a value
• Find records that contain a value, not blanks (Null values)
• Find records that do not contain a value
• Find records that contain one value from a list of possible values
• Limit records involved in a calcula tion
Feedback, in writing, on technical aspects of the application, use of the Query Centre, and technical
documentation of these features will be welcomed by the technical support for the database (see
Section 4.4).
4.
TECHNICAL INFORMATION
4.1
Software and Hardware Requirements
• Operating System: preferably Windows NT 4, Windows 2000. Windows 95/98 are also
supported.
• Memory: minimum of 64 MB RAM.
• Software: Microsoft Office Professional 97, with service release 2b.
• Note: deploying the application under MS Off ice Professional 2000 is not supported at the
moment.
• Minimum Screen Resolution: 800 x 600.
• Regional Settings: Ensure that your short date format, in Control Panel: Regional Settings is set to
display an acceptable date format, e.g. dd/mm/yyyy.
4.1.1
Application Architecture
The rivers database application consists of two main Microsoft Access database files: rivers.mdb,
containing the majority of the user -interface components (the ‘front -end’), and rivdat.mdb containing
the actual stored data tables (the ‘back-end’).
The Query Centre is shipped as a separate file
(qryctr.dll) which is invoked from within the front -end and is an independent component object,
created using Visual Basic.
21
Rivers Database
4.2
Installing the Rivers Database application
1)
Insert the CD
2)
Start Windows Explorer
3)
Browse to the CD, change folders to the ‘ActiveBarSetup’. Double-click on Setup.exe. Follow
the instructions, and accept all defaults (this installs a custom ActiveX control used by the rivers
application)
4)
Run setup.exe in the ODEsetup folder (this ins talls the main Microsoft Access front -end file and
supporting files)
5)
Run setup.exe in the Query Data Designer folder (this installs the Query Centre COM files, and
MDAC 2.1)
6)
Copy the Data file from the Data File folder to c: \riverdbase, or to another convenient location
(please note where you place the file, e.g. on a central share on your network)
7)
From Windows Explorer, Right -click on the rivdat.mdb file, click on properties, and uncheck the
read-only property.
8)
Install Service Pack 2b which is an update of the Microsoft Office 97 installation. If Service
Pack 1 has not been installed previously, it will be necessary to install this first. These files can
be found under the folders ‘\Support\Off97\Sr1\Sr1patch\’and ‘\Support\Off97\Sr2b\’.
Please note that if you need to reboot your PC at any stage in the process (e.g. to update certain files
on your system), it is necessary to restart the appropriate setup program that was busy running.
4.3
Starting the Rivers Database Application
1)
Click on Start: Programs: Riv ers: Rivers.
2)
The application will prompt the user to browse to the folder containing the data file. This prompt
will appear every time at start -up, if the application cannot find the data file (e.g. if you placed
the file on a network drive and you have lo st your drive mapping, if your network is down, or if
you have physically moved (as opposed to copied) the rivdat.mdb file to a new location).
3)
Log in by choosing your organisation from the list, and using your supplied username.
4)
Click on login.
5)
Enter password.
4.4
Synchronising and replicating the database
The Rivers Database has been developed in such a way that several users are able to add data to their
version of the database (rivdat.mdb). Once modified, these individual copies of the database need to
be incorporated into the Master File by the Central Authority (provisionally Southern Waters) so that
global updates of the database can then be distributed to users. This process is termed replication and
sychronisation.
22
Rivers Database
4.4.1
Replicating or backing up the database
Within the application there is a utility to create a backup replica of the application. It is very
important that the data file is restored from a backup replica (see Replication Manager). If the data
file becomes corrupted, it is important to re place the file with the last good backup replica.
If you compact a replica that is corrupted, it will lose its replicable status (and Design Master status if
it's the Design Master). Compacting a corrupted replica causes the replica to return to a normal , nonreplicated database. You will not be able to transfer any new data in any easy way into the master file.
Creating a Backup Replica
1)
Select ‘Replication Manager’from ‘Rivers Function’on the Menu Bar.
2)
Click on ‘Create a Backup Replica’.
3)
Select a folder in which to store the new replica in.
4)
Click OK.
This backup replica ("rivdat.mdb") serves as a local backup as well as a copy that will subsequently be
sent to the Central Authority for synchronising with the Design Master.
4.4.2
Creating a replica to send to the Central Authority
The following procedure should be adhered to prior to sending the modified database to the Central
Authority.
• Synchronise your database with your backup replica.
1)
Select ‘Replication Manager’from ‘Rivers Function’on the Menu B ar.
2)
Click ‘Synchronize with a backup Replica’(see previous section).
3)
Select the folder in which the replica is found.
4)
Click OK.
• Compact the data file.
1)
Select ‘Replication Manager’from ‘Rivers Function’on the Menu Bar.
2)
Click ‘Compact Database’.
• Compress the data file using a compression utility such as WinZip 7 (supplied on the installation
CD).
• If you do not have a CD-writer, you will have to use compression with the disk -spanning option
(e.g. onto formatted 3.5 inch stiffies).
• Send the compressed file to Southern Waters (an FTP site will be available later where the
compressed data file can be placed – instructions to follow).
23
Rivers Database
The Central Authority will, on receipt:
1)
Uncompress your file.
2)
Run a number of checks on the replica you have sent.
3)
Synchronise your changes into the Master File.
When all participating replicas have been received by the Central Authority and applied to the central
Master File, the Central Authority will:
1)
Compact the master file twice.
2)
Compress the file.
3)
Create a CD containing th e replica of the Master File.
4)
Send it to the users.
4.4.3
Synchronising a user replica with the central Master File
Each user will synchronise their replica of the Rivers Database with the Central Master File on receipt
of the CD.
1)
Create a backup replica (see previous section).
2)
Uncompress the master file from the supplied media (DO NOT OVERWRITE your data file!).
3)
Synchronise your data file with this master file.
4)
You will now have all updates made by other users in addition to changes made to your own
data.
4.5
Troubleshooting tips
Novell networks
One problem could be that the client computer is running Windows or Windows NT® and using the
Novell Client. If so, then load the Microsoft Client. If the Microsoft Client is installed, then make sure
to get the SR1 patch for Windows 95, which includes an updated version of the Microsoft Client for
Novell Networks. On the network side, be sure the number of record locks per connection is set to
10,000 and the Max record locks that the server can handle is set to 200,000.
Database corruption problems
Microsoft Access does not handle data collisions well. Make sure your network is not faulty because
this will cause your database to crash and to become corrupted. Once a replica is corrupted, it cannot
participate in synchron ization.
Should I use backup utilities with my replicas?
You don't really need to – replication itself is a good mechanism for creating backups. Use another
replica member on another physical drive or computer to back up your replicas. Synchronize on a
24
Rivers Database
regular basis to ensure a minimum amount of downtime should you ever need to restore from the
backup replica. Should a replica member become corrupted or lost due to media theft or failure,
simply create a new replica from another replica in the replica s et.
Replication
You cannot create a backup replica using the button on the Replication Manager form if you have
Office 2000 installed. Please contact technical support for information on a workaround.
4.6
Utilities
Winzip 7.0
1)
Start Windows Explorer.
2)
Enter directory containing Winzip70.exe and execute program (by double -clicking on
winzip70.exe).
3)
Click “Setup” button to begin installation.
4)
Select a folder in which Winzip will be installed and click OK.
5)
After agreeing to licensing select Winzip Classic and t hen Express Setup.
6)
Click Finish to complete installation.
CuteFTP
This utility is supplied to eventually enable you to fetch and place your transfer replicate onto an FTP
site on the central authority’s Internet FTP server.
5.
USER SUPPORT FOR THE RIVERS DATABASE
Version 1 of the Rivers Database has been distributed to all provincial champions and other relevant
authorities known to be doing biomonitoring work in South Africa. It is likely, during the course of
using the database, that problems and suggesti ons for improvement will be noted.
Users are
encouraged to send comments to one of the two following organisations.
Southern Waters Ecological Research & Consulting
Soft Craft Systems cc (Technical Support)
Contact: Justine Fowler or Helen Dallas
Contact: Pierre Janssens
Fax: +27 21 650 3887
Fax: +27 21 713 0977
Tel: +27 21 650 3633
Tel: +27 21 713 0976
Email: [email protected]; [email protected]
email: [email protected]
25
Rivers Database
6
REFERENCES
Brown, C.A., S. Eekhout, & J.M. King. 1996. National Biomonitoring programme for riverine
ecosystems: Technical considerations and protocol for the selection of reference and
monitoring sites. NBP Report Series No 3. Institute for Water Quality Studies, Department of
Water Affairs and Forestry, Pretoria.
Dallas, H.F. 2000. Ecological reference condition project: Field-manual.
General Information,
catchment condition, invertebrates and water chemistry. NAEBP Report Series No 10. Institute
for Water Quality Studies, Department of Water Affairs and Forestry, Pretoria, South Africa.
Day, J.A., H.F. Dallas & A. Wackernagel. 1998. Delineation of management regions for South
African rivers based on water chemistry.
Aquatic Ecosystem Health and Management 1: 183-
197.
Kemper, N.P.
1999.
RVI: Riparian Vegetation Index. Draft report to the Water Research
Commission. WRC Project No. K5/850
Kleynhans, C.J. 1999. The dev elopment of a fish index to assess the biological integrity of South African
rivers. Water SA. 25(3):265-278.
Kleynhans, C.J., M. Silberbauer & N. Kemper. 1998. Preliminary ecoregion level 1 classification for
South Africa. Draft document for the Institute for Water Quality Studies, Department of Water
Affairs & Forestry.
Low, A.B. & A.G. Rebelo.
1996. Vegetation of South Africa, Lesotho and Swaziland. Dept. Of
Environmental Affairs & Tourism, Pretoria.
Matthews, R.A., A.L. Buikema, J.Jr Cairns & J.H. Rodgers 1982. Biological monitoring. Part IIA.
Receiving system functional methods, relationships and indices. Water Research 16: 129-139.
Reynoldson, T. B., R. H. Norris, V. H Resh., K. E. Day & D. M. Rosenberg. 1997. The reference
condition: a compari son of multimetric and multivariate approaches to assess water -quality
impairment using benthic macroinvertebrates. J. N. Am. Benthol. Soc. 16(4): 833-852.
Roux, D.J. (Ed.) 1999. Development of procedures for the implementation of the National River
Health Programme in the province of Mpumalanga.
Draft report to the Water Research
Commission on the project "Development of procedures for the Regional implementation and
maintenance of the national River Health programme.
Rowntree, K.M. & R.A. Wadeson 1998. A hierarchical geomorphological model for the classification
of selected South African rivers. Final report to the Water Research Commission.
Rowntree, K.M. & G. Ziervogel. In prep. Geomorphological Index: User's field guide. Draft report
for the River Health Programme, Department of Geography, Rhodes University.
Vegter, J.R. 1995. Geology map of South Africa with simplified lithostratigraphy for geohydrological
use. (Simplified lithostratigraphy digitised by A Havenga, Council for Geosciences,
1994).
Water Research Commission TT 74/95 .
26
Rivers Database
Appendix 1. Glossary of terms used in this manual
“Navigational” sequence
The hierarchical sequence of Parent Rivers, their tributaries,
subregions and sites can be sorted either alphabetically, or
according to the sequence of occurrence from source to sea. The
navigational sequence is therefore the "map" of the route to
navigate to a site.
Biomonitoring
“The systematic use of biological responses to evaluate (primarily
anthropogenic) changes in the environmen t with the intent to use
this information in a quality control programme” (Matthews
et
al.1982).
Criteria
The conditions that control which records to display in a query;
the words or values used to determine the data that appears in a
data list.
Data "owner"
The person responsible for either site or site visit information
which is entered into the database. The “ownership” of data is
automatically assigned to the user who enters the data into the
database. Information can only be altered or changed when the
user and owner are the same.
Data “user”
The person who is logged on to the Rivers Database according to a
predetermined user name and password.
Data Joiner
The Data Joiner defines a common link between the different data
components that have been defined.
Design Master
The copy of the database that acts as a template for the other
replicates. Changes to the database structure of the design master
will automatically be propagated to the replica during the process
of synchronisation.
Drop-down list
A predetermined list of options for a text box which limits the user
to select one of these text options.
Ecological Reference Condition
This is the condition that is representative of a group of "least impacted" or minimally disturbed habitats organised by
physical, chemical and biological attributes (Reynoldson
selected
et al.
1997). It acts as a bench mark with which monitoring information
can be compared thereby providing a means of estimating the
degree of degradation or deviation from natural conditio ns.
Free text box
A box which allows the user to type whatever text is desired within
that box. See drop-down list for a comparison.
27
Rivers Database
Geological-type
Simplified lithostratigraphic units as defined by Vegter (1995).
Hydrological-type
Can be one of three types based on the occurrence of flowing water
in the system i.e. perennial: flows continuously all year round;
seasonal: flows annually at a predictable time of year, but ceases to
flow for some time each year; and ephemeral: flows periodically
every few years (Dallas 2000).
Parent river
The central or common river into which all rivers within a
catchment flow.
Quaternary catchment code
A code for each quaternary drainage region as classified for South
Africa by DWAF.
Replica
A replica is a copy of the databa se. A replica is a member of a
replica set and can be synchronized with other replicas in the set.
Changes to the data in a replicated table in one replica are sent and
applied to the other replicas and the Design Master.
Replication
Replication is the pro cess of creating and synchronizing replicas in
separate locations. Replication ensures that changes made to the
data of a database are sent and applied to all the members of the
replica set.
Secondary catchment code
A code for secondary drainage regions as classified for South
Africa by DWAF.
Segment
A length of river which is regarded as uniform in terms of the
integrity of habitat for fish as defined by Kleynhans (1999).
Site level components
All information which is specific to a site but does not vary over
time. i.e. information which is spatially defined rather then
temporally defined.
Site visit components
All information which is specific to the date of collection of such
information. i.e. information about a site which may vary over
time.
Subregion
The geomorphological zones of river channels based on channel
gradient as defined by Rowntree et. al. (1996).
Synchronization
The process of updating a pair of replicas: all modifications and
additions to data are exchanged.
Tick boxes
A box which is ticke d when a positive action is recorded.
Tree-View
A form showing the hierarchical sequence of Parent Rivers and
their triburaries as well as their subregions and site codes.
Vegetation-type
The potential natural vegetation of South Africa, Lesotho and
Swaziland according to Low and Rebelo (1996).
28
Rivers Database
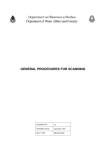
Appendix 2. Screen dumps of the different forms in each section of the Rivers Database
Tree-View
Rivers Menu Bar
Parent rivers and their tributaries
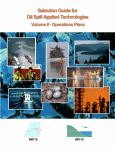
Section A
Show all sites
Delete Site
29
Rivers Database
Section A. Cont.
Close Form
Active Bar
30
Rivers Database
Section A. Cont.
31
Rivers Database
Section A. Cont.
32
Rivers Database
Section B
33
Rivers Database
Section B . Cont.
34
Rivers Database
Section B . Cont.
35
Rivers Database
Section C. General
36
Rivers Database
Section C. General
Section C. Invertebrates
37
Rivers Database
Section C. Invertebrates Cont.
38
Rivers Database
Section C. Chemistry
39
Rivers Database
Section C. Riparian Vegetation
40
Rivers Database
Section C. Riparian VegetationCont.
41
Rivers Database
Section C. Riparian Vegetation Cont.
42
Rivers Database
Section C. Fish
43
Rivers Database
Appendix 3: A step-by-step example of a query setting specific critera.
Requirements: Provide SASS4 scores, ASPT scores and the Number of taxa for all site visits on all
rivers which fall within secondary catchmen ts B1, B2, and B3, where the pH is greater than 4. This
query must reveal geo reference information so that the sites can be displayed in GIS. Table A3.1
gives an indication of the data that should be returned in the final query output to satisfy these
requirements.
Table A3.1
Site code
The desired query output for the specific query outlined in this section.
Sampling
Date
Secondary
catchment code
GIS Longitude
GIS Latitude
SASS4 Score
ASPT
Number of Taxa
Once the query centre has been opened, the steps below are followed to extract the data required to
meet the specifications oulined above for this example.
1
Select the correct data joiner. In this example, the “site visit-linked data” is selected because
both site specific data (i.e. the site code, secondary catchment code and the longitude and
latitude) and site visit specific data (i.e. sampling date, SASS4 score, ASPT and total number
of taxa as well as information about the pH ) are needed to satisfy the requirements.
2
The following components are selected:
• General Site Information (contains site code, secondary catchment code)
• General Site Visit Information (contains sampling date)
• Geo reference (contains GIS Longitude and GIS Latitude)
• SASS scores (contains SASS4 score, ASPT and Nr of families)
• Chemistry (to select the specific criteria, in this case, pH>4)
Click “next”
3
The specific component with fields to be displayed in the final query output is selected
because only fields from one specific component can be returned in a given query. In this
case, select “SASS scores”.
Click “next”
4
The actual fields to be returned in the query are then selected from the components selected in
2 above i.e.:
• Site code;
• Secondary catchment code
44
Rivers Database
• GIS Longitude
• GIS Latitude
• SASS4 Score
• ASPT
• Nr of families
Click “Next”
5
The fields do not need to be aggregated or sorted therefore click “next”
6
This example specifies that data for secondary catchments B1, B2 and B3 must be returned
and that data for site visits where the pH is greater than 4 must be returned. Therefore we must
set criteria on:
• Secondary Catchment Code
• Chemistry code
• Chemistry value
Go to “Secondary Catchment” and click “edit”. This opens the “Field criterion” form, which allows
you to select the secondary catchment codes for which data should be returned. In this example we
want data from sites in secondary catchments B1, B3 and B4 therefore:
• click on the [Secondary Catchment Code] button;
• Click the “IN” key;
• Click the “refresh” key to show all available fields;
• Using the keys on the right select B1, B3 and B4 so that the text in the criterion box
reveals the following:
[Secondary Catchment Code] IN [‘B1’, ‘B3’, ‘B4’]
• Click “OK”
Go to “Chem Code” and click “edit”. This opens the “Field criterion” form, which allows you to select
the specific chemistry parameter for specifying criteria. In this case, pH.
• Click on the [Chem code] button;
• Click the “=” key;
• Click the “refresh” key to show all available fields;
• Select “pH” so that the text in the criterion box reveals the following:
[Chem code] = ‘pH’
• Click “OK”
Go to “Chem Value” and click “edit”. This opens the “Field criterion” form, which allows you to
select the pH range or limitations for which data should be returned in the query output. In this case,
data should only be return ed for sampling visits where the pH was greater than 4.
• Click on the [Chem Value] button;
• Click the “>” key;
45
Rivers Database
• Type 4 (note: no inverted commas are necessary when setting criteria using numbers) so
that the text in the criterion box reveals the following:
[Chem Value] > 4
• Click “OK”
7
Once all the criteria have been set, click “next”.
8
To view the query results, click “View Results”.
Note: If you are dissatisfied with the query output and would like to make changes then click
“back”. Once you select “finish”, it is not possible to back-track through the steps in the query
and you will be required to start the query building process from the beginning.
9
Finally, click finish to reveal the final query output. The final query output should be similar
to the structure indicated in Table A3.1.
10
Go to “file” in the main menu bar and select “MS Office Links” then select “Analyse it with
MS Office”. MS Office will automatically open with a new file containing the data from the
query output where it can be saved as an MS excel file and analysed further.
46