1
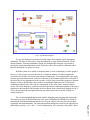
Fig. 4. System Block Diagram.
To view the displayed waveforms in actual ranges, these signals require appropriate
calibration. The latter is achieved by using the arithmetic or logic function features. For the
chosen channels, from the mathematics option, the multiplication function was selected to
provide the required multiplication factor. This factor can be fine-tuned by calibration with a
physical instrument, for greater accuracy.
With the system now capable of acquiring data, re-scale it and display it on the graph, it
however, is not set up to carryout this task in a continuous manner. In order to display the
waveforms in real time, the system must function continuously. To accomplish this, once again
from the pop up functions menu, selection of the Structs & Constants option allows selection of
the while loop as one appropriate for this system. A while loop executes the program or diagram
inside it as long as the Boolean value wired to its conditional terminal is true. It checks the
conditional terminal value at the end of each iteration. If the value is true, another iteration
occurs. The whole diagram is enclosed inside the loop and the conditional terminal of the loop is
connected to the terminal of the Boolean switch as shown in the system block diagram in Fig. 4.
This is the switch on the front panel that turns the whole system on or off and which gives
control to the user.
7
Page 3.387.7
The execution highlighting function enables debugging and removing bad connections.
The answers to some of the questions that arose when configuring the NIDAQ were found by
browsing the National Instruments Internet site. Now the system was ready for real time data
acquisition and instrumentation. The front panel and block diagram screens can be flipped back
and forth by pressing < ctrl > and < f > key simultaneously or by selecting ' show panel / Show