1
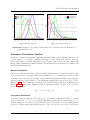
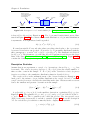
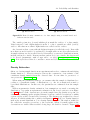
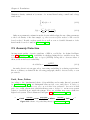
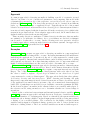
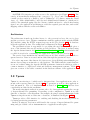
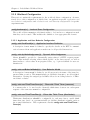
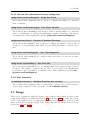
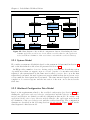
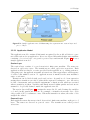
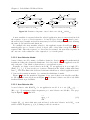
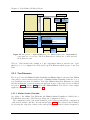
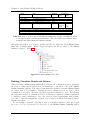
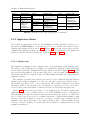
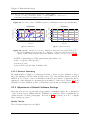
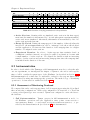
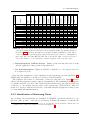
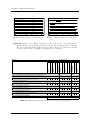
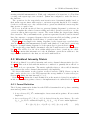
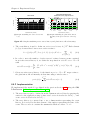
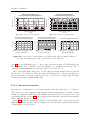
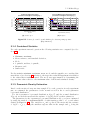
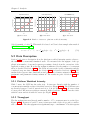
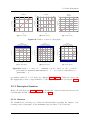
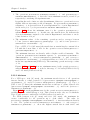
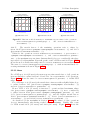
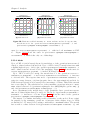
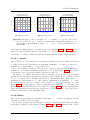
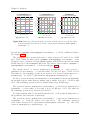
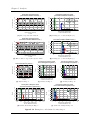
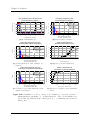
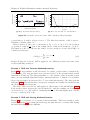
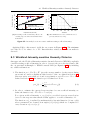
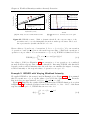
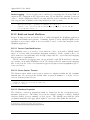
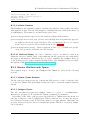
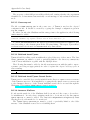
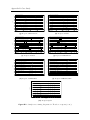
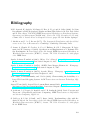
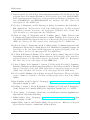
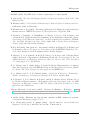
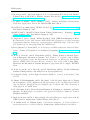
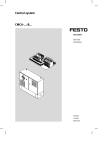
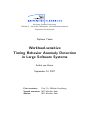
1.
1.6
Stretch Factor
1.2
1.4
1.
1.6
Stretch Factor
8
10
1.4
1.2
Stretch Factor
6
4
2
150
150
50
60
200
0
10
30
40
50
60
vs. vs.
WorkloadUsers
Intensity
Response
Time
Variance
Standard
Deviation
Response
Time
Variance
andand
Standard
Deviation
persistence.sqlmapdao.OrderSqlMapDao.insertOrder(...)
presentation.CatalogBean.viewItem(...)
WorkloadUsers
Intensity
vs. vs.
Response Time
VarianceTime
and Standard
Response
SkewnessDeviation
persistence.sqlmapdao.OrderSqlMapDao.insertOrder(...)
service.CatalogService.getItem(...)
8
8
30 100 40
150
50
60
(a) PWI 0.03–60.90.
200
5
1.5
2.0
Standard deviation (ms)
4
2.5
5
4
3
2
0
1.0
1
0
6
Variance (ms)
Skewness
4
2
100
20
0
50
20
Users
Platform workload
intensity
1.0
40
60
80
Standard
1.5 deviation
2.0(ms)
Standard deviation (ms)
6
4
2
10
Workload Intensity vs.
Response Time Skewness
service.CatalogService.getItem(...)
variance
standard deviation
2.5
variance
variance
standard
deviation
standard
deviation
0 0
200
Users
20
Platform workload intensity
3
30 100 40
10000
Variance (ms)
2000
0
Variance (ms)
4000
6000
8000
20
0
40
60
80
Standard deviation (ms)
100
12000
ers vs.
nce and Standard Deviation
alogBean.viewItem(...)
100
50
20
Users
Platform workload
intensity
Skewness
10
Users
2
0 0
200
1
150
1.0
1.0
Chapter 5 Analysis
100
0
0
10
50
20
30 100 40
150
50
Users
Platform workload
intensity
(b) PWI 0.03–60.90.
60
200
0
10
20
30
40
50
60
Platform workload intensity
(c) PWI 0.03–60.90.
Figure 5.12: Platform
response
time variance of operations
29
49 workload intensity vs.
presentation.CatalogBean.viewItem(...)
and persistence.sqlmapdao.OrderSqlMapDao.insertOrder(...) as well as skewness of operation service.CatalogService.getItem(...).
Figure 5.12(b) shows the curves for persistence.sqlmapdao.OrderSqlMapDao.←insertOrder(...). Figure 5.8(c) shows the curves for the mean, median and mode stretch
factors for this operation.
5.2.3.9 Skewness
With the exception that the operation presentation.CartBean.addItemToCart(...) has
the skewness −6.06 for PWI 0.22 increasing to a positive value for PWI 0.84 and
service.CatalogService.getItem(...) which has a skewness of −0.11 in Experiment 1,
in each case all skewness values are positive. Hence, the distributions are generally
right-skewed or become right-skewed, respectively.
All skewness curves have a shape which is similar to the one shown for the operation
service.CatalogService.getItem(...) in Figure 5.12(c). The curves have two peaks
for PWI values 2.22 and 38.81. Unless the above-mentioned exceptions, the computed
skewness values are in a range between 0.11 and 8.55.
5.2.3.10 Outlier Ratio
For all operations the ratio of normal outliers is between 0 % and 8.5 % with averages
between 2.3 % (presentation.OrderBean.newOrder(...) ) and 4.9 % (service.←OrderService.getNextId(...) ). The ratio of normal outliers shows no correlation with
the workload intensity.
At least one experiment exists for each operation showing no extreme outliers.
Maximum ratios are between 0.96 % (persistence.sqlmapdao.OrderSqlMapDao.←insertOrder(...) ) and 20.44 % (service.CatalogService.getCategory(...) ). The
operations persistence.sqlmapdao.OrderSqlMapDao.insertOrder(...) and service.←OrderService.insertOrder(...) have the lowest average values of extreme outliers with
values 0.1 % and 1.94 %. The remaining operations have an average ratio of extreme
78