1
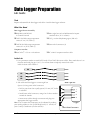
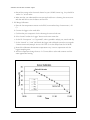
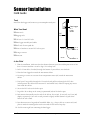
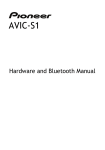
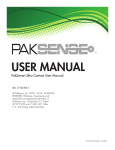
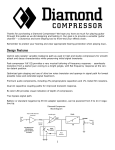
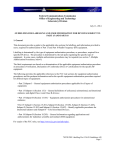
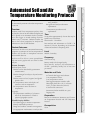
Purpose
To continuously measure soil and air temperature
at one site
Overview
Student Outcomes
Time
Set-up takes approximately 4 hours but may be
spread over several days.
Data transfer - 10 minutes
Data analysis and submission to GLOBE – 30
minutes to 2 hours, depending on the amount
of data and students’ computing skills
Frequency
GLOBE® 2005
Air Temperature Protocol and Soil Temperature
Protocol.
Prerequisites
None
Automated Soil and Air Temperature Monitoring Protocol - 1
Soil
Appendix
Scientific Inquiry Abilities
Use a data logger to measure temperature.
Identify answerable questions.
Design and conduct scientific investigations.
Use appropriate mathematics to analyze data.
Learning Activities
Students will be able to create spreadsheets
and time-series graphs and use them for data One-time set up
Battery needs to be changed yearly.
analyses.
Data transfer, analysis, and submission to
Science Concepts
GLOBE - preferably weekly, but at least once
Earth and Space Science
per month
Weather can be described by quantitative
measurements.
Materials and Tools
Weather changes from day to day and season
4-Channel data logger and software
to season.
1 air temperature sensor
Weather varies on local, regional, and global
3 soil temperature sensors
spatial scales.
Data logger/computer interface cable
Soil temperature varies with depth, soil
Watertight plastic box (~0.5 L volume)
moisture, and air temperature.
CaSO4 or other desiccant (100 mL)
Soil temperature varies less than air
4 Strain-relief connectors
temperature.
Instrument shelter installed on a post
Geography
Digging tools
The temperature variability of a location
affects the characteristics of Earth’s
Preparation
physical geographic system.
Review the Maximum, Minimum, and Current
Protocols
Students will be able to use automated monitoring
equipment to measure soil and air temperatures. Level
Students will be able to manipulate extensive Middle, Secondary
multivariable data sets.
Introduction
Students install four temperature probes; three
are placed in the soil at three different depths and
one is placed in an instrument shelter. Students
use a data logger to record readings from the
probes every 15 minutes. Students transfer the
data to their school computers for analysis and
submission to the GLOBE database.
Develop descriptions and explanations
using evidence.
Recognize and analyze alternative
explanations.
Communicate procedures and
explanations.
Welcome
Automated Soil and Air
Temperature Monitoring Protocol
Optional Automated Soil
and Air Temperature
Monitoring Protocol–
Introduction
A data logger is an electronic device that
automatically collects data at a predetermined
sampling rate. Data loggers allow scientists
and students to collect valuable environmental
measurements in remote locations. They also
collect data continuously allowing for consistent
data collection and analysis. With a data logger,
students are able to collect data during weekends
and school breaks. Data loggers can collect data
for up to 84 days without daily readings and
thermometer calibrations.
Students who use data loggers contribute
important data to a worldwide dataset of soil
and air temperatures. Scientists’ understanding
of climate has been determined by their access
to a large number of air temperature data, but
soil temperature datasets are not as extensive.
Students using data loggers will be making
significant contributions to these datasets and
to our understanding of soil science.
Teacher Support
Materials Management
The procedures described in this protocol are
specific to a particular brand of data logger and
its temperature probes and software. They may be
adapted to other equipment, as long as they meet
the GLOBE data logger specifications. If teachers
and students plan to use different equipment, they
should contact the GLOBE Help Desk to learn
how to adapt this protocol to their equipment.
The essential elements of this protocol, which
must remain the same regardless of the equipment
model, are the placement of the temperature
probes and the +/-0.5 °C precision and accuracy
of the temperature sensors.
An Onset Computer HOBO® 4-channel external
data logger is used to record air and soil
temperatures at an Atmosphere Study Site every
15 minutes on the quarter hour. The Onset HAtype sensors have a range of -40 to 100˚ C and
an accuracy of 0.5˚ C. This works well for most
surface and near-surface applications. This data
logger has 4 channels. For consistency, the data
logger must be connected as follows:
Ch.1 -Air Temperature;
Ch.2 -5 cm depth;
Ch.3 -10 cm depth;
Ch.4 -50 cm depth.
Condensation can damage the data logger so
it needs to be kept in a watertight container
free of high humidity. A plastic box with a tight
sealing lid containing a desiccant, such as CaSO
4 , works well to absorb moisture and protect
the logger.
Students may assemble their own watertight
box. If they choose to do this, they must purchase
a set of strain relief connectors (refer to step
2, in the Data Logger Preparation Lab Guide).
Students and teachers can make requests for
these connectors with the GLOBE Help Desk (U.S.
schools) or to with their Country Coordinators
(all schools outside the U.S.).
GLOBE® 2005
Automated Soil and Air Temperature Monitoring Protocol - 2
Soil
For protection, the watertight data logger box
should be kept out of direct sunlight and rain. The
best place to install the soil data logger is inside a
GLOBE instrument shelter. Students dig or auger a
hole on the equator ward side (sunny-side) of the
instrument shelter mounting post and place the
probes at depths of 5 cm, 10 cm, and 50 cm. Data
collected from soils in non-shaded locations are
preferred. On their site definition sheets, students
should comment on the amount of shade that the
soil receives during the year.
Students launch or initiate the data collection by
following the Data Logger Launching Lab or Field
Guide.
Advance Preparation
Students should read the following sections in
the BoxCar Pro® v.3.5+User’s Manual: Installation,
Launching HOBO® H8 loggers, Reading out data,
Viewing your data, and Exporting data.
Students should install the data logger and
sensors according to the instructions in the
Sensor Installation Field Guide.
The science content for this protocol is the same
as that for the Maximum, Minimum and Current
Air Temperature Protocol and the Soil Temperature
Protocol. Refer students to these sections for more
background information.
After collecting data, students re-launch and
install the data logger in the instrument shelter
by following the Data Logger Launching Lab
or Field Guide and the Data Logger Installation
Field Guide.
Students prepare their data for reporting and
submit them to GLOBE by following the Data
Manipulation and Submission Lab Guide.
Data should be transferred from the data logger
in the field and sent to the GLOBE database every
1-2 weeks. Students should backup and save
their .dtf raw data logger files.
The data logger may be unplugged and brought
inside to download the data, but it is also possible
to take a laptop computer or portable data
caddy to the field and avoid disconnecting the
logger.
Questions for Further Investigation
How do soil and air temperatures vary throughout
the day?
How are soil temperature and air temperature
related?
How are soil temperatures at different depths
related?
How does soil texture affect soil temperature?
For influencing the timing of budburst and other
phenologic changes in your area, are temperature
averages or extremes more important?
GLOBE® 2005
Automated Soil and Air Temperature Monitoring Protocol - 3
Soil
Appendix
How are changes in soil and air temperature
affected by soil moisture?
Learning Activities
Students should complete the Sensor Bias Test
before they begin collecting data as detailed
in the Calibration and Lab Tests Lab Guide.
According to the Guide, students complete a
Full Range Calibration and report it to GLOBE.
The calibration and lab tests verify that the unit
is working properly and provide an opportunity
for students to practice using the logger before
installing it in the field.
Students download the stored data from the
data logger and transfer them to a computer by
following the Data Collection Lab Guide.
Protocols
Students should complete the instrument
assembly and software installation before they
begin collecting data as detailed in the Data
Logger Preparation Lab Guide.
Students place the launched data logger in
the instrument shelter and connect it to the
temperature probes by following the Data
Logger Installation Field Guide
Introduction
Data Reporting
Welcome
Site Selection
Data Logger Preparation
Lab Guide
Task
Prepare and assemble the data logger and cables. Load the data logger software.
What You Need
Data Logger/Sensor Assembly
❑ H08-006-04 HOBO H8
4-Channel External
❑ Water tight box such as Rubbermaid #1 square
❑ TMC1-HA Wide-range temperature
❑ CaSO4 or other dehydrating agent (100 mL)
sensor, 0.3 m (1 ft) cable (1)
❑ TMC20-HA Wide-range temperature
sandwich box (~0.5 L volume)
❑ Strain-relief connectors (4)
sensor, 6.1 m (20 ft) cable (3)
Computer interface
❑ BoxCar Pro® v.3.5+ or v.4.0 software
❑ PC or MAC computer interface cable
In the Lab
1. Use a permanent marker to mark BOTH ends of four TMC6-HA sensor cables. Place marks about 1 cm
from the reinforced plug tip. Use 1,2,3 or 4 lines drawn completely around each cable.
Label the short cable number 1.
HA
HA
HA
HA
2. Seal cables and data logger in a water-tight box
Water Tight Box
Option A) Using strain relief connectors:
• Drill or punch out four equally-spaced, 12 mm (1/2”) holes
in sidewall.
1
• Install strain relief connectors, using a bit of silicon sealant
around the threads.
3
• Insert sensor cables through connectors and plug into
appropriate data logger sockets.
Note: a set of strain relief connectors can be obtained by sending
your mailing address to: the GLOBE Help Desk (U.S. schools) or
your Country Coordinator (all other schools).
GLOBE® 2005
Automated Soil and Air Temperature Monitoring Protocol - 4
2
4
Logger
Strain Relief Connectors
Soil
Data Logger Preparation: Lab Guide - Page 2
OR
Option B) Using wire ties and silicon sealant:
• Drill four equally-spaced, 5 mm (1/4”) holes in a sidewall.
• Insert sensor cables through the sidewall and plug into appropriate data logger sockets.
• Fasten wire ties snugly against inside wall.
• Fasten wire ties snugly against outside wall.
• Apply silicon sealant around wires and between wire ties and hole in the side wall.
• Let dry/cure for 24 hrs.
3. Load the Boxcar Pro software on your computer. If you are using a MAC, you must download
the software from: www.onsetcomp.com/Support/2543_MacBCP.html
• Follow the software installation instructions on page 1 of the BoxCar Pro® User’s Manual.
• Connect the serial cable to a PC (9-pin, D-type) COM port OR to a MAC (8-pin, O-type)
modem port.
• Check the date and time on your computer to ensure that they are correct.
• Run c:\Bxcrpro3\Bxcrpro.exe (default location) or double click on the BoxCar Pro® icon.
Note: Newer iMAC/G3 and G4 Apple computers with USB ports require additional cable
adapters.
GLOBE® 2005
Automated Soil and Air Temperature Monitoring Protocol - 5
Soil
Calibration and Lab Tests
Lab Guide
Task
Verify that the data logger and sensors are operating normally.
What You Need
❑
❑
Data logger assembly and cables
❑
Calibration thermometer
Warm water (~50˚ C), Un-insulated cup, Ice
In the Lab
1. Record Sensor Bias – This test verifies that all four channels are recording the same
approximate temperature by collecting data for a few minutes with all four sensors grouped
together measuring air temperature. The bias or difference between each sensor should be less
than 1˚ C.
a. Plug each sensor into the appropriate
socket and place all four sensor tips
together and away from any sources
of heat (like a sunny spot).
b. Connect the logger to the serial
cable.
c. Confirm that your computer’s clock
is showing the current local time.
d. Double click on the Boxcar® icon to
run this software.
e. Select “Launch” (Crtl L) under the
“Logger” button on the main menu bar.
f. Change the file “Description” from “TEST” to “Day1bias”.
g. Change the “Interval” to “6 sec”
h. Select the “Start” button, message should indicate the “program” is being loaded.
i. Wait 3 minutes. The data logger should be working!
j. Select “Readout” (Crtl R) under the “Logger” button on the main menu bar.
k. Screen should indicate the data is being “Downloaded”, then prompt you for a filename.
The default should be Day1bias.dtf
l. Use View, Display Options to look at each temperature channel separately.
GLOBE® 2005
Automated Soil and Air Temperature Monitoring Protocol - 6
Soil
Calibration and Lab Tests: Lab Guide - Page 2
m. Record the average value from each channel in your GLOBE Science Log , they should be
within 1˚ C of each other.
n. Make sure that you understand the time axis scale and that it is showing the correct time
and date and how to save the data to an Excel file.
2. Full Range Calibration
a. Place the four temperature sensors in a half-full, non-insulated cup of warm water (~50˚
C).
b. Connect the logger to the serial cable.
c. Confirm that your computer’s clock is showing the current local time.
d. Select “Launch” under the “Logger” button on the main menu bar.
e. Set the file “Description” to “CAyymmdd”, where yymmdd is today’s year, month and day.
f. Set the “Interval” to “5 min” and launch the logger with a delayed start at the next regular
5 minute time mark (example: its now 10:17:00. So set the delayed start for 10:20:00).
g. Record the calibration thermometer temperature every 5 min in conjunction with the
loggers sampling time.
h. After the temperature change slows to 1˚ C/5 min, add ice cubes and continue until the
water approaches freezing.
GLOBE® 2005
Automated Soil and Air Temperature Monitoring Protocol - 7
Soil
Sensor Installation
Field Guide
Task
Install the data logger and sensors at your atmosphere study site.
Data Logger
Ch. 1
Inside
Shelter
What You Need
❑
Meter stick
❑
Digging tools
❑
120 cm x 2.5 cm PVC tube
❑
Data logger assembly and cables
❑
Drill with 12 mm spade bit
❑
Wire or brackets to secure PVC tube to post
❑
String or wire tie
❑
Desiccant
PVC
Tube
5 cm
10 cm
50 cm
HA
HA
HA
Ch. 2
Ch. 3
Ch. 4
In the Field
1. Plan the installation. Make sure that the distance between your box and deepest sensor is less
than 5.5 meters and that it is safe to dig a 50 cm deep hole.
2. Drill a 12 mm hole, if needed, through the bottom of your shelter, near the back.
3. Place the Data logger box inside the instrument shelter.
4. Use string or a wire tie to secure the air temperature sensor (#1) inside the instrument
shelter.
5. Feed your 3 long cables through the 12 mm hole and pull them through the PVC tube
(which protects the cables from excessive UV and animal bites). Plan on keeping any excess
wire inside the shelter.
6. Secure the PVC tube to the shelter post.
7. Dig a hole 50 cm deep on the sunny (equatorward) side of the shelter post.
8. Push sensors horizontally into the side of the hole at 50 cm (#4), 10 cm (#3), and 5 cm (#2)
depths, respectively. Use a nail or steel pin with a slightly smaller diameter to pilot these
holes if the soil is hard.
9. Pour desiccant into a bag made of breathable fabric (e.g., cheese cloth or a cotton sock) and
place it inside the watertight box so the air inside the box will be kept dry.
10. Seal the water tight box containing the data logger.
GLOBE® 2005
Automated Soil and Air Temperature Monitoring Protocol - 8
Soil
Data Logger Launching
Lab or Field Guide
Task
Launch your data logger for collecting diurnal soil and air temperature measurements.
What You Need
❑
Data logger disconnected
from the four sensor cables
❑
Data Logger Data Sheet
❑
Computer: 386 or better, 4 Mb RAM,
Windows 3.1 or later, 1 available COM (serial) port
In the Lab or Field
1. Make sure that your computer’s clock is reading the correct local time.
2. Run the BoxCar® software
3. Connect the HOBO® 4-Channel External logger to the serial cable using the bottom and
largest plug.
4. Select “Launch” (Ctrl L) under “Logger” button on the main menu bar.
5. You should see or select the following:
a. Interval (duration) = 15 minutes (84 Days),
b. Measurement: Channels 1-4 recording Temperature (both oF and oC). Without the sensors
connected, the values will be different but should be relatively constant.
c. Battery Level: full (replace the battery when level falls below 30%)
6. Select “Advanced Options”.
7. You should see or select the following:
a. Wrap-around when full (unchecked)
b. Delayed Start (checked) Set to expected start time; Use this feature to start sampling times
on the quarter hour, ex: XX:00:00, XX:15:00, XX:30:00, or XX:45:00. Select “am” or “pm”.
8. Select “Enable/Disable Channels”.
9. For Channels 1-4, you should see of select the following:
a. -40 oF to +212 oF [TMC6-HA]. (checked)
b. Select “Apply”
10. Select “Start”.
GLOBE® 2005
Automated Soil and Air Temperature Monitoring Protocol - 9
Soil
Data Logger Installation
Field Guide
Task
Install the launched logger in the instrument shelter.
What You Need
❑
❑
Launched data logger
❑
Data Logger Data Sheet
Desiccant
In the Field
1. Open the door of the instrument shelter and uncap the empty data logger box.
2. Make sure that the logger and cable plugs are dry. Replace the desiccant as is necessary.
3. Carefully plug each sensor cable into the appropriate data logger channel. Make sure that
each plug is fully inserted and seated in its jack.
a. Plug cable #1 into jack #1 (air temperature sensor)
b. Plug cable #2 into jack #2 (5 cm sensor)
c. Plug cable #3 into jack #3 (10 cm sensor)
d. Plug cable #4 into jack #4 (50 cm sensor)
4. Carefully seal the water-tight data logger box and place out of the way in the instrument
shelter.
5. The data logger is now collecting data. We recommend you download the data weekly
when school is in session or at least monthly during longer vacations.
GLOBE® 2005
Automated Soil and Air Temperature Monitoring Protocol - 10
Soil
Data Collection
Lab Guide
Task
Download the data stored in your data logger to your computer.
What You Need
❑ Data logger disconnected from
❑ Data Logger Data Sheet
the four sensor cables
❑ Computer: 386 or better, 4 Mb RAM,
Windows 3.1 or later, 1 available COM (serial) port
In the Lab
1. Make sure that your computer’s clock is reading the correct local time.
2. Run BoxCar® software.
3. Connect the HOBO® 4-Channel External logger to the serial cable using the bottom and
largest plug.
4. Select “Readout” (or Ctrl R) under the “Logger” button on the main menu bar.
5. You should see:
a A pop-up box will indicate that the software is searching for the HOBO® data logger.
b. A pop-up box will indicate that the data are being downloaded.
c. A warning will be given if the data logger and shuttle clocks are unsynchronized.
d. Battery Level: replace the battery after saving the data if the battery level falls below 30%.
e. A “Save As” box.
6. Rename the data file (.dtf file) and save it. It is recommended to use a file name like
“SSYYMMDD” where,
a. “SS” is a two character school or site code and “YYMMDD” are the two digit values for year,
month and day (i.e., 010315) for the date that you downloaded (READOUT) these data
from your logger. Note: this BoxCar® software is limited to 8 character filenames.
b. Make sure to select or take note of the output data directory.
7. Take time to preview the data using BoxCar’s graphing capabilities.
GLOBE® 2005
Automated Soil and Air Temperature Monitoring Protocol - 11
Soil
Data Manipulation and
Submission
Lab Guide
Task
Convert the data in the appropriate format for reporting to GLOBE.
What You Need
❑
Computer: 386 or better, 4 Mb RAM,
Windows 3.1 or later,
1 available COM (serial) port
❑
Excel or other spreadsheet software
❑
BoxCar® software
❑
Data Logger Data Sheet
In the Lab
You should send in your data to GLOBE as often as you download your logger, which should be
approximately weekly to monthly.
1. Double click on the BoxCar® icon to run this software.
2. Under “File” select “Open” and open the BoxCar® file (.dtf) that contains the data you are
preparing to submit to GLOBE
3. Under “File” select “Export” and then “Excel” or the appropriate spreadsheet choice (or just
select the “Excel” icon on the shortcut toolbar).
4. The “Export Set-Up” box will appear
5. Select all four channels that contain Celsius measurements by selecting each channel
marked “Temperature [*C]” in the “Units” box (be sure to deselect the first default value
which is marked “Temperature [*F]”).
6. Select “Export”.
7. Maintain the name as “SSYYMMDD.txt”
8. Select “OK”.
9. Launch Excel or other spreadsheet software.
10. Under “File” select “Open” and choose the file that contains your data (SSYYMMDD.txt).
11. Make sure to select “All Files (*.*)” under “Files of Type”.
12. Select “Open”.
13. The “Text Import Wizard” should be set to “Delimited”, “Start Import at Row 1”, “File origin
Windows (ANSI).
14. Select “Finish” directly without passing through the intermediate steps. You should see one
column of time data and four columns of temperature data with units of [*C].
15. Graph your data following the steps in Looking at the Data.
16. If you have any data points that are unquestionably bad, replace those values with a “B”.
GLOBE® 2005
Automated Soil and Air Temperature Monitoring Protocol - 12
Soil
Data Manipulation and Submission to GLOBE: Lab Guide - Page 2
17. If one of your sensors was not connected or not working, place an “X in the appropriate cells
of your spreadsheet.
18. Select the whole first row that contains the titles (by clicking on “1”) and remove it, by
selecting “Delete” under the “Edit” menu.
19. Format the whole first column that contains the time and date (by clicking on “A”) and
choose “Cells” under the “Format” menu.
20. In the pop-up box that appears select “Custom” under “Category” and under “Type” enter
yyyymmddhhmm. Hit “OK”. The date and time entries are now in the format required by
GLOBE.
21. Select columns A,B,C and insert three new columns by selecting “Columns” under the
“Insert” menu.
22. Scroll down to the last row of data.
23. Type “DLOG” in column A.
24. Enter your GLOBE School ID in column B.
25. Enter the GLOBE site type and number where the data logger is installed (atmosphere site =
ATM-dd or soil moisture site = SMS-dd; e.g., ATM-01 or SMS-01) in column C.
26. Highlight the three cells containing “DLOG”, your GLOBE school ID, and the site type and
number and select “Copy” under the “Edit” menu.
27. Highlight the first three columns in the second to last row of data and then use the
following two keystrokes to highlight all the cells in columns A-C that contain data: “End”,
“Shift Up Arrow”.
28. Select “Paste” under the “Edit” menu so that these three values are copied to the selected
area of columns A-C.
29. Select column E and insert one new column by selecting “Columns” under the “Insert” menu.
30. Format the whole fifth column (by clicking on “E”) and choose “Cells” under the “Format”
menu.
31. In the format cells “Number” pop-up box that appears, select “Text”. Move to the format cells
“Alignment” tab and select “Right” within the “Horizontal” selection box. Hit “OK”
32. Scroll down to the last roll of data, if necessary.
33. In column E, enter the UT offset between your site and the prime meridian (UT_offset =
UT_time – Local_time). This will be a constant unless there has been a local time shift (ie.
day light savings) during the period of observation. Enter this value using a ±hhmm scheme
(example: +0400 for a 4 hour offset for the East coast of the U.S. or –1030 for a –10 hour 30
minute offset for central Australia). Note, the sign of these offsets are opposite the standard
value. Unfortunately, the coming and going of daylight savings varies by country. Please
consult local authorities as to what local time you need to make this adjustment (or visit
www.worldtimezone.com/daylight.htm)
34. Highlight the cell containing your offset and select “Copy” under the “Edit” menu.
35. Highlight the empty cell in column E in the second to last row and then use the following
two keystrokes to highlight all the cells in column E that contain data: “End”, “Shift Up
Arrow”.
GLOBE® 2005
Automated Soil and Air Temperature Monitoring Protocol - 13
Soil
Data Manipulation and Submission to GLOBE: Lab Guide - Page 3
36. Select “Paste” under the “Edit” menu so that this value is copied to the selected area of
column E.
37. Save this document by selecting “Save As” under the “File” menu.
48. Change the name of this GLOBE formatted file to “DLYYMMDD.txt” (ignore the warning
about file format generated by “Excel”) and save as a tab-delimited text file.
39. You are now ready to send your data to GLOBE by email.
40. Launch your email program without quitting Excel.
41. In the “To:” field of your message enter “[email protected]”.
42. In the “Subject:” field enter “DATA”.
43. The first line of the text of your message must be “//AA”. This tells the GLOBE server that the
lines that follow will contain data.
44. Copy and paste the nine columns of the spreadsheet file that contains your logger data:
a. Switch back to Excel or other spreadsheet and highlight the portion of the nine columns
that contain information.
b. Select “Copy” under the “Edit” menu.
c. Switch back to your email program, put the cursor on the line below the “//AA” entry in the
text portion of the message, and select “Paste” under the “Edit” menu. The whole table
should now appear in the body of the email message.
45. After you insert the table with your data, type on the last line of your message “//ZZ”. This
tells the computer that there are no more data in your message. See an example of what
your email should look like below.
46. Send the email to GLOBE.
Example of an email containing air and soil temperature data collected with a data logger
To: [email protected]
From: [email protected]
Subject: DATA
//AA
DLOG
ZZUSTEST
ATM-01
200105141600
+0400 B
B
B
B
DLOG
ZZUSTEST
ATM-01
200105141615
+0400 24.79
24.79
24.79
24.79
DLOG
ZZUSTEST
ATM-01
200105141630
+0400 24.79
24.79
24.79
24.79
DLOG
ZZUSTEST
ATM-01
200105141645
+0400 24.79
24.79
24.79
24.79
DLOG
ZZUSTEST
ATM-01
200105141700
+0400 24.79
24.79
24.79
24.79
DLOG
ZZUSTEST
ATM-01
200105141715
+0400 24.79
24.4
24.79
24.79
DLOG
ZZUSTEST
ATM-01
200105141730
+0400 24.79
24.4
24.79
24.79
DLOG
ZZUSTEST
ATM-01
200105141745
+0400 24.79
24.4
24.79
24.79
DLOG
ZZUSTEST
ATM-01
200105141800
+0400 24.79
24.4
24.4
24.79
DLOG
ZZUSTEST
ATM-01
200105141815
+0400 24.79
24.4
X
24.79
DLOG
ZZUSTEST
ATM-01
200105141830
+0400 24.79
24.79
X
24.79
DLOG
ZZUSTEST
ATM-01
200105141845
+0400 24.79
24.79
X
24.79
DLOG
ZZUSTEST
ATM-01
200105141900
+0400 24.79
25.17
X
24.79
DLOG
ZZUSTEST
ATM-01
200105141915
+0400 24.79
25.17
X
24.79
//ZZ
GLOBE® 2005
Automated Soil and Air Temperature Monitoring Protocol - 14
Soil
1. When I try to download the logger, there
is no data. What happened?
This could happen if you did not complete a
proper launch sequence prior to setting your
logger in the field. Make sure you do not try
to launch a data logger that has not been
downloaded as all the data will be lost.
GLOBE® 2005
Data Logger: a microcomputer capable of
recording and storing both time and measurement
data in the field. The only system maintenance
required is to periodically download the stored
data.
Desiccant: a substance such as calcium sulfide
which will repeatedly absorb excess humidity
after it is oven dried.
Diurnal: varying regularly throughout the day.
Energy balance: a conservative balance between
incoming and outgoing energy components
(solar, sensible heat, latent heat, soil heat) at a
point, such as the Earth’s surface.
Phase-shift: the period of a wave-like phenomena
(ocean waves, sound waves) determines how
far it is between adjacent peaks (maxima). A
phase shift occurs when two waves have the
same period but the maxima occur at different
times.
Sinusoidal: like a sine wave; many radiation
phenomena are greatest midday and least at
night.
Automated Soil and Air Temperature Monitoring Protocol - 15
Appendix
5. When do bad data usually occur?
Bad data usually occur at the beginning or the
end of your data record due to sampling while
the sensors were disconnected.
Conduction: transmission of heat (or electricity)
through a substance.
Learning Activities
4. We managed to plug our sensors into the
wrong channels. What should we do?
If you are comfortable transposing the columns
of data, you can do this in a spreadsheet
program. Otherwise, send the .dtf and .txt files
to [email protected] with a description of
the problem and I will correct it. In general, the
daily range of the data should decrease from the
air temperature to the 50 cm soil temperature.
Attenuation: to reduce in magnitude, to lessen
Protocols
3. We did not get our logger to the field site
for two days after it was launched, should we
delete the data during this time period when
we know the logger was not plugged in to our
sensors?
Never delete rows of data - we want to know when
you were attempting to collect data. However, if
you have any data that are unquestionably bad,
replace those values with a “B”. If one of your
sensors was missing or not putting out data,
place an “X” in these cells of your data sheet.
Key Definitions
Introduction
2. How do you tell if one of your sensors is not
working?
The two most common problems are a broken
wire or an open circuit, usually due to an animal
bite or because the connection between plug
and socket is not good. An open circuit will
produce a very unrealistic value, which might
vary slightly. Another warning sign is a reading
that does not change. Contact Onset or the
GLOBE help desk if you need help.
6. We have submitted air
temperature data from our data
logger for a specific day(s) but the
maximum and minimum air temperature
values for that day(s) do not appear in our
school’s data archive. Why?
If there are three or more bad or missing data
points for any 24 hour period (noon to noon),
the GLOBE server does not calculate the daily
maximum and minimum values for that day(s).
Welcome
Frequently Asked Questions
Soil