1
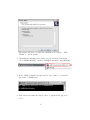
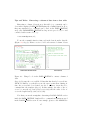
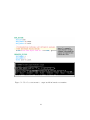
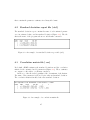
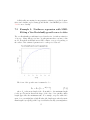
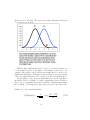
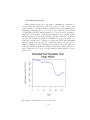
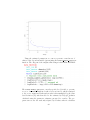
279.269
280.627
281.985
283.343
. . .
Minimum width
significance
0.0101058
0.010061
0.0100162
0.00997134
confidence limits:
level lower bound
0.9
0.95
0.975
upper bound
204.167
192.361
181.645
344.451
356.733
366.178
One sided confidence limits for the Normal approximation:
The probability is
The probability is
The probability is
0.9 that Rtemp is greater than 226.407
0.95 that Rtemp is greater than 212.012
0.975 that Rtemp is greater than 200.051
The probability is
The probability is
The probability is
0.9 that Rtemp is less than 332.121
0.95 that Rtemp is less than 347.48
0.975 that Rtemp is less than 357.086
7.3.4
Report: Markov Chain Monte Carlo (MCMC) report
(.hst)
The .hst report contains information about the MCMC analysis: the sample
sizes (specified with the -mcmc command-line option), the step size scaling
factor, the step sizes, and information about the posterior probability distribution (e.g., the mean, standard deviation, and lower and upper bounds).
For each simulated parameter, a range of values (with step sizes reported
in the ”step sizes” section of the .hst file) and their simulated posterior
probabilities is reported. Plotting the first column (parameter values) on
the x-axis and the second column (simulated probabilities) on the y-axis
can be a convenient way to make a visualization of the posterior probability
distribution.
# samples sizes
100000
# step size scaling factor
1.2
# step sizes
79