1
Wireless Blood Pressure and Pulse
Rate Monitoring Device Using
ZigBee Technology
by
Arjie Ray G. Dela Silva
Leonard M. Fernandez
Renson T. Gilo
Angeline M. Maguirang
Konica M. Supleo
A Design Report Submitted to the School of Electrical Engineering,
Electronics Engineering, and Computer Engineering in Fulfillment of
the Requirements for the Degree
Bachelor of Science in Computer Engineering
Mapua Institute of Technology
December 2009
Approval Sheet
Mapua Institute of Technology
School of EECE
This is to certify that we have supervised the preparation of and read the design
report prepared by Arjie Ray G. Dela Silva, Leonard M. Fernandez, Renson
T. Gilo, Angeline M. Maguirang and Konica M. Supleo entitled Wireless
Blood Pressure and Pulse Rate Monitoring Device Using ZigBee
Technology and that the said report has been submitted for final examination
by the Oral Examination Committee.
Dr. Blesilda M. Pantoja
Proof Reader
Dr. Felicito S. Caluyo
Design Adviser
As members of the Oral Examination Committee, we certify that we have
examined the design report, presented before the committee on December 3,
2009, and hereby recommended that it be accepted as fulfilment of the design
requirement for the degree in Bachelor of Science in Computer
Engineering.
Engr. Maribelle D. Pabiania
Panel Member
Engr. Meo Vincent C. Caya
Panel Member
Engr. Analyn N. Yumang
Chairman
This design report is hereby approved and accepted by the School of Electrical
Engineering, Electronics Engineering, and Computer Engineering as fulfilment of
the design requirement for the degree in Bachelor of Science in Computer
Engineering.
Dr. Felicito S. Caluyo
Dean, School of EECE
ii
TABLE OF CONTENTS
TITLE PAGE
i
APPROVAL SHEET
ii
TABLE OF CONTENTS
iii
LIST OF TABLES
v
LIST OF FIGURES
vi
ABSTRACT
vii
Chapter 1:
Chapter 2:
DESIGN BACKGROUND AND INTRODUCTION
1
Design Setting or Frame of Reference
Background
Statement of the Problem
Objectives of the Design
Significance and Impact of the Design
Scope and Delimitation
Definition of Terms
1
3
4
5
6
7
9
REVIEW OF RELATED LITERATURE AND STUDIES
Telemedicine
Health Monitoring System and its Wireless
Implementation
Blood Pressure Measuring Method
Improved ZigBee Routing Strategy for
Monitoring System
A Remote Compact Sensor for the Real-Time
Monitoring of Human Heartbeat and
Respiration Rate
Chapter 3:
DESIGN PROCEDURE
Data Gathering Procedure and Designing
Schematic Diagrams
PCB Layout
System Components
14
14
14
16
16
17
19
19
22
35
35
iii
Software
System Flowchart
Design Procedure
Program Flowchart
Chapter 4:
TESTING, PRESENTATION, & INTERPRETATION OF DATA
Readings in relation with distance covered
Comparison of Readings between devices
Chapter 5:
CONCLUSION AND RECOMMENDATION
Conclusion
Recommendation
BIBLIOGRAPHY
APPENDIX A
APPENDIX B
APPENDIX C
37
38
41
43
46
47
48
51
51
52
53
Program Listing
PIC Microcontroller (PIC16F648A)
Zilog (28F0822)
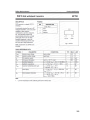
Datasheets
ZigBee Protocol
Zilog (28F0822)
PIC Microcontroller (PIC16F648A)
DIODE (1N4001)
EEPROM (ST24C04)
Voltage Regulator (L7805)
PNP Transistor (BFT92)
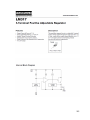
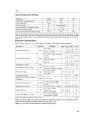
Adjustable Voltage Regulator (LM317)
Dual Op-Amp (LM358)
MAX 232 (DUAL EIA-232)
NPN Gen. Purpose Amplifier (PN100)
User’s Manual
54
55
60
64
65
86
95
98
100
104
109
113
117
121
126
129
iv
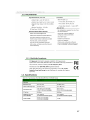
LIST OF TABLES
Table 3.1 System Components
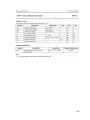
Table 4.1 Blood Pressure and Pulse Rate Readings in relation with
Distance covered
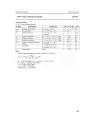
Table 4.2 Sphygmomanometer, Digital and Wireless Monitoring Device
Comparison
35
47
48
v
LIST OF FIGURES
Figure
Figure
Figure
Figure
Figure
Figure
Figure
Figure
Figure
Figure
Figure
Figure
Figure
2.1 Functional Block Diagram of the Developed Sensor
3.1 Block Diagram
3.2 Schematic Diagram of Power Supply
3.3 Schematic Diagram of Blood Pressure System
3.4 Schematic Diagram of ZigBee receiver
3.5 Schematic Diagram of Pulse Rate and Serial Port Driver
3.6 Schematic Diagram of Relay Driver
3.7 PCB Layout
3.8 System Flowchart
3.9 System Flowchart for the Blood Pressure
3.10 System Flowchart for the Pulse Rate
3.11 Design Procedure Diagram
3.12 Program Flowchart
18
19
22
25
27
29
33
35
38
39
40
41
43
vi
ABSTRACT
The design is intended for medical purposes, specifically, monitoring pulse rate
and blood pressure. The design is capable of transfering the measured data to a host
device such as computers through the use of ZigBee technology. The device includes
software that reads the data being taken by the receiver. The study will aid in solving
the problem of medical practitioners regarding the use of traditional method when
assessing and monitoring pulse rate and blood pressure. The design comprises of digital
blood pressure meter and a pulse rate measuring device. For the blood pressure,
pressure sensor was used, while for the pulse rate, a light dependent resistor was used.
The design allows fast method of monitoring blood pressure and pulse rate. Data are
transmitted wirelessly and can be interfaced to the computer allowing fast transmission
from a distance. This was proven by tests conducted during the research.
Keywords: Blood Pressure, Pressure Sensor, Pulse Rate, ZigBee
vii
Chapter 1
DESIGN BACKGROUND AND INTRODUCTION
This chapter provides a general overview of the design project. The
background of the design, the statement of the problem, the objectives, the
significance and impact of the design, the scope and delimitations, and definition
of terms, are presented.
The Design Setting or Frame of Reference
Pulse rate detection practice has been present for centuries which are
done for diagnostic purposes. Further improvements of pulse rate monitoring
continue but the principles are still the same and it is mostly intended to provide
a reliable and convenient way of measurement. Pulse rate monitoring had
already been attributed to the prevention of further escalation or diseases such
as Congenital Heart Disease and other chronic heart ailments.
Blood pressure measurement was first monitored by the Egyptians
through the simple palpation of the pulse. Blood pressure measurement is
heading towards reliable data reading and noninvasive approach into taking
measurements. Innovations were already done to develop a much accurate and,
at the same time, convenient device to assess ones blood pressure.
Wireless
Medical
Technologies
work
on
the
basis
of
wireless
communications, wireless applications, and other wireless technologies. Existing
1
Wireless Medical Technologies include Wireless Networking Technologies,
Wireless Home Medical Equipment, Wireless Point-of-Care Systems, Wireless
Remote Monitoring Systems, and Data Management Systems and Software
(Infiniti Research Limited 2009/01).
The convergence of technology and medicine has produced a new way of
medical practice and this is termed as telemedicine. From the common prefix of
“tele“ which means distant or far, the basic idea of telemedicine is health care or
medical assessment taken from some distant location via telecommunication
technologies (Stapic, et al. 2008). This system is aided with tools that make
health assessment from a distant possible. These tools are called health
monitoring equipments and are worn by the patient. Such equipments are then
capable of transmitting the health status or data of the patient to a network for
analysis and collection.
The implementation of new health care deliveries, such as telemedicine,
will gradually increase the value of clinical health data and will thus create an
incentive for collection and proliferation of health information electronically within
and between medical organizations (OTA-ITC-624 pg.8).
2
Background
According to the World Health Organization (WHO), cardiovascular
diseases cause 17.5 million deaths every year. Considered as one of the three
major deaths in the world, Cardiovascular diseases are caused by disorders of
the heart and blood vessels, and include coronary heart disease (heart attacks),
cerebrovascular
disease
(stroke),
raised
blood
pressure
(hypertension),
tachycardia (increased pulse rate), bradycardia (slow heart rate), peripheral
artery disease, rheumatic heart disease, congenital heart disease and heart
failure. The proliferation of such diseases and different disorders has now
become an alarming issue and due to this problem, there arises a need for better
diagnostic methods and tools. Chronic disorders are well treated if monitoring a
patient’s health can be analyzed in real-time even without the presence of a
nurse or a doctor.
The design is intended for monitoring a patient’s pulse rate and blood
pressure. In comparison with the traditional or conventional tools already present
which are used in the medical field, specifically the sphygmomanometer and the
stethoscope, the design presents an innovation by combining the monitoring of
the pulse rate and blood pressure into a single device and it is incorporated with
a wireless technology, ZigBee. The design is also capable of interfacing data and
result from the device to a PC monitor.
3
Basically, the design comprises of a digital blood pressure meter and a
pulse rate sensor for pulse rate reading which can be used interchangeably
through the design’s accompanying software. For communication purposes, the
ZigBee technology will be used for wireless data transmission between the device
and the host PC.
Statement of the Problem
The study will address the problem of medical practitioners such as
doctors and nurses in relieving the contemporary and native methods by
improving the way medical data is taken. At present times, the nurse or doctor
will attend to the patient and do some monitoring with conventional tools. After
the monitoring is done, the results are written on a record sheet then transferred
for further reference. This is done for each of the patient present in a medical
area or in a hospital. As one can see, having a medical personnel attend to each
of the patients will require time and is quite cumbersome especially to those who
are in public hospitals.
The monitored data, on the other hand, can be inaccurate because the
result of the reading will depend on the person who uses the traditional
sphygmomanometer. The problem in it is the difficulty in using the traditional
device, especially in hearing the beat for systolic and diastolic pressure as well as
reading the gauge. Moreover, the process used by the medical practitioners in
4
determining person’s pulse rate is somewhat imprecise since the measurement
depends on the number of pulse beats the medical practitioner can hear.
Furthermore, the manual recording of monitored data will be difficult to
sort and organize. With the aid of the design project, monitoring of blood
pressure and pulse rate of patients will be made through the use of a wireless
device which is also interfaced to a PC. This method will greatly aid the doctors
in their medical assistance to patients conveniently, in a way that the attendant
will no longer bring record sheets along with them all the time since the design is
capable of interfacing obtained data to host PC by means of the ZigBee protocol.
Objective of the Design
General Objective:
The general objective of the design is to develop a system that could aid
and improve the traditional ways of assessing and monitoring blood pressure and
pulse rate of medical practitioner towards his or her patients through the use of
a wireless blood pressure and pulse rate health monitoring technology.
Specific Objectives:
To create a ZigBee based health monitoring system that is interfaced to a
personal computer, and
To test, perform and compare measurements between devices.
5
Significance and Impact of the Design
The conceptualization of the design is based on the need to further
improve the way medical practices are done. The beneficiaries of this innovation
will benefit medical practitioners and patients. The prevalent methods being used
before are likely to have suffered inefficiencies and the introduction of the new
methods will greatly improve the way medical service is given. For the time
being, such systems are already present but a need to improve is evident.
Present systems tend to suffer inefficiency brought by issues regarding security,
power consumption and ease of device usage not easily present on older
wireless monitoring systems. Although the cost of such systems will inevitably be
a little higher than the previous systems, the advantages will likely outweigh
such small differences. This system is aimed to assist doctors and any others in
the health industry. The study is relevant that it can enhance the way wireless
health monitoring devices are used. Usage of the tools with the ZigBee modules
for data transmission has a possibility to have a longer battery life which could
provide more service hours to both the doctor and the patient. Critical usage of
the monitoring devices involved medical relief missions and the role of these
devices are considerably important. Therefore the service time of a device is a
great concern. Furthermore, as the findings taken by the monitoring tools
concerning the blood pressure and pulse rate data can be transferred to a
computer, data storage and retrieval systems can be implemented so that the
findings can assist related future cases which can ensure fast recovery for the
6
patient and less time for the doctors. This will also allow them to have more time
to diagnose other patients who are in need of medical services.
For global impact of the design, this would greatly help in the spreading of
awareness of possible risk in one’s health. In addition to that, it can persuade
others to do some improvements concerning medical matters. Furthermore,
because data is already present in its digital form, collaborative works between
medical practitioners from different parts of the world can be implemented for
studies on specific diseases.
Scope and Delimitations
Scope
The scope of the system involves the use of a digital device comprising of
both blood pressure and pulse rate for the health monitoring of the patient. The
device uses ZigBee technology for wireless data transmission.
A personal computer is used by the system to handle data storage and
display taken from the ZigBee devices and is therefore well suited to read the
data being taken by the receiving end. Raw data being taken by the device will
now be transmitted to the receiver of the Zigbee. Then it will be displayed in the
host PC monitor using software which reads the data being taken by the ZigBee
receiver connected to the serial port. The software is also capable of checking
the connection between the transmitter and the receiver side of the ZigBee.
7
Delimitations
The device is designed to monitor one’s pulse rate and blood pressure.
The blood pressure and pulse rate can not be measured simultaneously and is
done one at a time. For data displays, a computer is used, in which a receiving
ZigBee end device is attached. To view the data being obtained by the device,
accompanying software is needed to be installed on the PC to be able to view
the data from the ZigBee receiver. Also, database is not present in the design to
record every single data since it is only capable of transferring the last value read
by the device and therefore, have no way of retrieving the previous data but to
measure again. The device will not function properly if the blood pressure and
pulse rate monitoring device go beyond the allowable transmission range of the
ZigBee, which are 40m for indoors with interferences and 120m for outdoors
with a clear line-of-sight. The sphygmomanometer can handle about 200mmHg;
whereas the wireless device could only handle up to 170mmHg. The design is
only intended for one transmitter and one receiver. It is primarily intended for
human use only. Some discrepancies in data reading of the blood pressure
device may be observed due to its digital nature, wherein the measurements are
derived from the readings.
8
Definition of Terms
Block Diagram. This term refers to a diagram represented by blocks connected
by lines that show the relationships of the blocks (S.M.H. Collin; “Dictionary of
Computing 5th edition”)
Blood Pressure. It is the force of blood against the walls of the arteries caused
when the heart pumps blood to the body parts. (Oxford Publishing; “Concise
Medical Dictionary 6th edition”)
Brachial Point. This refers to the point along the arm where the pulse in the
arterial veins is strong and can be easily felt (Oxford Publishing; “Concise Medical
Dictionary 6th edition”)
Diastolic Pressure. It is the least amount of pressure exerted on arterial walls,
which occurs when the heart is at rest between ventricular contractions ( Turner,
J., IU Center for Sports Medicine)
Flowchart. It is a diagram that shows step by step progression through a
system using connecting lines and set of symbols (Gary J. Bronson; “C++ for
Engineers and Scientists”)
9
Graphical User Interface (GUI). This is a user interface that allows the user
to activate operating system commands by clicking in a desktop icon using a
pointing device such as mouse (Ida M. Flynn and Ann McIver McHoes;
“Understanding Operating System 4th edition”)
Hardware. It is the physical machine and its components, including main
memory, I/O devices, I/O channels, direct access storage devices and the central
processing unit (Ida M. Flynn and Ann McIver McHoes; “Understanding
Operating System 4th edition”)
Health Care. It refers to the prevention, treatment, and management of illness
and the preservation of mental and physical well-being (The American Heritage®
Medical Dictionary, 2007)
Interrupt. It is a useful way to grab the processor’s attention, get it to perform
a special task, and then resume execution from the point where it left off (James
L. Antonakos; “The Intel Microprocessor Family: Hardware and Software
Principles and Applications”)
Light Emitting Diode (LED). It refers to a diode that gives out light or infrared
rays when electrons enter holes as current flows through the diode (Neil Ardley;
“Concise Encyclopedia Science”)
10
Light Dependent Resistor (LDR). It is a variable resistor whose value
decreases with increasing light intensity (Encarta Online Encyclopedia)
millimeter of Mercury (mmHg). It refers to the unit of measurement of
pressure; a pressure of 1mmHg is that exerted by a column of mercury 1
millimeter high (Neil Ardley; “Concise Encyclopedia Science”)
Microcontroller. It is a souped-up microprocessors with built-in features such
as RAM, ROM, interval timers, parallel I/O ports, and even A/D converters
(James L. Antonakos; “The Intel Microprocessor Family: Hardware and Software
Principles and Applications”)
Network. It refers to a system of interconnected computer systems and
peripheral devices that exchange information within one another (Ida M. Flynn
and Ann McIver McHoes; “Understanding Operating System 4th edition”)
Operational Amplifier (OPAMP). It is an electronic unit that behaves like a
voltage-controlled voltage source (Charles K. Alexander and Matthew N.O.
Sadiku; “Fundamentals of Electric Circuit 3rd edition”)
11
Printed Circuit Board (PCB). It is an insulating material used as base, into
which conductive material strips are printed (Babak Kia, 2005)
Pulse. It refers to the rhythmic expansion and contraction of an artery caused
by impact of blood pumped by the heart (National Health and Nutrition
Examination Survey III by Westat, Inc)
Relay. It refers to an electrical switch that opens and closes under the control of
another electrical circuit; electrical device that switches on and off (Neil Ardley;
“Concise Encyclopedia Science”)
Systolic Pressure. It is the highest point of pressure on arterial walls when the
ventricles contract. (Turner, J. , IU Center for Sports Medicine)
Schematic Diagram. It refers to a diagram that represents the elements of a
system using graphical symbols instead of realistic ones (S.M.H. Collin; Dictionary
of Computing 5th edition)
Stethoscope. It is an instrument used for listening sound within the body
(National Health and Nutrition Examination Survey III by Westat, Inc.)
12
Telemedicine. It is the employment of data transfer pertaining to medical from
one location to another via electronic communication means for the provision of
healthcare and/or education for the purpose of a fast recuperation.
(Max E. Stachura, MD and Elena V. Khasanshina, MD, PhD; “Telehomecare and
Remote Monitoring: An outcomes overview”)
Transformer. It refers to a device employing the principle of mutual induction
to convert variations of current in a primary circuit into variations of voltage &
current in a secondary circuit; a device that changes the voltage and current of
an electrical supply (Neil Ardley; “Concise Encyclopedia Science”)
Voltage. The energy required to move a unit charge through an element,
measured in volts (V) (Charles K. Alexander and Matthew N.O. Sadiku;
“Fundamentals of Electric Circuit 3rd edition”)
Wireless Technology. It refers to a method of transmission that does not use
wires or cables to connect both ends (Campus Information Technologies and
Educational Services – University of Illinois)
ZigBee. It is a low-cost wireless system that provides low data-rate, low power
consumption and has low current drain (Kinney,P., 2003)
13
Chapter 2
REVIEW OF RELATED LITERATURE AND STUDIES
This chapter contains related studies in relation to the design which help
in understanding the related topics and the design itself.
As stated in the article entitled Health Care Online, the health care
industry has been experiencing great innovations and some of these are due to
the introduction of tools that aid the medical practitioners to assess patients from
a distance. This method, through the use of such tools as discussed by Stapic in
one of his studies, is referred to as Telemedicine and is defined as, "the use of
electronic information and telecommunication technologies to share medical
knowledge and provide care over a distance". Telemedicine systems are used to
transfer bodily vital signs or a patient's status. These systems employ
communication interface to a PC which allows the health personnel for a
systematic collection and analysis of data. The significance of the system to the
medical field, especially in long-term health supervision and chronic disease
management is high. These new practice in health care delivery are further
improving the way how health information are being collected and disseminated
from within and between medical organizations. Enhancements in patient
diagnosis brought by the availability of results from various data in gathered
related cases using this system are promising.
A study made by Hoang denotes that health monitoring systems those
being used in the telemedicine processes are typically made up of sensors and
14
control devices. Sensors pick up the data of some health conditions into raw data
that is then sent to the control device for processing. An appropriate action such
as alerts, database storage, analyses and extraction of relevant information
follows after the system initiated its use. This suggests that a typical health
monitoring system is primarily made up of sensors, control devices and outputs
such as a display or any certain computer response.
Many studies were already done based from various implementation of
wireless health monitoring technologies. One of the studies led by Strömmer has
shown that irDA, WLAN and Bluetooth, to name a few, have already been
focused upon for wireless implementation. Each wireless system has different
drawbacks and advantages to each other. The common factors that outweigh
each system from another are price, interference issues, power consumption,
security and usage complexities among other.
This project is intended to build a wireless pulse rate and blood pressure
monitoring system using ZigBee as its means for data to be transferred
wirelessly. Like its conventional medical monitoring tools equivalent, this project
proposal is also meant to monitor the status of a patient but with wireless
capability and pc interfacing improvement.
Using a wireless scheme for its data transfer, such systems are prone to
errors due to noise caused by the environment. To minimize errors in data
representations, the data being read from the monitoring devices will undergo
15
filtering using a program based filter algorithms through the interfaced PC which
also servers as the
control. Implementation of needed data communication
protocols required for the ZigBee devices will be considered in the interfacing.
Health monitoring tools are meant to be wearable devices for the use of a
patient, therefore, some considerations of the project proposal design is based
on this.
Finally, the main goal of this project proposal is to provide an almost realtime monitoring of the pulse rate and blood pressure of the patient.
Determining the method to be used in blood pressure and pulse rate
monitoring system has great effect on the system’s accuracy. Alvin Hopkinson,
an author, explained that the success in controlling high blood pressure is
ensured by keeping a record of pulse rates, weight loss or even the waistline.
Tracking the progress involves monitoring as to what the heart is doing. Hence,
one way of assessing the improvement of high blood pressure is via pulse rates.
To determine high blood pressure, pulse rates can be taken from any part of the
body with the wrist as the most preferred.
According to Xiaohui Li, Kangling Fang, Jinguang Gu and Liang Zhang
entitled An Improved ZigBee Routing Strategy for Monitoring System, many
ZigBee monitoring systems have been developed such as health monitoring,
power monitoring, greenhouse monitoring and animal presence monitoring. The
goal of these monitoring applications is low energy consumption for constantly
16
monitoring. ZigBee offers a practical application solution coupled with low rate,
low cost, low energy consumption characteristics for Wireless Sensor Networks.
For constantly monitoring situation, the energy consumption is priority. In order
to store the monitoring information into the database and provide interactive
operations, the coordinator communicates with the personal computer through
the RS-232 port. The management software on the personal computer can
differentiate the requirements in the monitoring system. The ZigBee routers play
the role of associating with other routers and sensor nodes as well as routing the
messages within the network. The sensor nodes which are corresponding to the
ZigBee end devices are equipped with a certain sensor to collect data from the
environment. This Zigbee technology will be used for wireless data transfers
between the sensors and the target device.
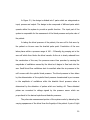
In the research done by Jung Han Choi, Member, IEEE, and Dong Kyun
Kim entitled A Remote Compact Sensor for the Real-Time Monitoring of Human
Heartbeat and Respiration Rate, they stated that the remote monitoring of
human cardiac and respiratory activities are desirable since they help treat
patients in emergency circumstances.
Presently, most commercial sensors have to be attached to the human
body. It is inconvenient to use in daily life. The researchers stated that the
remote sensor can be equipped in the home for long-period monitoring of the
patient and in the bed for managing comfortable sleeping. If the sensor is
17
applied to mobile application, the sensor needs to be portable and compact to
maintain the accuracy of the detection.
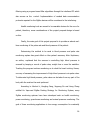
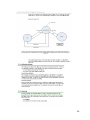
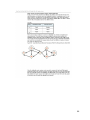
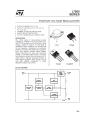
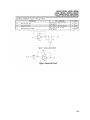
Figure 2.1 Functional Block Diagram of the Developed Sensor
In conclusion, the heartbeat and respiration information can be obtained
at a distance of 0.5 m with the developed sensor system. The measured heart
beat signal was compared with the output signal of the commercial fingertip
sensor. The comparison result shows excellent agreement, which validates the
performance of the developed sensor system.
The researchers considered the study since it uses or applies the concept
or real time monitoring system. Real time monitoring is very crucial in design
projects especially if the intended use or application needs a fast yet accurate
response. Not only the concept of real time monitoring is considered but also the
use of sensor in monitoring one’s vital parts, specifically, the heart beat and
respiration rate.
18
Chapter 3
DESIGN PROCEDURE
This chapter gives a narrative procedures used in the development of the
design. It includes the discussion of the block diagrams, schematic diagrams and
flowcharts.
Data Gathering Procedure and Designing
This part initiates the study of the researchers. Procedures pertaining to
the development of the design are discussed. Concepts regarding how the
prototype will be constructed are dependent on what can be applied to ensure
the construction of the prototype.
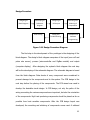
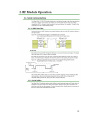
From the data gathered by the researchers, a design of the system is
proposed as follows:
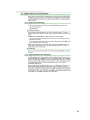
Input
Arm Cuff
Pulse Rate
Sensor
Process
Z8F0822 MCU
Output
Wireless
Transmission
ZigBee
Module
Computer
Display
PIC16F648A
MCU
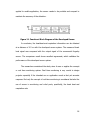
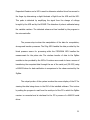
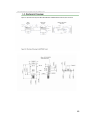
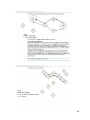
Figure 3.1 Block Diagram
19
In Figure 3.1, the design is divided into 3 parts which are categorized as
input, process and output. The design is also composed of different parts which
operate within the system to provide a specific function. The input part of the
system is responsible for the assessment of the blood pressure and pulse rate of
the patient.
In taking the blood pressure of the patient, the arm cuff is first worn by
the patient on his arm near the brachial pulse point. Constriction of the arm
takes places within a pressure range of 160 – 200mmHg by pumping air in the
arm cuff which then blocks the blood vessels. As the air is slowly released from
the constriction of the arm, the pressure sensor then operates by sensing the
magnitude of oscillations caused by the blood as it begins to flow back into the
arm. Small blood flow oscillations start to manifest when the air pressure in the
cuff concurs with the systolic blood pressure. The blood pressure is then taken
by the determination of the systolic blood pressure characterized by an increase
in the amplitude of oscillations while the diastolic blood pressure value is
determined by the detection of pulses which are leveling off. These detected
pulses are converted to voltage signals by the pressure sensor which are
proportional to the derived systolic and diastolic pressures.
The pulse rate measurement portion of the system works by detecting the
varying opaqueness of the blood from the fingertip of the patient. A pair of Light
20
Dependent Resistor and a LED is used to determine whether blood has moved in
the finger by determining a slight blockade of light from the LDR and the LED.
This pulse is detected by amplifying the signal from the change of voltage
brought by the LDR and by the OPAMP. The detection of pulse is calibrated using
the variable resistors. The detected values are then handled by the program in
the microcontroller.
The process step involves the manipulation of the data for computation,
storage and transfer processes. The Zilog MCU handles the data provided by the
blood pressure sensor for processing while the PIC16F84A MCU handles the
measurement for the pulse rate. The wireless transfer of data to the ZigBee
modules is also provided by the MCUs. Provisions were made to have a means of
transferring the computed data through the use of the serial port (RS-232) using
a MAX232 driver for data verification in comparison to the values received by the
ZigBee.
The output portion of the system involves the screen display of the PC for
viewing the data being shown in the GUI of the installed software. This is done
by setting the program to read from the serial port of the PC in which the ZigBee
receiver is connected and is interfaced to the PC by means of a MAX232 serial
driver.
21
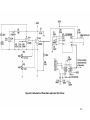
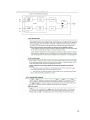
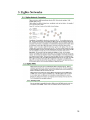
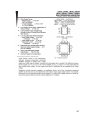
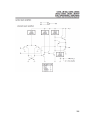
Schematic Diagrams
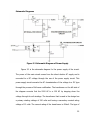
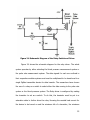
Figure 3.2 Schematic Diagram of Power Supply
Figure 3.2 is the schematic diagram for the power supply of the circuit.
The power of the main circuit comes from the direct electric AC supply and is
converted to a DC voltage through the use of the power supply circuit. This
power supply circuit converts the AC characteristics of the voltage to a DC type
through the process of full-wave rectification. The transformer on the left side of
the diagram converts first the 220V AC to a 12V AC by stepping down the
voltage through its coil windings. The transformer that is used in the design has
a primary winding voltage of 220 volts and having a secondary nominal rating
voltage of 12 volts. The current rating of the transformer is 400mA. The type of
22
the transformer used in the design is center tap. The capacitor which is placed
after the diodes filters any unwanted ripple voltage from the power supply to
ensure the proper voltage requirements of the components. The design of the
power supply was considered by first determining the required ratings of the
components for a center tap type full wave rectifier. The center tap transformer
has a secondary voltage rating (Vo) of 12 and output current (Io) of 400 mA. In
finding the PIV (Peak Inverse Voltage) to determine the values of the needed
Rectifier Diodes, the Vrms is needed and is computed using the formula:
C = (Io / 1.5) x (1/rectified frequency).
With a value of 400mA and rectified frequency of 120Hz, the capacitor value is
0.0022133 Farad or 2213 microfarad which is close to the standard 2200 uF.
Each part of the circuit has different voltage requirements. For a constant
voltage supply of 5V, the 7805 Fixed Voltage Regulator IC is used. For the other
circuit that requires a different voltage supply, the LM317 Adjustable Voltage
Regulator is used. The values to find the required LM317 output voltage are
determined using the formula
Vout = 1.25 (1 + (R2 + R3) / R1) = 6.2 V
for the 6.2 V output. For the 3.3 V output, the computation used is:
Vout = 1.25 (1 + (R10 + R11) / R9) = 3.3 V
23
The LM317 uses bypass capacitors with values of 200 uF to improve the
transient response of the power supply. The voltage of the LM317 with the
output of 6.2 V is being supplied to the Blood Pressure Sensor System and the
Relay switch. The LM317 with the output of 3.3 V is being used by the Zilog
Microcontroller and the ZigBee Module. The output voltage of the 7805 is
supplied to the pulse rate sensor system, the PIC Microcontroller and the
max232 dual EIA-232 driver.
24
Figure 3.3 Schematic Diagram of Blood Pressure System
25
Figure 3.3 shows the schematic for the blood pressure system. The blood
pressure sensor system obtains data from its pressure sensor and automatically
saves the result of derived values into its 24C04 4kbit EEPROM IC. The Zilog
Microcontroller uses the I2C Protocol to read the values from the 24C04. The SDA
and SCL pins of the Zilog MCU are connected to the respective SDA and SCL pins
of the EEPROM. The Zilog MCU is clocked at 10MHz using a crystal oscillator
connected to its XIN and XOUT pins. A push button with a pull down resistor
value of 10k is connected to the General I/O Pin Port A0 of the Zilog MCU for the
initiation of an interrupt in the sending of data for wireless transmission. A 3.3V
supply voltage is connected to the Vdd of the Zilog MCU with a 0.1 microfarad
bypass capacitor. The Avss and Vss pins of the MCU are connected to a common
ground.
26
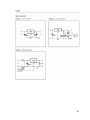
Figure 3.4 Schematic Diagram of ZigBee Receiver
The receiver part of the system consists of the ZigBee module (IC2), the
max232 (IC1) driver for the interfacing of the device to the serial port, the 7805
5v power regulator (IC3) for the max232 and the rt9163 3.3V power regulator
for the ZigBee. The receiver works by first using the ZigBee module to receive
any data from the ZigBee module in the sensor side of the system. If any data is
detected, the ZigBee module automatically sends the data received to the
27
max232 driver to be interfaced to the serial port of the PC through the DOUT PIN
of the ZigBee to the R2IN pin of the max232 driver. The Pin DIN of the ZigBee is
held low to disable the data transmission capability of the ZigBee. The Max232
driver outputs the TIA/EIA-232 compatible signals form the ZigBee to its R2OUT
Pin of the Max232 driver. The power supply of each part of the receiver is taken
from a 9V battery supply. The voltages are further broken down into 5V for the
max232 which is fed to its VCC pin using the lm7805 IC for 5V regulation. For
the power supply of the ZigBee, the voltage is regulated using the rt9163 3.3V
regulator IC. Bypass capacitors of 100 nF were connected to the C1+/-, C2+/and Vs +/- of the max232 IC as specified in its datasheet under application
information. The 470 uF capacitor after the 9V battery is placed to reject any
ripple voltage that may occur. Values of 22uF were used for each voltage
regulator to improve its output transient response.
28
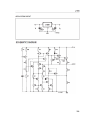
Figure 3.5 Schematic of Pulse Rate and Serial Port Driver
29
The pulse rate sensor circuitry uses a pair of LDR and LED to detect the
blood pulse from the finger.
The sensor part of the pulse rate system is composed of a pair of Red LED
and a Light Dependent Resistor (LDR). The pulse rate system uses a LM358 IC to
amplify the detected pulses, checks the signal for a valid pulse and send the
signals directly to the PIC microcontroller. The leftmost OPAMP in Figure 3.5 is
configured as a Non-Inverting Amplifier to amplify the signals of pulse from the
finger of the patient. The change in voltage brought by the change in resistance
of the LDR determines whether a pulse has passed the finger or not. The change
in voltage signal is small so that an amplifier circuit is used to strengthen the
weak pulse signal. The detected pulse is an alternating signal as the voltage
fluctuates from its base voltage to a slight difference increase when a pulse is
detected. The circuit employs a simple low pass filter at the non-inverting input
of the OPAMP that acts as an amplifier. This filter allows small frequencies to
pass and rejects any higher frequency value. The formula used in computing for
the sampling frequency is:
fc = 1/(2πRC)
The value of R1 is set to 10kΩ while the value of capacitor was set to
470nF. The computed value for fc is 34 Hz.
The voltage gain of the amplifier OPAMP is set to Av = 201 using the
formula:
30
Av = 1 + (R2 / R1)
The R1 in the equation is the R3 in the circuit with a value of 1k and is
connected between the inverting terminal of the OPAMP and the common
ground. R2 is composed of the RV1 and R4 in the circuit which is a resistor with
a value of 100kΩ and a 100kΩ potentiometer. Potentiometers are included in the
configuration of the OPAMP to calibrate the sensitivity of the system to detect a
pulse. Using the set voltage gain, the Vout in the OPAMP can be computed using
the formula Vout = Av x Vin. The 47kΩ resistor placed between the non-inverting
terminal of the OPAMP and ground serves as a compensation resistor to correct
voltage error caused by input bias current.
The second OPAMP is configured as a non-inverting comparator. The
reference voltage that determines a valid pulse signal is the voltage in the trigger
potentiometer. In this comparator setup, when the voltage from the noninverting input exceeds the reference voltage which is applied to the inverting
input, the output switches from low (0 V) to high (positive saturation). The PIC
MCU accepts signals as TTL logical 0 for 0.8 V and below and a logical 1 value
for 2V and above. The detected valid pulse signal goes to the GIO pin Port A0 of
the PIC. Each LED in the pulse rate sensor system uses a 150Ω current limiting
resistor designated as R5 and R6.
The PIC microcontroller computes the total pulse of the person in a given
time through the program in the microcontroller. The PIC MCU is clocked at 4
31
MHz using a crystal oscillator paired with bypass capacitors whose values are
22pF connected to its OSC1 and OSC2 pins. The push button switch is connected
to the Port A5 of the PIC MCU and along with a 10k pull down resistor. A
MAX232 serial port driver is allows the transfer of data directly to the serial port
of the host PC. The pin 4 Master Clear of the PIC is held high with a pull-up
resistor
of
10k.
The
PIC
MCU
uses
its
USART
(Universal
Synchronous/Asynchronous Receiver/Transmitter) pin TX to transfer the data
serially to the ZigBee module device and the max232. The output of pin TX is
connected to the normally closed terminal of the relay before reaching the PIN
DIN of the ZigBee.
Bypass capacitors of 100 nF are connected to the C1+/-, C2+/- and Vs
+/- of the max232 IC as specified in its datasheet under application information.
32
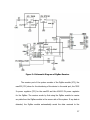
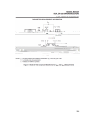
Figure 3.6 Schematic Diagram of the Relay Switch and Driver
Figure 3.6 shows the schematic diagram for the relay driver. The whole
system operates by either selecting the blood pressure measurement system or
the pulse rate measurement system. The data signals for each are confined in
their respective modular systems and must be multiplexed to be transferred to a
single ZigBee transmitter device for data transfer. The researchers have chosen
the use of a relay as a switch to select either the data coming to the pulse rate
system or the blood pressure system. The Relay driver is configured by making
the transistor to act as a switch. To do this, the transistor must be put in a
saturation state to further drive the relay. Knowing the needed load current for
the device to be turned on and the minimum hfe of a transistor, the minimum
33
base current to saturate the transistor can be known. The needed current of the
relay to be switched is 100mA and the minimum hfe of the transistor is 100, the
minimum base current can be solved using the equation:
Minimum base current = load current / transistor hfe
The equation yields a value of 1 mA. To ensure that the transistor is
always saturated, an added 30% to the computed base current is made. The
minimum base current then becomes 1.3 mA. The computation for the resistor
R1 is computed using the formula:
R1 = Supply Voltage /( Maximum Current Required A/ Minimum HFE * Minimum
Base current mA)
R1 = 12 volts / ((0.1 A / 100 ) * 1.3 mA)
R1 = 9230.7 Ω ≈ 10 KΩ
The R2 resistor is a base resistor which is used to prevent excessive base
current going to the transistor. The R3 resistor was used as a current limiting
resistor to the “Enable BP” LED. The purpose of the “Enable BP” switch is to
activate the relay by shorting R1 to the positive end of the supply to select either
the pulse rate system or the blood pressure system. The pulse rate system is
connected to the common closed terminal of the relay and the blood pressure
system is in the common open terminal of the relay. The output of the relay is
connected to the DIN of the ZigBee module.
34
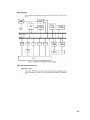
PCB Layout
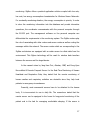
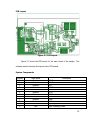
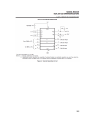
Figure 3.7 PCB Layout
Figure 3.7 shows the PCB layout for the main circuit of the design. The
software used to develop this layout is the PCB wizard.
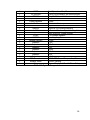
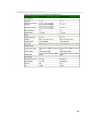
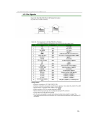
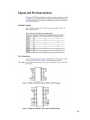
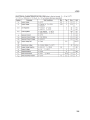
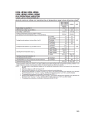
System Components
Quantity
3
1
3
1
5
3
1
1
1
1
1
2
Item Name
Resistor
Resistor
Resistor
Resistor
Resistor
Resistor
Resistor
Resistor
Resistor
Resistor
LDR
LED
Description
150 Ω
47 kΩ
1kΩ
100kΩ
10kΩ
220Ω
330Ω
560Ω
12kΩ
22kΩ
Light Dependent Resistor
Light- Emitting Diode
35
1
1
1
1
1
1
2
2
2
2
1
1
2
1
1
2
7
2
3
1
1
2
1
LM358
Dual Operational Amplifier
PIC16F648A
CMOS FLASH-based 8-bit microcontroller
Z8F0822
Zilog FLASH-based 8-bit microcontroller
Crystal Oscillator
4Mhz
Crystal Oscillator
10Mhz
24c04
4 kbit serial bus eeprom
Serial Connector
9-pin female serial connector
MAX232
Dual EIA-232 Drivers/Receivers
lm317
3-Terminal Positive Adjustable Regulator
ZigBee
XB24-z7uit-004 ZigBee Module
rt9163
3.3v voltage regulator
LM7805
5v voltage regulator
variable resistors
100kΩ
Capacitor
0.1nF
Capacitor
470nF
Capacitor
22pF
Capacitor
100nF
Capacitor
470uF
Capacitor
22uF
Capacitor
0.1uF
NPN Transistor
PN100 NPN General Purpose Amplifier
Rectifier Diode
1N4001 Rectifier
Relay
General Single Pole Double Throw Relay
Table 3.1 System Components
36
Software
Software is used in the construction of the design which involves the
development of the GUI program and the programming of the microcontrollers.
In the programming of the microcontrollers, compilers and burners are used for
each. The program code for the PIC16F648A was made using the PICBASIC
compiler. The program was burned using parallel PIC burner software from
Oshonsoft. The Zilog was programmed using a Z8 C compiler and was burned
using Zilog Developer Suite II. To design the PCB layout of the hardware, PCB
wizard software was used.
The system employs a GUI program to display the result to a host PC
taken by the device from the patient. The program to develop the GUI program
is Visual Basic 6. The GUI development software is used because it has a ready
built-in code for coordinating with devices which are interfaced to a serial port.
37
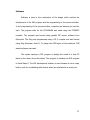
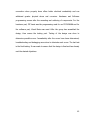
System Flowchart
Start
Connect the receiving side of the
ZigBee module to the serial port of the
host computer with the software
already installed
Run the software
Is the Blood
Pressure button
pressed?
Yes
Switch ON
the device
A
Switch ON
the device
B
No
Yes
Is the Pulse Rate
button pressed?
No
END
Figure 3.8 System Flowchart
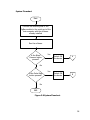
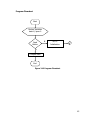
38
A
Place the arm cuff
wherein the brachial pulse
can be felt
Press the “Connect” buton
in the software
Press the “Enable BP” and
“Read BP” button
The arm cuff will inflate to
increase the pressure and
constrict the arm
Is the 170 mmHg
pressure reached?
No
Yes
The arm cuff will deflate
and computes the Blood
Pressure
Press the “Send” BP button
Result will be displayed on
the host PC
END
Figure 3.9 System Flowchart for the Blood Pressure
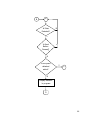
39
B
Place a finger in the white
pulse rate device
Press the “Connect” buton
in the software
The program will compute
for the number of pulse
and displays a “*”
indicator
No
Is One Minute
Reached?
Yes
Result will be displayed on
the host PC
END
Figure 3.10 System Flowchart for the Pulse Rate
40
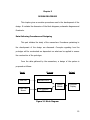
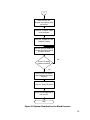
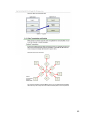
Design Procedure
Designing of
Block Diagram
Developing of
Schematic
Diagram
Final Testing
Designing of
PCB Layout
Testing and
Troubleshooting
Mounting and
Soldering of
Components
Hardware and
Software
Programming
Figure 3.11 Design Procedure Diagram
The first step in the development of the prototype is the designing of the
block diagram. The design’s block diagram comprises of the input (arm cuff and
pulse rate sensor), process (microcontroller and ZigBee module) and output
(computer display). After designing the system’s block diagram the next step
will be the developing of the schematic diagram. The schematic diagram is based
from the block diagram. Data sheets of every component were considered to
prevent damage to the components and to the system. The PCB design is the
next step before the placing of the components. The PCB wizard was used to
develop the desirable circuit design. In PCB design, not only the paths of the
wiring connecting the various components are important, but also the orientation
of the components. High heat producing components should be placed as far as
possible from heat sensitive components. After the PCB design layout was
developed, the mounting and soldering of components comes next. A soldered
41
connection when properly done offers better electrical conductivity and can
withstand greater physical stress and corrosion. Hardware and Software
programming comes after the mounting and soldering of components. For the
hardware part, PIC basic was the programming used for our PIC16F648A and for
the software part, Visual Basic was used. After the group has assembled the
design, then comes the testing part. Testing of the design was done to
determine possible errors. Immediately after the errors have been determined,
troubleshooting and debugging were done to eliminate such errors. The last test
is the final testing. It was made to ensure that the design is final and has already
met the desired objectives.
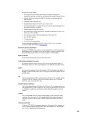
42
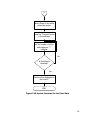
Program Flowchart
Start
Declare Variables
beat=0, bpm=0
Send
Button
Presse
d? Y
N
o
Go To
Initialization
A
Compute time
End
Figure 3.12 Program Flowchart
43
B
A
Is Pulse
Detected?
N
Y
Is Send
Button
Pressed?
pressed?
Y
N
Is the pulse
detected
active?
Y
C
N
Display indicator
to program
D
44
D
beat = beat + 1
C
Timer =
1min?
N
Check for
pulse
B
Y
Prepare value for
Transmission
End
This flowchart illustrates the operation of the program for the pulse rate
sensing of the system. The program starts by declaring the needed variables to
be used. The code then constantly checks whether the user has pressed the
send button. If the button has not been pressed, the program initializes the
variables to its default value and checks for any incoming pulse. This prevents
the user to send the stored data repeatedly to the program in the PC. For a valid
active pulse, the system will flash an asterisk indicator in the GUI program to
show pulse rate detection while the counters are being incremented. The
program will loop back to the pulse detection and continues to count the pulses
for one minute. If the program has reached one minute, the value is then stored
and waits for the user to press the send button to transfer the data wirelessly to
the receiver which is then displayed on the GUI.
45
Chapter 4
TESTING, PRESENTATION AND INTERPRETATION OF DATA
This chapter gives details on how the system was tested in relation to the
objectives stated in the first chapter.
In order to determine the consistency of the prototype, testing was done
after the prototype has been assembled. A testing was also done in order to
prove that the objectives were attained. Before testing for each procedure, the
following steps must be completed.
1. Turn on the computer and run the Blood Pressure and Pulse Rate
Monitoring Program,
2. Connect the receiver side of the ZigBee module to the serial port of the
host computer,
3. Turn on the Blood Pressure and Pulse Rate Monitoring Device,
4. Select either “Blood Pressure” or “Pulse Rate”; and
5. Click the “Connect” button.
After these steps were ensured, the first thing to be tested is the
maximum
amount
of
pressure
that
the
arm
cuff
can
handle.
The
sphygmomanometer can handle about 200mmHg; whereas the wireless device
could only handle up to 170mmHg.
46
Once determined, blood pressure and pulse rate are now ready to be
measured. Measurements were done one at a time. Since the system is wireless,
blood pressure and pulse rate readings can be transmitted and displayed to the
host device using the ZigBee module. Once the data was measured, the user
must press the “Send” button to transfer the data to the host device.
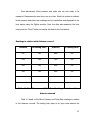
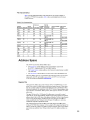
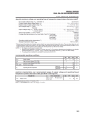
Readings in relation with distance covered
Distance
Is reading sent?
Distance
Is reading sent?
0m
Yes
60m
Yes
10m
Yes
70m
Yes
20m
Yes
80m
Yes
30m
Yes
90m
Yes
40m
Yes
100m
Yes
50m
Yes
Above 100m
No
Table 4.1 Blood Pressure and Pulse Rate Readings in relation with
distance covered
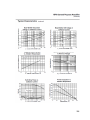
Table 4.1 deals on the Blood Pressure and Pulse Rate readings in relation
to the distance covered. The testing took place in an open area wherein the
47
person to be monitored assumes a comfortable sitting position with the forearm
supported at the level of the heart and the palm of the hand turned upwards.
The host is fixed in one area whereas the person’s distance from the host device
is varied.
The distances used for the particular testing are from 0 meter – 110
meters. In every test, the distance varies 10 meters. The readings obtained from
the tests show that the data could be sent at approximately 100m. Above from
100m, the data could not be read in the device. When the data is not read or
the pressure exceeds 170mmHg, there will be no value displayed on the
software and the word “STATUS” will blink. Hence, no status will be displayed on
the software.
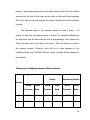
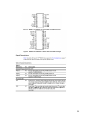
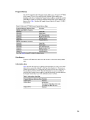
Comparison of readings between different devices
Sphygmomanometer
Digital Monitoring
Wireless
Device
Monitoring Device
Person
Blood
Pulse
Blood
Pulse
Blood
Pulse
Pressure
Rate
Pressure
Rate
Pressure
Rate
A
120/80
70
116/71
70
118/73
73
B
120/70
75
115/62
73
116/69
74
48
C
100/80
84
106/76
81
115/80
85
D
130/80
85
130/90
89
137/91
88
E
110/80
82
113/72
80
112/72
83
Table 4.2 Sphygmomanometer, Digital and Wireless Monitoring Device
Comparison
Sphygmomanometer is a device used for several years to measure blood
pressures and pulse rates. It is of great importance to perform a comparison
between the sphygmomanometer and wireless blood pressure and pulse rate
monitoring device to measure the credibility of the design. With the aid of a
nurse, blood pressures and pulse rates of different individuals was measured.
The results were reflected on table 4.2.
Blood pressure and pulse rate of five different individuals were obtained in
this particular test. Test using sphygmomanometer was done with the aid of a
nurse since nurses have a lot more knowledge in measuring using the traditional
method. The accuracy of the measurements in this method depends on the
ability of the person measuring it.
While testing the digital and wireless
monitoring device was done by the research team, it was found out that, using
this device requires less effort and less complicated compared to the traditional
one.
49
As seen in Table 4.2, the readings of both blood pressure and pulse rate
in sphygmomanometer and wireless monitoring device showed minimal
discrepancy. The discrepancy may be due to the inaccuracy of the readings by
the wireless monitoring device. The wireless monitoring devices do not actually
measure the blood pressure but derives the readings. The wireless device usually
follows an algorithm in which it derives the readings from the highest values
(systolic) down to the lowest values (diastolic) and averages them.
50
Chapter 5
CONCLUSION AND RECOMMENDATION
This chapter gives the overall conclusion of the design, which addresses
the objectives of the design.
Conclusion
A Wireless Blood Pressure and Pulse Rate monitoring device using ZigBee
technology that could remotely measure and monitor blood pressure and pulse
rate was designed, constructed and implemented. The design allows ease of use
and fast method of monitoring blood pressure and pulse rate for patients
because data are transmitted wirelessly and can be interfaced to a computer
allowing fast transmission from a distance and permits further evaluation of data.
Tests made support this fact. The design will also aid the medical practitioners
for cases of isolated patients that need continuous monitoring. The data from the
patients can be easily accessed using a central computer which handles the
information.
Wireless blood pressure and pulse rate monitoring system can be
implemented by using ZigBee technology. The measured blood pressure and
pulse rate can be transmitted wirelessly to the receiver with high accuracy. Only
small
discrepancies
between
the
measurement
of
mercury
based
51
sphygmomanometer and the designed system were noted. This is based on the
results of the tests done. This shows that wireless blood pressure and pulse rate
monitoring system using ZigBee is a reliable way to measure blood pressure and
pulse rate. The result of the monitoring device can be displayed using a personal
computer by interfacing the ZigBee receiver module to the host computer via
serial port.
Recommendation
The design can be improved by adding a database on its application
software to help keep records of data for comparison of results. The database
would allow flexibility by recording or deleting blood pressure and pulse rate
results for future use or reference. Increasing the number of ZigBee modules
connecting to the host computer is recommended to maximize the networking
capability of ZigBee and will allow simultaneous monitoring of multiple patients.
This is because multiple ZigBee transmitters can connect to a single receiver.
Automation of the blood pressure and pulse rate monitoring could be added. This
can be done by integrating an automatic and continuous measurement of pulse
rate and blood pressure in a given time that can be set by a timer. For additional
functionality of the design, ECG or Electrocardiogram can be added. It is a
diagnostic tool that measures and records the electrical activities of the heart in
great detail.
52
BIBLIOGRAPHY
Stapic, Zlatko, Tihomir Orehovacki, and Neven Vrcek. (2008). Modular approach
in integration of ICT technologies into mobile heart-work monitoring
system.
27th
International
Conference
on
Organizational
Science
Development KNOWLEDGE FOR SUSTAINABLE DEVELOPMENT
Strömmer, Esko, Jouni Kaartinen, Juha Pärkkä, Arto Ylisaukko-oja, and Ilkka
Korhonen. (21 May 2009).
Application of near field communication for
health monitoring in daily life. Proceedings of the 28th IEEE EMBS Annual
International Conference 03 Sep 2006 3246-3249. Database.
U.S. Congress, Office of Technology Assessment. (1995, September). Bringing
health care online: The role of information technologies. OTA-ITC-624
Washington, DC: U.S. Government Printing Office
Hoang, Doan. (2007). Wireless technologies and architectures for health.
Proceedings of the First International Conference on the Digital Society
(ICDS'07)
53
APPENDIX A
Program Listing
54
Device 16F628
Declare Xtal = 4
Hserial_Baud = 9600
Hserial_RCSTA = %10010000
Hserial_TXSTA = %00100100
Hserial_Clear = On
All_Digital = TRUE
TRISA =%00011
TRISB=%01000000
Dim WRD As Word
Dim beat As Byte
Dim bpm As Word
Dim uS As Word
Dim mS As Word
Dim S As Word
Symbol GIE = INTCON.7
Symbol TMR0_uS = 512
Symbol TMR0_Enable = INTCON.5
Symbol TMR0_Overflow = INTCON.2
'
55
'
Symbol pulse = PORTA.0
Clear WRD
beat = 0
bpm = 0
Clear PORTA
Clear PORTB
On_Interrupt Int_Sub
GoTo Initialization
Int_Sub:
GIE = 0
If TMR0_Overflow = 1 And TMR0_Enable = 1 Then
TMR0_Overflow = 0
uS = uS + TMR0_uS
If uS >= 1500 Then
uS = uS - 1500
mS = mS + 1
If mS >= 1000 Then
56
mS = mS - 1000
S=S+1
EndIf
EndIf
EndIf
GIE = 1
Context Restore
Initialization:
TMR0_Enable = 0
'
uS = 0
mS = 0
S=0
OPTION_REG.0 = 0
OPTION_REG.1 = 0
OPTION_REG.2 = 0
OPTION_REG.5 = 0
TMR0 = 0
TMR0_Enable = 1
GIE = 1
'
check_pulse:
57
If PORTA.1 = 0 Then
DelayMS 250
GoTo pulse_on
EndIf
GoTo check_pulse
pulse_on:
If PORTA.1 = 0 Then
DelayMS 250
beat =0
bpm =0
WRD = 0
GoTo pulse_on
EndIf
If pulse = 1 Then
HSerOut ["*",13]
beat = beat + 1
WRD = WRD + 1
DelayMS 150
While pulse = 1
58
Wend
HSerOut [" ",13]
EndIf
If S > 60 Then
S=0
HSerOut [Dec beat]
DelayMS 500
beat =0
bpm =0
WRD = 0
GoTo check_pulse
'
EndIf
GoTo pulse_on
disp1:
HSerOut [Dec beat]
Return
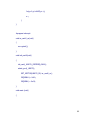
59
Device Z8F0822
#include <eZ8.h>
#include <sio.h>
#include <string.h>
#include <stdlib.h>
int loc=0;
char ren;
char dat1;
char dat2;
char msg[100];
unsigned char num1;
unsigned char num2;
unsigned char num3;
char outstr[20];
#include "i2c.h"
void sleep (char x)
{
unsigned int y;
while(x)
{
60
for(y=0;y!=0xffff;y++);
x--;
}
}
#pragma interrupt
void isr_uart0_rx(void)
{
ren=getch();
}
void init_uart0(void)
{
init_uart(_UART0,_DEFFREQ, 9600);
select_port(_UART0);
SET_VECTOR(UART0_RX, isr_uart0_rx);
IRQ0ENH |= 0x10;
IRQ0ENL |= 0x10;
}
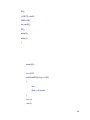
void main (void)
{
61
DI();
//OSCCTL=0x80;
PADD=0xff;
init_uart0();
EI();
sleep(4);
while(1)
{
sleep(40);
loc=2047;
while(readI2C(0,loc)==0xFF)
{
loc--;
if(loc==0) break;
}
loc-=3;
ren=0;
62
for(ren=0;ren!=4;ren++)
{
msg[ren]=readI2C(0,loc);
loc++;
}
putch('D');
putch('A');
putch('T');
putch('A');
putch(msg[0]);
putch(msg[2]);
putch(msg[3]);
//sleep(40);
63
APPENDIX B
Datasheets
64
65
66
67
68
69
70
71
72
73
74
75
76
77
78
79
80
81
82
83
84
85
86
87
88
89
90
91
92
93
94
95
96
97
98
99
100
101
102
103
104
105
106
107
108
109
110
111
112
113
114
115
116
117
118
119
120
121
122
123
124
125
126
127
128
APPENDIX C
User’s Manual
129
1. Install the accompanied software on the host PC before using this device.
The device needed the software to output the results on the PC through
the program’s GUI display.
Ensure that the host PC has a serial port to connect the receiver part of
the system.
2. Connect the receiver part of the system to the serial port of the host PC.
If the computer is using Windows XP check the designated number of
the serial port to be used by the program. Please follow the steps below:
130
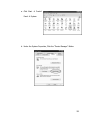
a. Click Start Control
Panel System
b. Under the System Properties, Click the “Device Manager” Button
131
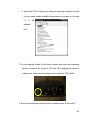
c. Expand the “Ports” category by clicking the plus sign beside it and look
for the number beside available communication port name, in this case
“1”
is
the
available
port.
3. For the required voltage of the blood pressure and pulse rate measuring
system, it needs an AC source of 220 volts. After plugging the device to
a valid power outlet, turn the device on by turning the “ON” switch.
4. Run the accompanied program which is installed earlier in the host PC.
132
5. Determine what function to be used in the device. To use the blood
pressure measuring part, push the “Enable BP” button.
To use the pulse rate measuring part of the device, push the “Pulse Rate”
button.
6. In the running program, choose between the pulse rate and the blood
pressure measurement.
133
Click the button to select the function. In the “Port” textbox near the top
of the GUI of the program, input the number of the port which is checked
earlier from step 2.
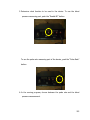
If the blood pressure GUI is to be used, carefully place the arm-cuff
from the device to the arm of the patient, press the “Read Blood
Pressure” in the device to start inflating the arm-cuff and let the device
read the blood pressure of the patient. After the arm-cuff has released the
air which indicates that the device has finished taking the blood pressure,
press the “Send BP” in the device to transfer the measurement to the PC
which will be displayed in the software
134
If the pulse reading system is to be used, place the pointing finger
of the person to the pulse reading device. Please note the proper side of
the device before placing the finger in the input of the device. Upon using
the pulse rate measurement system, an indicator will flash in the GUI
program to indicate that the program is reading the pulse rate of the
person. A LED indicator is also present in the device to indicate this
measurement.
135


![Les besoins des plantes [expériences] séq2](http://vs1.manualzilla.com/store/data/006425426_1-d260fe3404863812e90a2af157c2db5a-150x150.png)