1
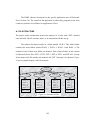
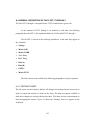
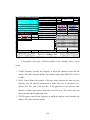
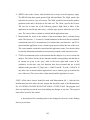
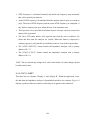
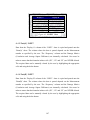
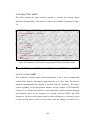
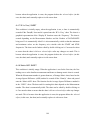
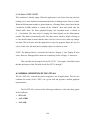
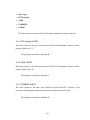
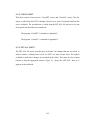
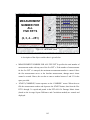
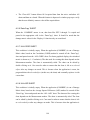
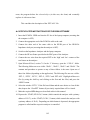
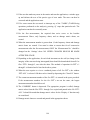
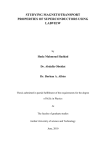
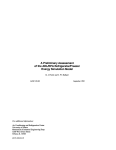
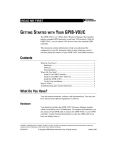
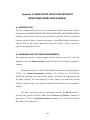
Appendix A: REINFORCED STRUCTURE INTEGRITY
MONITORING (RSIM) USER’S MANUAL
A.1 INTRODUCTION
This user’s manual will help a new user get acquainted with the software and hardware
components for the REINFORCED STRUCTURE INTEGRITY MONITORING (RSIM)
technique. A description of the hardware requirements is provided. The base commercial
software required is listed. A detailed description of the RSIM software developed at
Virginia Tech. for this specific application is provided. Finally, a step by step user’s
guide for this application is listed.
A.2 HARDWARE AND SOFTWARE REQUIREMENTS
The equipment required is a laptop computer with the facility to insert a PC card. The
instrument used is the Hewlett Packard (model: HP 4192A) Low Frequency Impedance
Analyzer.
The hardware involved is the PCMCIA GPIB data acquisition card (part number:
777156 - 04, National Instruments, telephone: 512-794-0100, fax: 512-794-5794,
World Wide Web: http://www.natinst.com), which is inserted into the appropriate slot in
the laptop computer. This card connects to a cable (which is provided along with the
PCMCIA card), the other end of which is attached to the HP-IB port of the Impedance
Analyzer.
The base commercial software requirements are the NI 488.2M (which is
provided along with the PCMCIA GPIB card) and Measure for Windows, Version 1.1
(part number: 777203-01, National Instruments, telephone: 512-795-8248, World Wide
Web: http://www.natinst.com).
181
The RSIM software developed for this specific application runs off Microsoft
Excel (Version 7.0). The control for the application is achieved by programs (in the form
of macros) written in Visual Basic for Applications (VBA).
A.3 FILE STRUCTURE
The project under consideration involves the analysis of 4 walls with 5 PZT’s bonded
onto each wall. The file structure, hence, is in conjunction with this set-up.
The software developed resides in a folder entitled C.E.R.L. This folder further
contains four more folders entitled WALL 1, WALL 2, WALL 3 and WALL 4. The
contents of each of these four folders are identical. Each of these folders in turn contain
six Microsoft Excel files: PZT-1, PZT-2, PZT-3, PZT-4, PZT-5 and PZT-ALL. Except
for the name of the file and the title inside the file, PZT 1 through 5 are identical. Figure
A1 gives a graphic display of the file structure.
C .E .R .L .
W ALL 1
W ALL 2
W ALL 3
W ALL 4
P Z T -1
P Z T -2
P Z T -3
P Z T -4
P Z T -5
P Z T -1
P Z T -2
P Z T -3
P Z T -4
P Z T -5
P Z T -1
P Z T -2
P Z T -3
P Z T -4
P Z T -5
P Z T -1
P Z T -2
P Z T -3
P Z T -4
P Z T -5
P Z T -A L L
P Z T -A L L
P Z T -A L L
P Z T -A L L
Figure
F ig u r e A1:
1 : S tStructure
r u c t u r e o foff ilfiles
es
182
A.4 GENERAL DESCRIPTION OF FILES: PZT-1 THROUGH 5
The files PZT-1 through 5 correspond to the 5 PZT’s bonded onto a given wall.
As the contents of PZT-1 through 5 are identical to each other, the following
paragraphs describe PZT-1; the explanation holds for all files titled PZT-1 through 5.
The file PZT-1 consists of the following worksheets, in the order they appear in
the workbook:
•
Settings
•
Metric-ASD
•
Metric-CORR
•
A Vs. Freq.
•
B Vs. Freq.
•
Data(A)
•
Data(B)
•
COPY1
•
Metric-FUNC
The above sheets are described in the following paragraphs in a logical sequence:
A.4.1 ‘SETTINGS’ SHEET
The file opens onto this sheet by default. All changes and settings that the user needs to
make to control the analyzer are done on this sheet. The data and options available to
make these changes are also provided on this sheet. This sheet also has custom buttons to
start the appropriate macros. Figure A2 shows the ‘Settings’ sheet as it appears in the
workbook.
183
FUNCTION
VALUE
PZT - 1
START Frequency
45
(in KHz)
DATA Points
400
(400, 500, 1000, 1500, 2000)
STOP Frequency
65
(in KHz)
SPEED
Med
(Short, Med, High)
Measurement No.
1
(1, 2, 3,…. …...251)
TYPE of measurement A2B1C2
(refer GREY chart)
START
START
(HP4192A)
(C.E.R.L.)
Hence: STEP Frequency 0.0500000
Actual STOP Frequency
|Z|,deg = A1B1C2 |Z|,rad = A1B2C2
|Y|,deg = A1B1C3 |Y|,rad = A1B2C3
R - X = A2B1C2 G - B = A2B1C3
L - Q = A3B1C1 C - Q = A4B1C2
L - D = A3B2C1 C - D = A4B2C2
L - R = A3B3C1 C - R = A4B3C2
L - G = A3B3C3 C - G = A4B3C3
ClearPZT
Experiment Description :
Figure
‘Settings’
Sheet
FigureA2:
2: ‘Settings’
sheet
A description of the user - defined variables on the ‘Settings’ sheet is given
below:
1. START Frequency specifies the frequency at which the analyzer would start the
analysis. The value is entered in KHz. The available range on the HP4192A is 5 Hz to
13 Mhz.
2. DATA Points defines the number of discrete points between the start and stop
frequency that the required measurement is made. The user is restricted to five
choices: 400, 500, 1000, 1500 and 2000. If the application is run with any other
number, a window pops open to inform the user of the error. The correct value can
then be entered and the application rerun.
3. STOP Frequency specifies the frequency at which the analyzer would conclude the
analysis. The value is entered in KHz.
184
4. SPEED refers to the velocity with which the wave sweeps over the frequency range.
The HP4192A has three speed options: High, Med and Short. The ‘High’ speed is the
fastest but it results in a loss of accuracy. The ‘Med’ speed has been found to produce
optimum results and is advised over the other two. The ‘Short’ speed is the slowest.
The user has to enter one of the following options: High, Med or Short. If the
application is run with any other entry, a window pops open to inform the user of the
error. The correct choice can then be entered and the application rerun.
5. Measurement No. refers to the number of the measurement that is currently being
made. The first time ‘1’ is entered. Column limitations in Microsoft Excel worksheets
constrain the user to 251 measurements. If a number that is not between 1 and 251 is
entered and the application is run, a window pops open to inform the user of the error.
The correct number can then be entered and the application rerun. Care must be taken
to enter the Measurement numbers in an increasing sequence with consecutive tests.
6. TYPE of measurement refers to the function that the analyzer is to use to execute the
analysis. The choices for the various functions and the corresponding code that has to
be entered are given in the ‘gray’ table in the lower right hand corner of the
worksheet. At this time, only two functions have been activated and are in bold
alphabet in the gray table: |Z|, Deg (code = A1B1C2) and R - X (code = A2B1C2). If
any other value is entered and the application is run, a window pops up to inform the
user of the error. The correct value is then entered and the application is rerun.
NOTE: All the above choices should be made with Measurement No. 1. After the first
measurement has been taken, the only change that should be made is the Measurement
No. NO OTHER CHANGES SHOULD BE MADE AT THIS STAGE. The program itself
does not explicitly prevent the user from making any changes at any time. The acquired
data will be in error if this is done.
A description of the remaining objects (not changed by the user) on the Settings
sheet is given below:
185
•
STEP Frequency is calculated internally and defines the frequency step increments
that will be made by the analyzer.
•
Actual STOP Frequency is downloaded from the analyzer when it stops (or is made to
stop). The desired STOP frequency and the actual STOP frequency are compared; if
they differ a window pops up to inform the user of an instrument error.
•
The Experiment Description block facilitates the user to keep a concise account of the
nature of the experiment.
•
The Clear PZT button deletes ALL acquired data from the active worksheet. All
charts and data from the analyzer are cleared. When this button is depressed a
window pops up to verify that the user definitely wants to clear all the acquired data.
•
The ‘START (HP4192A)’ button controls the Impedance Analyzer with a primary
address of H - 17.
•
The ‘START (C.E.R.L.)’ button controls the Impedance Analyzer with a primary
address of H - 01.
NOTE: The user should only change the 6 values listed before. No other changes should
be made on this sheet.
A.4.2 ‘COPY1’ SHEET
This sheet has two columns: ‘Display A’ and ‘Display B’. When the application is run,
the data from the Impedance Analyzer is downloaded onto these two columns. Figure A3
displays a portion of the two columns on this sheet as it appears in the workbook.
186
Display A
Display B
Figure
A3: ‘COPY1’
‘COPY1’ sheet
Sheet
Figure3:
A.4.3 ‘Data(A)’ SHEET
Data from the ‘Display A’ column of the ‘COPY1’ sheet is copied and pasted onto the
‘Data(A)’ sheet. The column where the data is pasted depends on the Measurement
number as specified by the user. The ‘Frequency’ column and the Damage Metrics
(Correlation and Average Square Difference) are internally calculated. Care must be
taken to ensure that the formulae in these cells (‘E5’, ‘G2’ and ‘G3’) are NEVER deleted.
The acquired data can be manually cleared by the user by highlighting the appropriate
cells and using the delete button.
A.4.4 ‘Data(B)’ SHEET
Data from the ‘Display B’ column of the ‘COPY1’ sheet is copied and pasted onto the
‘Data(B)’ sheet. The column where the data is pasted depends on the Measurement
number as specified by the user. The ‘Frequency’ column and the Damage Metrics
(Correlation and Average Square Difference) are internally calculated. Care must be
taken to ensure that the formulae in these cells (‘E5’, ‘G2’ and ‘G3’) are NEVER deleted.
The acquired data can be manually cleared by the user by highlighting the appropriate
cells and using the delete button.
187
A.4.5 ‘Metric-FUNC’ SHEET
This sheet contains the macro function required to calculate the Average Square
Difference Damage Metric. The function as seen in the workbook is displayed in figure
A4.
Function avsqdif(Before, After, Size)
avsqdif = 0
a=0
b=0
For I = 1 To Size
a = a + Before(I)
b = b + After(I)
Next I
diff = a / Size - b / Size
For I = 1 To Size
avsqdif = avsqdif + (Before(I) - (After(I) + diff)) * (Before(I) - (After(I) + diff))
Next I
End Function
Figure A4:Figure
Function
to calculate
the Average
Square
Difference
Damage Metric
4: Function
to calculate
the Avearge
Square
Difference
Damage Metric
A.4.6 ‘A Vs. Freq.’ SHEET
This worksheet is initially empty; when the application is run, a chart is automatically
created off the ‘Data(A)’ sheet and it is pasted onto the ‘A Vs. Freq.’ sheet. The chart is a
graphical representation of the ‘Display A’ function versus the ‘Frequency’. The chart is
created depending on the Measurement Number and the Number of DATAPOINTS
being used. It is automatically titled. It is also automatically scaled so that the minimum
and maximum values on the frequency axis coincide with the START and STOP
frequencies. The chart can be further edited by double clicking on it. Care must be taken
to ensure that the chart is left as a selected object after any changes are made. This is
188
because when the application is rerun, the program deletes the selected object (in this
case, the chart) and eventually replaces it with a new chart.
A.4.7 ‘B Vs. Freq.’ SHEET
This worksheet is initially empty; when the application is run, a chart is automatically
created off the ‘Data(B)’ sheet and it is pasted onto the ‘B Vs. Freq.’ sheet. The chart is a
graphical representation of the ‘Display B’ function versus the ‘Frequency’. The chart is
created depending on the Measurement Number and the Number of DATAPOINTS
being used. It is automatically titled. It is also automatically scaled so that the minimum
and maximum values on the frequency axis coincide with the START and STOP
frequencies. The chart can be further edited by double clicking on it. Care must be taken
to ensure that the chart is left as a selected object after any changes are made. This is
because when the application is rerun, the program deletes the selected object (in this
case, the chart) and eventually replaces it with a new chart.
A.4.8 ‘Metric-ASD’ SHEET
This worksheet is initially empty. When the application is run for the first time, the first
reading serves as the baseline measurement and hence no damage metric chart is created.
When the Measurement number is greater than two, a Damage Metric chart, based on the
Average Square Difference (ASD) method is created off the ‘Data(A)’ sheet and pasted
onto the ‘Metric-ASD’ sheet. The function for the Average Square Difference method is
in the ‘COPY1’ sheet. The data used for creating this chart depends on the Measurement
number. The chart is automatically titled. The chart can be edited by double clicking on
it. Care must be taken to ensure that the chart is left as a selected object after any changes
are made. This is because when the application is rerun, the program deletes the selected
object (in this case, the chart) and eventually replaces it with a new chart.
189
A.4.9 ‘Metric-CORR’ SHEET
This worksheet is initially empty. When the application is run for the first time, the first
reading serves as the baseline measurement and hence no damage metric chart is created.
When the Measurement number is greater than two, a Damage Metric chart, based on the
Correlation (CORR) method is created off the ‘Data(A)’ sheet and pasted onto the
‘Metric-ASD’ sheet. For better graphical display, the calculated metric is shown as
(1 - Correlation). The data used for creating this chart depends on the Measurement
number. The chart is automatically titled. The chart can be edited by double clicking on
it. Care must be taken to ensure that the chart is left as a selected object after any changes
are made. This is because when the application is rerun, the program deletes the selected
object (in this case, the chart) and eventually replaces it with a new chart.
NOTE: The Damage Metric is calculated for both the ‘Display A’ and ‘Display B’ data
series. However, Damage Metric charts are created only for the ‘Display A’ data series.
This concludes the description for the file ‘PZT-1’. Once again, it should be noted
that the description of this file holds for all files: PZT-1 through 5.
A.5 GENERAL DESCRIPTION OF FILE: PZT-ALL
The file ‘PZT-ALL’ contains the macros required to run all applications. This file also
combines the results of the 5 PZT’s on a given wall and presents a unified graphical
representation.
The file PZT-ALL consists of the following worksheets, in the order they appear
in the workbook:
•
SET-ALL
•
ALL-CORR
•
ALL-ASD
190
•
Data-Copy
•
PZT-Program
•
CERL
•
COMBINE
•
CLEAR
The above sheets are described in the following paragraphs in a logical sequence:
A.5.1 ‘PZT-Program’ SHEET
This sheet consists of the macro that controls the HP 4192A Impedance Analyzer with a
primary address of H - 17.
The program is attached as Appendix B.
A.5.2 ‘CERL’ SHEET
This sheet consists of the macro that controls the HP 4192A Impedance Analyzer with a
primary address of H - 01.
The program is attached as Appendix C.
A.5.3 ‘COMBINE’ SHEET
This sheet consists of the macro that combines the data from PZT-1 through 5 and
provides a unified graphical representation of the condition of the entire wall.
The program is attached as Appendix D.
191
A.5.4 ‘CLEAR’ SHEET
This sheet consists of two macros: ‘ClearPZT’ macro and ‘ClearALL’ macro. The first
macro is called from files PZT-1 through 5 and serves to clear all acquired data from the
active workbook. The second macro is called from the PZT-ALL file and serves to clear
all acquired data from the active workbook.
The program ‘ClearPZT’ is attached as Appendix E.
The program ‘ClearALL’ is attached as Appendix F.
A.5.5 ‘SET-ALL’ SHEET
The PZT-ALL file opens onto this sheet by default. All changes that the user needs to
make to obtain a unified picture of all five PZT’s are done on this sheet. The options
available to make these changes are provided on this sheet. This sheet also has custom
buttons to start the appropriate macros. Figure A5 shows the ‘SET-ALL’ sheet as it
appears in the workbook.
192
MEASUREMENT
NUMBER FOR
ALL
FIVE PZT'S
START
2
(COMBINE)
Clear-ALL
(2, 3, 4….251)
‘SET-ALL’ sheetSheet
Figure
Figure
A5:5: ‘SET-ALL’
A description of the objects on this sheet is given below:
•
MEASUREMENT NUMBER FOR ALL FIVE PZT’S specifies the total number of
measurements made with any one of the five PZT’s. If the number of measurements
for the five PZT’s is unequal, the maximum measurement number is entered. Since
the first measurement serves as the baseline measurement, damage metric charts
cannot be created. Hence, the user has to enter a number between 2 and 251 in the
space provided.
•
‘START (COMBINE)’ button operates on the ‘COMBINE’ macro. When the user
fills the measurement number and depresses the START button, data from the files
PZT-1 through 5 is copied and pasted in the PZT-ALL file. Damage Metric charts
(based on the Average Square Difference and Correlation method) are created and
displayed.
193
•
The ‘Clear-ALL’ button deletes ALL acquired data from the active worksheet. All
charts and data are cleared. When this button is depressed a window pops up to verify
that the user definitely wants to clear all the acquired data.
A.5.6 ‘Data-Copy’ SHEET
When the ‘COMBINE’ macro is run, data from files PZT-1 through 5 is copied and
pasted in the appropriate cells in the ‘Data-Copy’ sheet. It should be noted that the
damage metric values for the ‘Display A’ function only are considered.
A.5.7 ‘ALL-CORR’ SHEET
This worksheet is initially empty. When the application (COMBINE) is run a Damage
Metric chart, based on the Correlation (CORR) method is created off the ‘Data-Copy’
sheet and pasted onto the ‘ALL-CORR’ sheet. For better graphical display, the calculated
metric is shown as (1 - Correlation). The data used for creating this chart depends on the
Measurement number. The chart is automatically titled. The chart can be edited by
double clicking on it. Care must be taken to ensure that the chart is left as a selected
object after any changes are made. This is because when the application is rerun, the
program deletes the selected object (in this case, the chart) and eventually replaces it with
a new chart.
A.5.8 ‘ALL-ASD’ SHEET
This worksheet is initially empty. When the application (COMBINE) is run a Damage
Metric chart, based on the Average Square Difference (ASD) method is created off the
‘Data-Copy’ sheet and pasted onto the ‘ALL-ASD’ sheet. The data used for creating this
chart depends on the Measurement number. The chart is automatically titled. The chart
can be edited by double clicking on it. Care must be taken to ensure that the chart is left
as a selected object after any changes are made. This is because when the application is
194
rerun, the program deletes the selected object (in this case, the chart) and eventually
replaces it with a new chart.
This concludes the description of the ‘PZT-ALL’ file.
A.6 STEP-BY-STEP INSTRUCTIONS FOR THE RSIM SOFTWARE
1. Insert the PCMCIA GPIB card into the PC slot of the laptop computer (ensuring that
the computer is OFF).
2. Connect the appropriate end of the PCMCIA cable to the card.
3. Connect the other end of the same cable to the HP-IB port of the HP4192A
Impedance Analyzer (ensuring that the analyzer is OFF).
4. Switch on the Impedance Analyzer and the laptop computer.
5. Connect the HP test fixture provided to the BNC ports of the Analyzer.
6. Connect the two wires from the required PZT to the ‘high’ and ‘low’ contacts of the
test fixture on the analyzer.
7. Open Microsoft Excel, version 7.0. In the ‘C’ directory, open the ‘C.E.R.L.’ folder.
The following folders are now visible: ‘Wall-1’, ‘Wall-2’, ‘Wall-3’ and ‘Wall-4’. The
contents and procedure to operate on any of these folders is the same. Open one of
these four folders (depending on the application). The following files are now visible:
‘PZT-1’, ‘PZT-2’, ‘PZT-3’, ‘PZT-4’, ‘PZT-5’ and ‘PZT-ALL’. Highlight all these six
files (by using the shift key and clicking on the first and last files) and press the
‘OPEN’ button.
8. Select the window ‘PZT-1’. If the file has old data and the user desires to clear all this
data, depress the ‘ClearPZT’ button; all previously acquired data will be cleared.
9. Make the required SIX changes as described earlier in this manual.
10. Depress the ‘START (HP4192A)’ button (which controls the analyzer with a primary
address of H-17), or the ‘START (C.E.R.L.)’ button (which controls the analyzer with
a primary address of H-01). Depending on which button is depressed, the appropriate
program is called and the respective analyzer is controlled.
195
11. If the user has made any errors in the entries and runs the application, a window pops
up and informs the user of the precise type of error made. The error can then be
corrected and the application rerun.
12. If for some reason the user needs to interrupt any of the ‘TASKS’ (TASKS being
operations performed on the analyzer), pressing ‘Q’ stops that particular task. The
application can then be eventually rerun.
13. For the first measurement, the acquired data series serves as the baseline
measurement. Hence, only frequency charts, and no damage metric charts, are
created.
14. When the measurement number is greater than 1, both frequency charts and damage
metric charts are created. Care must be taken to ensure that for all consecutive
measurements after the first measurement, ONLY the ‘Measurement No.’ should be
changed on the ‘Settings’ sheet. NO OTHER CHANGES SHOULD BE MADE
AFTER THIS STAGE.
15. Depending on the application, for each load increment on the wall (or change in the
integrity of the structure being interrogated) data should be downloaded from all five
files: PZT-1 through 5, one after the other. The method of operation for PZT’s 1
through 5 is identical and is listed in the above points.
16. When the user requires to view a combined picture of all five PZT’s, the window
‘PZT-ALL’ is selected. Old data can be cleared by depressing the ‘ClearALL’ button.
17. The current measurement number of the five PZT’s is entered in the space provided.
If the measurement numbers for the five PZT’s are not the same, the largest
measurement number should be used.
18. The ‘COMBINE’ button is depressed. The appropriate program is called; damage
metric values from the files PZT-1 through 5 are copied and pasted in the file ‘PZTALL’. It should be noted that damage metric values for the ‘Display A’ function only
are considered.
19. Damage metric charts are created and pasted in the appropriate sheets.
196
20. The PCMCIA GPIB card should be removed from the laptop only after switching off
the computer.
197