1
Measurement Studio
TM
User Manual
Subtitle
Measurement Studio User Manual
April 2008
373392C-01
Support
Worldwide Technical Support and Product Information
ni.com
National Instruments Corporate Headquarters
11500 North Mopac Expressway Austin, Texas 78759-3504 USA Tel: 512 683 0100
Worldwide Offices
Australia 1800 300 800, Austria 43 662 457990-0, Belgium 32 (0) 2 757 0020, Brazil 55 11 3262 3599,
Canada 800 433 3488, China 86 21 5050 9800, Czech Republic 420 224 235 774, Denmark 45 45 76 26 00,
Finland 358 (0) 9 725 72511, France 01 57 66 24 24, Germany 49 89 7413130, India 91 80 41190000,
Israel 972 3 6393737, Italy 39 02 41309277, Japan 0120-527196, Korea 82 02 3451 3400,
Lebanon 961 (0) 1 33 28 28, Malaysia 1800 887710, Mexico 01 800 010 0793, Netherlands 31 (0) 348 433 466,
New Zealand 0800 553 322, Norway 47 (0) 66 90 76 60, Poland 48 22 3390150, Portugal 351 210 311 210,
Russia 7 495 783 6851, Singapore 1800 226 5886, Slovenia 386 3 425 42 00, South Africa 27 0 11 805 8197,
Spain 34 91 640 0085, Sweden 46 (0) 8 587 895 00, Switzerland 41 56 2005151, Taiwan 886 02 2377 2222,
Thailand 662 278 6777, Turkey 90 212 279 3031, United Kingdom 44 (0) 1635 523545
For further support information, refer to the Technical Support and Professional Services appendix. To comment
on National Instruments documentation, refer to the National Instruments Web site at ni.com/info and enter
the info code feedback.
© 2004–2008 National Instruments Corporation. All rights reserved.
Important Information
Warranty
The media on which you receive National Instruments software are warranted not to fail to execute programming instructions, due to defects
in materials and workmanship, for a period of 90 days from date of shipment, as evidenced by receipts or other documentation. National
Instruments will, at its option, repair or replace software media that do not execute programming instructions if National Instruments receives
notice of such defects during the warranty period. National Instruments does not warrant that the operation of the software shall be
uninterrupted or error free.
A Return Material Authorization (RMA) number must be obtained from the factory and clearly marked on the outside of the package before any
equipment will be accepted for warranty work. National Instruments will pay the shipping costs of returning to the owner parts which are covered by
warranty.
National Instruments believes that the information in this document is accurate. The document has been carefully reviewed for technical accuracy. In
the event that technical or typographical errors exist, National Instruments reserves the right to make changes to subsequent editions of this document
without prior notice to holders of this edition. The reader should consult National Instruments if errors are suspected. In no event shall National
Instruments be liable for any damages arising out of or related to this document or the information contained in it.
EXCEPT AS SPECIFIED HEREIN, NATIONAL INSTRUMENTS MAKES NO WARRANTIES, EXPRESS OR IMPLIED, AND SPECIFICALLY DISCLAIMS ANY WARRANTY OF
MERCHANTABILITY OR FITNESS FOR A PARTICULAR PURPOSE. CUSTOMER’S RIGHT TO RECOVER DAMAGES CAUSED BY FAULT OR NEGLIGENCE ON THE PART OF NATIONAL
INSTRUMENTS SHALL BE LIMITED TO THE AMOUNT THERETOFORE PAID BY THE CUSTOMER. NATIONAL INSTRUMENTS WILL NOT BE LIABLE FOR DAMAGES RESULTING
FROM LOSS OF DATA, PROFITS, USE OF PRODUCTS, OR INCIDENTAL OR CONSEQUENTIAL DAMAGES, EVEN IF ADVISED OF THE POSSIBILITY THEREOF. This limitation of
the liability of National Instruments will apply regardless of the form of action, whether in contract or tort, including negligence. Any action against
National Instruments must be brought within one year after the cause of action accrues. National Instruments shall not be liable for any delay in
performance due to causes beyond its reasonable control. The warranty provided herein does not cover damages, defects, malfunctions, or service
failures caused by owner’s failure to follow the National Instruments installation, operation, or maintenance instructions; owner’s modification of the
product; owner’s abuse, misuse, or negligent acts; and power failure or surges, fire, flood, accident, actions of third parties, or other events outside
reasonable control.
Copyright
Under the copyright laws, this publication may not be reproduced or transmitted in any form, electronic or mechanical, including photocopying,
recording, storing in an information retrieval system, or translating, in whole or in part, without the prior written consent of National
Instruments Corporation.
National Instruments respects the intellectual property of others, and we ask our users to do the same. NI software is protected by copyright and other
intellectual property laws. Where NI software may be used to reproduce software or other materials belonging to others, you may use NI software only
to reproduce materials that you may reproduce in accordance with the terms of any applicable license or other legal restriction.
Trademarks
National Instruments, NI, ni.com, and LabVIEW are trademarks of National Instruments Corporation. Refer to the Terms of Use section
on ni.com/legal for more information about National Instruments trademarks.
FireWire® is the registered trademark of Apple Computer, Inc. Other product and company names mentioned herein are trademarks or trade names
of their respective companies.
Members of the National Instruments Alliance Partner Program are business entities independent from National Instruments and have no agency,
partnership, or joint-venture relationship with National Instruments.
Patents
For patents covering National Instruments products, refer to the appropriate location: Help»Patents in your software, the patents.txt file
on your media, or ni.com/patents.
WARNING REGARDING USE OF NATIONAL INSTRUMENTS PRODUCTS
(1) NATIONAL INSTRUMENTS PRODUCTS ARE NOT DESIGNED WITH COMPONENTS AND TESTING FOR A LEVEL OF
RELIABILITY SUITABLE FOR USE IN OR IN CONNECTION WITH SURGICAL IMPLANTS OR AS CRITICAL COMPONENTS IN
ANY LIFE SUPPORT SYSTEMS WHOSE FAILURE TO PERFORM CAN REASONABLY BE EXPECTED TO CAUSE SIGNIFICANT
INJURY TO A HUMAN.
(2) IN ANY APPLICATION, INCLUDING THE ABOVE, RELIABILITY OF OPERATION OF THE SOFTWARE PRODUCTS CAN BE
IMPAIRED BY ADVERSE FACTORS, INCLUDING BUT NOT LIMITED TO FLUCTUATIONS IN ELECTRICAL POWER SUPPLY,
COMPUTER HARDWARE MALFUNCTIONS, COMPUTER OPERATING SYSTEM SOFTWARE FITNESS, FITNESS OF COMPILERS
AND DEVELOPMENT SOFTWARE USED TO DEVELOP AN APPLICATION, INSTALLATION ERRORS, SOFTWARE AND HARDWARE
COMPATIBILITY PROBLEMS, MALFUNCTIONS OR FAILURES OF ELECTRONIC MONITORING OR CONTROL DEVICES,
TRANSIENT FAILURES OF ELECTRONIC SYSTEMS (HARDWARE AND/OR SOFTWARE), UNANTICIPATED USES OR MISUSES, OR
ERRORS ON THE PART OF THE USER OR APPLICATIONS DESIGNER (ADVERSE FACTORS SUCH AS THESE ARE HEREAFTER
COLLECTIVELY TERMED “SYSTEM FAILURES”). ANY APPLICATION WHERE A SYSTEM FAILURE WOULD CREATE A RISK OF
HARM TO PROPERTY OR PERSONS (INCLUDING THE RISK OF BODILY INJURY AND DEATH) SHOULD NOT BE RELIANT SOLELY
UPON ONE FORM OF ELECTRONIC SYSTEM DUE TO THE RISK OF SYSTEM FAILURE. TO AVOID DAMAGE, INJURY, OR DEATH,
THE USER OR APPLICATION DESIGNER MUST TAKE REASONABLY PRUDENT STEPS TO PROTECT AGAINST SYSTEM FAILURES,
INCLUDING BUT NOT LIMITED TO BACK-UP OR SHUT DOWN MECHANISMS. BECAUSE EACH END-USER SYSTEM IS
CUSTOMIZED AND DIFFERS FROM NATIONAL INSTRUMENTS' TESTING PLATFORMS AND BECAUSE A USER OR APPLICATION
DESIGNER MAY USE NATIONAL INSTRUMENTS PRODUCTS IN COMBINATION WITH OTHER PRODUCTS IN A MANNER NOT
EVALUATED OR CONTEMPLATED BY NATIONAL INSTRUMENTS, THE USER OR APPLICATION DESIGNER IS ULTIMATELY
RESPONSIBLE FOR VERIFYING AND VALIDATING THE SUITABILITY OF NATIONAL INSTRUMENTS PRODUCTS WHENEVER
NATIONAL INSTRUMENTS PRODUCTS ARE INCORPORATED IN A SYSTEM OR APPLICATION, INCLUDING, WITHOUT
LIMITATION, THE APPROPRIATE DESIGN, PROCESS AND SAFETY LEVEL OF SUCH SYSTEM OR APPLICATION.
Contents
About This Manual
How To Use This Manual..............................................................................................ix
Conventions ...................................................................................................................x
Chapter 1
Introduction to Measurement Studio
Installation Requirements ..............................................................................................1-2
Driver Support .................................................................................................1-3
Deployment Requirements ............................................................................................1-3
Installation Instructions..................................................................................................1-3
Installing Hardware Drivers for Visual Studio 2008 Support .........................1-4
Installing Hardware Drivers for Visual Studio 2005 Support .........................1-5
Installing the Current Version of Measurement Studio over
Previous Versions of Measurement Studio ..................................................1-6
Measurement Studio Package Comparison Chart .........................................................1-6
Learning Measurement Studio.......................................................................................1-9
Chapter 2
Measurement Studio .NET Class Libraries
Measurement Studio Support for Visual Studio .NET Class Library Overview...........2-1
Analysis .........................................................................................................................2-2
Standard Analysis............................................................................................2-2
Professional Analysis ......................................................................................2-2
Enterprise Analysis..........................................................................................2-3
Common.........................................................................................................................2-13
Data Transfer .................................................................................................................2-14
Network Variable ............................................................................................2-14
DataSocket.......................................................................................................2-15
NI-488.2 .........................................................................................................................2-16
NI-DAQmx ....................................................................................................................2-16
NI-SCOPE .....................................................................................................................2-17
NI-VISA.........................................................................................................................2-17
User Interface.................................................................................................................2-18
Windows Forms Controls ..............................................................................................2-19
Waveform Graph and Scatter Graph Controls ................................................2-20
Digital Waveform Graph Control....................................................................2-23
Complex Graph Control ..................................................................................2-25
Legend Control................................................................................................2-27
© National Instruments Corporation
v
Measurement Studio User Manual
Contents
Numeric Controls ............................................................................................ 2-27
Numeric Edit Control...................................................................................... 2-29
Switch and LED Controls ............................................................................... 2-30
Property Editor Control................................................................................... 2-32
Windows Forms Array Controls ................................................................................... 2-33
Switch and LED Array Controls ..................................................................... 2-33
Numeric Edit Array Control ........................................................................... 2-34
InstrumentControlStrip Control ...................................................................... 2-35
ASP.NET Web Forms Controls .................................................................................... 2-37
Waveform Graph and Scatter Graph Controls ................................................ 2-38
Digital Waveform Graph Control ................................................................... 2-40
Complex Graph Control.................................................................................. 2-42
Legend Control ............................................................................................... 2-44
Numeric Controls ............................................................................................ 2-44
Numeric Edit Control...................................................................................... 2-47
Switch and LED Controls ............................................................................... 2-48
AutoRefresh Control ....................................................................................... 2-49
AutoRefresh Callback ..................................................................................... 2-49
Chapter 3
Measurement Studio Visual C++ Class Libraries
Measurement Studio Visual C++ Class Library Overview........................................... 3-1
ActiveX Controls in Visual C++ ................................................................................... 3-2
3D Graph Control .......................................................................................................... 3-2
Plot Operations................................................................................................ 3-3
Additional Operations ..................................................................................... 3-3
Analysis ......................................................................................................................... 3-3
Standard Analysis ........................................................................................... 3-4
Professional Analysis ...................................................................................... 3-4
Enterprise Analysis ......................................................................................... 3-4
Common ........................................................................................................................ 3-15
DataSocket..................................................................................................................... 3-15
Microsoft Excel Interface .............................................................................................. 3-16
Microsoft Word Interface .............................................................................................. 3-16
NI-488.2......................................................................................................................... 3-17
NI-DAQmx.................................................................................................................... 3-17
NI-Reports ..................................................................................................................... 3-18
NI-VISA ........................................................................................................................ 3-18
User Interface ................................................................................................................ 3-19
Button Control................................................................................................. 3-19
Graph Control ................................................................................................. 3-20
Plot Operations ................................................................................. 3-20
Axis Operations ................................................................................ 3-21
Measurement Studio User Manual
vi
ni.com
Contents
Additional Operations .......................................................................3-21
Knob Control ...................................................................................................3-21
Numeric Edit Control ......................................................................................3-22
Slide Control....................................................................................................3-23
Utility .............................................................................................................................3-24
Chapter 4
Measurement Studio Integrated Tools and Features
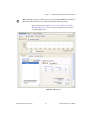
Measurement Studio Menu ............................................................................................4-1
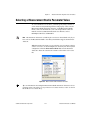
Creating a Measurement Studio Project ........................................................................4-4
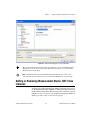
Adding or Removing Measurement Studio .NET Class Libraries ................................4-5
Creating a Measurement Studio NI-DAQmx Application ............................................4-6
Creating an NI-DAQmx User Interface ..........................................................4-8
Creating NI-DAQmx User Code in Visual C++ .............................................4-9
Creating an Instrument Control Application .................................................................4-9
Selecting a Measurement Studio Parameter Value........................................................4-11
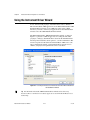
Using the Instrument Driver Wizard .............................................................................4-12
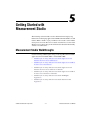
Chapter 5
Getting Started with Measurement Studio
Measurement Studio Walkthroughs...............................................................................5-1
Walkthrough: Creating a Measurement Studio Application
with Windows Forms Controls and Analysis ............................................................5-2
Walkthrough: Creating a Measurement Studio Application
with Web Forms Controls and Analysis ....................................................................5-11
Walkthrough: Creating a Measurement Studio Application
with Windows Forms Controls and Network Variable ..............................................5-22
Walkthrough: Creating a Measurement Studio Application
with Web Forms Controls and Network Variable ......................................................5-31
Walkthrough: Creating a Measurement Studio NI-DAQmx Application .....................5-42
Walkthrough: Creating a Measurement Studio Instrument I/O Application ................5-52
Appendix A
Technical Support and Professional Services
Glossary
Index
© National Instruments Corporation
vii
Measurement Studio User Manual
About This Manual
The Measurement Studio User Manual introduces the concepts associated
with the Measurement Studio class libraries and development tools. This
manual assumes that you have a general working knowledge of Microsoft
Visual Studio and the .NET Framework for .NET application development
or MFC for unmanaged C++ application development.
How To Use This Manual
Measurement Studio 8.5 includes two Visual Studio support CDs—one
with support for Visual Studio .NET 2003, Visual Studio 2005, and Visual
Studio 2008 and one with support for Visual Studio 6.0. This manual
documents Measurement Studio for Visual Studio 2005/2008. The
Measurement Studio support for Visual Studio .NET 2003, Visual
Studio 2005, and Visual Studio 2008 CD includes separate, parallel sets
of class libraries, integration features, and support documentation for
developing with Visual Studio .NET 2003, Visual Studio 2005, and Visual
Studio 2008. For help with Visual Studio 6.0, refer to the Measurement
Studio Support for Visual Studio 6.0 Readme located on the Measurement
Studio for Visual Studio 6.0 CD.
The Measurement Studio User Manual is organized into five chapters.
Chapter 1, Introduction to Measurement Studio, is an overview of
Measurement Studio. This chapter includes installation and deployment
requirements, installation instructions, and a list of Measurement Studio
resources. Chapter 2, Measurement Studio .NET Class Libraries, and
Chapter 3, Measurement Studio Visual C++ Class Libraries, include
information about the .NET class libraries and the Visual C++ class
libraries, respectively. Chapter 4, Measurement Studio Integrated Tools
and Features, includes information on using the Measurement Studio tools
and features integrated into the Visual Studio environment. Chapter 5,
Getting Started with Measurement Studio, includes walkthroughs that
guide you through step-by-step instructions on how to develop with
Measurement Studio features.
Refer to the Measurement Studio Release Notes for updates or changes to the
Measurement Studio User Manual.
Note
© National Instruments Corporation
ix
Measurement Studio User Manual
About This Manual
Use this manual as a starting point to learn about Measurement Studio.
Refer to the NI Measurement Studio Help within the Visual Studio
environment for function reference and detailed information about the
Measurement Studio class libraries, wizards, assistants, and other features.
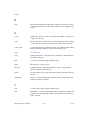
Conventions
The following conventions appear in this manual:
<>
Text enclosed in angle brackets represents directory names and parts of
paths that may vary on different computers, such as <Windows\System>.
»
The » symbol leads you through nested menu items and dialog box options
to a final action. The sequence File»Page Setup»Options directs you to
pull down the File menu, select the Page Setup item, and select Options
from the last dialog box.
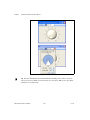
This icon denotes a tip, which alerts you to advisory information.
This icon denotes a note, which alerts you to important information.
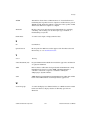
bold
Bold text denotes items that you must select or click on in the software,
such as menu items and dialog box options. Bold text also denotes class
library member names or emphasis.
italic
Italic text denotes parameters, variables, cross-references, or an
introduction to a key concept. Italic text also denotes text that is a
placeholder for a word or value that you must supply.
monospace
Text in this font denotes text or characters that you enter from the keyboard,
sections of code, programming examples, and syntax examples. This font
also is used for the proper names of disk drives, paths, directories,
programs, device names, filenames and extensions, and code excerpts.
Measurement Studio User Manual
x
ni.com
Introduction to Measurement
Studio
1
Measurement Studio is an integrated suite of tools and class libraries that
are designed for developers using Microsoft Visual Basic .NET, Visual C#,
ASP.NET, and Visual C++ to develop measurement and automation
applications.
Measurement Studio dramatically reduces application development time
through object-oriented measurement hardware interfaces, advanced
analysis libraries, scientific user interface controls for Windows and Web
applications, measurement data networking, wizards, interactive code
designers, and highly extensible .NET and Visual C++ classes. You can use
Measurement Studio to develop a complete measurement and automation
application that includes data acquisition, analysis, and presentation
functionalities.
Measurement Studio 8.5 Professional and Enterprise packages include
two Visual Studio support CDs—one CD with support for Visual Studio
.NET 2003, Visual Studio 2005, and Visual Studio 2008 and one CD with
support for Visual Studio 6.0. The Measurement Studio 8.5 Standard
package includes one CD with support for Visual Studio .NET 2003, Visual
Studio 2005, and Visual Studio 2008. Visual Studio 6.0 support includes
ActiveX controls for use in Visual Basic 6.0 and MFC class libraries and
ActiveX controls for use in Visual C++ 6.0. Visual Studio .NET 2003
support and Visual Studio 2005 support includes .NET class libraries and
controls for use with .NET languages and MFC class libraries and ActiveX
controls for use with Visual C++. Visual Studio 2008 support includes
only .NET class libraries and controls for use with .NET languages.
Measurement Studio 8.5 does not include MFC class libraries or ActiveX
controls for use in Visual C++ in Visual Studio 2008.
Measurement Studio 8.5 support for Visual Studio .NET 2003 includes updates to
the ActiveX controls; however, no new features for Visual Studio .NET 2003 are included
in Measurement Studio 8.5.
Note
© National Instruments Corporation
1-1
Measurement Studio User Manual
Chapter 1
Introduction to Measurement Studio
This manual documents Measurement Studio for Visual Studio 2005 and
Visual Studio 2008. For help with Visual Studio 6.0 support, refer to the
Measurement Studio Support for Visual Studio 6.0 Readme located on the
Measurement Studio for Visual Studio 6.0 CD. For help with Visual Studio
.NET 2003 support, refer to the Measurement Studio Support for Visual
Studio .NET 2003 Readme located on the CD for Measurement Studio for
Visual Studio .NET 2003. After installing Visual Studio .NET 2003
support, you can refer to the Measurement Studio User Manual by selecting
Start»All Programs»National Instruments»<Measurement Studio for
.NET 2003>»User Manual.
Refer to the Measurement Studio Release Notes for updates or changes to the
Measurement Studio User Manual.
Note
Installation Requirements
To use Measurement Studio, your computer must have the following:
•
Microsoft Windows Vista/XP/2000 for Visual Studio 2005 or
Microsoft Windows Vista/XP for Visual Studio 2008
If you have Windows Vista installed you must also have both Visual Studio 2005
Service Pack 1 and Visual Studio Service Pack 1 Update for Windows Vista installed on
your machine for Measurement Studio to function properly.
Note
Measurement Studio User Manual
•
Microsoft .NET Framework 2.0 for Visual Studio 2005 or Microsoft
.NET Framework 3.5 for Visual Studio 2008 (required only for the
Measurement Studio .NET class libraries)
•
Standard, Professional, or Team System edition of Microsoft Visual
Studio 2005 or Standard, Professional, or Team System edition of
Microsoft Visual Studio 2008 (required to use the Measurement Studio
integrated tools) or Visual C#, Visual Basic .NET, or Visual C++
Express editions of Microsoft Visual Studio 2005 or Microsoft Visual
Studio 2008
•
Intel Pentium III class processor, 1 GHz or higher
•
Video display—1024 × 768, 256 colors (16-bit color recommended for
user interface controls)
•
Minimum of 256 MB of RAM (512 MB or higher recommended)
•
Minimum of 385 MB of free hard disk space for Visual Studio 2005
support or minimum of 200 MB of free hard disk space for Visual
Studio 2008 support
1-2
ni.com
Chapter 1
•
Microsoft-compatible mouse
•
Microsoft Internet Explorer 6.0 or later
Introduction to Measurement Studio
Optional Installation—In order for links from Measurement Studio help
topics to .NET Framework help topics to work, you must install the
Microsoft .NET Framework SDK 2.0 or Microsoft .NET Framework
SDK 3.5.
Driver Support
To use .NET class libraries that interface to National Instruments device
drivers, NI-DAQmx, NI-VISA and NI-488.2, and the MAX (Measurement
& Automation Explorer) configuration utility, you must install the
underlying device drivers in addition to the .NET class libraries. You can
run the underlying device driver installers from the NI Device Drivers CD
included with Measurement Studio. Alternatively, refer to NI Drivers and
Updates on ni.com and enter Device Drivers into the search field to
download the latest version of the NI Device Drivers CD.
Deployment Requirements
To deploy an application built with Measurement Studio .NET class
libraries, the target computer must have a Windows Vista/XP/2000
operating system and the .NET Framework version 2.0 for Visual Studio
2005 or the .NET Framework version 3.5 for Visual Studio 2008.
To deploy an application built with Measurement Studio Visual C++ class
libraries, the target computer must have a Windows Vista/XP/2000
operating system.
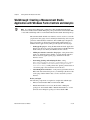
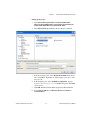
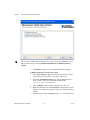
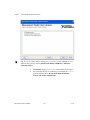
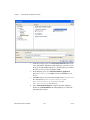
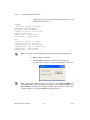
Installation Instructions
Complete the following steps to install Measurement Studio. These steps
describe a typical installation. Please carefully review all additional
licensing and warning dialog boxes.
National Instruments recommends that you exit all programs before
running the Measurement Studio installer. Applications that run in the
background, such as virus scanning utilities, might cause the installer to
take longer than average to complete.
© National Instruments Corporation
1-3
Measurement Studio User Manual
Chapter 1
Introduction to Measurement Studio
Note There are separate installers for Measurement Studio support for Visual Studio 2005
and Measurement Studio support for Visual Studio 2008. Repeat the installation
instructions to install support for both. When installing support for more than one version
of Visual Studio, you can reduce installation time by running the Device Drivers CD
installer only once. To do this, ensure that the Device Drivers CD feature is enabled only
for the last Measurement Studio Visual Studio support installer that you run.
The option to browse for an installation location is valid only if you have
not already installed any Measurement Studio features for the version of
Visual Studio or the .NET Framework that you are installing. If you have
any Measurement Studio features installed, then Measurement Studio
installs to the same root directory to which you installed other
Measurement Studio features.
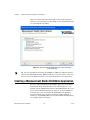
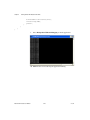
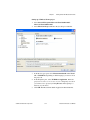
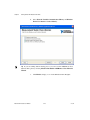
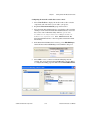
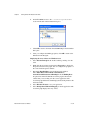
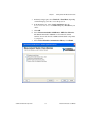
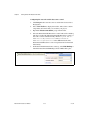
Complete the following steps to install Measurement Studio:
1.
Log on as an administrator or as a user with administrator privileges.
2.
Launch Autorun.exe, either from the installation CD or from the
location to which you extracted the downloaded CD image.
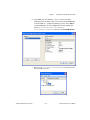
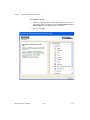
3.
Select the version of Visual Studio you want to install support for.
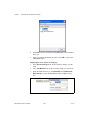
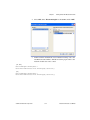
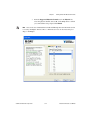
4.
Follow the instructions that appear on the screen.
If you want to upgrade a Windows XP machine to Windows Vista, National
Instruments recommends first uninstalling all NI software, including both application
software and drivers.
Note
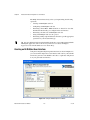
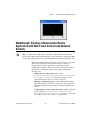
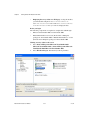
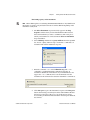
Installing Hardware Drivers for Visual Studio 2008 Support
Visual Studio 2008 .NET class library support for National Instruments
hardware drivers is included on the Measurement Studio 8.5 CD, under the
VS2008 Driver Support feature in the feature tree. To install support for
NI-DAQmx, NI-VISA, NI-488.2, or MAX, you must install the appropriate
feature from the Measurement Studio 8.5 CD and you must install the
underlying device driver from the NI Device Drivers CD or from a
product-specific driver installer. Refer to the Driver Support section for
information on obtaining device driver installers.
Measurement Studio User Manual
1-4
ni.com
Chapter 1
Introduction to Measurement Studio
To install support for NI-DAQmx:
1.
In the NI Measurement Studio 8.5 installer, enable the VS2008 Driver
Support».NET Framework 3.5 Languages Support for
NI-DAQmx feature.
2.
In the NI Device Drivers installer, enable the Data Acquisition»
NI-DAQmx feature.
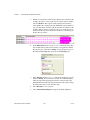
To install support for NI-VISA:
1.
In the NI Measurement Studio 8.5 installer, enable the VS2008 Driver
Support».NET Framework 3.5 Languages Support for NI-VISA
feature. If you want to use the Instrument I/O Assistant inside Visual
Studio 2008, enable the VS2008 Driver Support»VS2008 DotNET
IIOAssistant Support feature.
2.
In the NI Device Drivers installer, enable the Instrument Control»
NI-VISA feature.
To install support for NI-488.2:
1.
In the NI Measurement Studio 8.5 installer, enable the VS2008 Driver
Support».NET Framework 3.5 Languages Support for NI-488.2
feature.
2.
In the NI Device Drivers installer, enable the Instrument Control»
NI-488.2 feature.
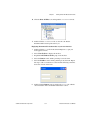
To install support for MAX:
1.
In the NI Measurement Studio 8.5 installer, enable the VS2008 Driver
Support».NET Framework 3.5 Languages Support for NI MAX
feature.
2.
In the NI Device Drivers installer, enable the NI Measurement and
Automation Explorer feature.
Installing Hardware Drivers for Visual Studio 2005 Support
The .NET and C++ class libraries for Visual Studio 2005 support for
National Instruments hardware drivers are included in the Driver CD
installer.
© National Instruments Corporation
1-5
Measurement Studio User Manual
Chapter 1
Introduction to Measurement Studio
Installing the Current Version of Measurement Studio over Previous
Versions of Measurement Studio
You can have only one version of Measurement Studio installed on a system for each
version of Visual Studio or the .NET Framework installed on the system. For example,
you can have Measurement Studio 8.1.2 for Visual Studio 2005 installed on the
same system as Measurement Studio 8.5 for Visual Studio 2008, but you cannot have
Measurement Studio 8.1.2 for Visual Studio 2005 installed on the same system as
Measurement Studio 8.5 for Visual Studio 2005.
Note
If you install a newer version of Measurement Studio on a machine that has
a prior version of Measurement Studio installed, the newer version installer
replaces the prior version functionality, including class libraries. However,
the prior version assemblies remain in the global assembly cache (GAC);
therefore, applications that reference the prior version continue to use the
prior version .NET assemblies.
Note This does not apply to NationalInstruments.Common.dll.
NationalInstruments.Common.dll uses a publisher policy file to redirect
applications to always use the newest version of NationalInstruments.Common.dll
installed on the system, for each version of the .NET Framework.
NationalInstruments.Common.dll is backward-compatible.
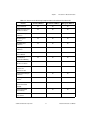
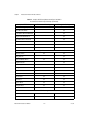
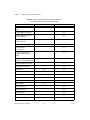
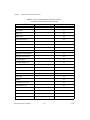
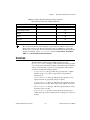
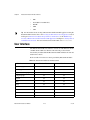
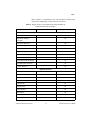
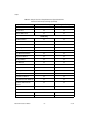
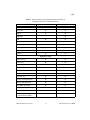
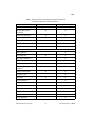
Measurement Studio Package Comparison Chart
The following table lists the features included in the Standard,
Professional, and Enterprise packages of Measurement Studio. Refer to
ni.com/mstudio for more information about the functionality and
features included with each Measurement Studio package, including Visual
C++ functionality.
Measurement Studio User Manual
1-6
ni.com
Chapter 1
Introduction to Measurement Studio
Table 1-1. Measurement Studio Package Comparison Chart for Visual C# and Visual Basic .NET
Feature
Standard Edition
Professional Edition
Enterprise Edition
Project Wizards
✔
✔
✔
Windows Forms User
Interface Controls
✔
✔
✔
Standard Analysis
Libraries1
✔
✔
✔
NI-488.2 Class
Libraries2
✔
✔
✔
NI-VISA Class
Libraries2
✔
✔
✔
NI-DAQmx Class
Libraries2
✔
✔
✔
.NET Instrument
Driver Wizard
✔
✔
✔
User Interface
DataSocket Binding
✔
✔
✔
Web Forms User
Interface Controls
✔
✔
MFC and ActiveX
Controls for
Visual C++ 6.0
✔
✔
Professional Analysis
Libraries3
✔
✔
3D Graph ActiveX
Control
✔
✔
User Interface
Network Variable
Binding
✔
✔
Network Variable
Class Library
✔
✔
Network Variable
Data Source
✔
✔
© National Instruments Corporation
1-7
Measurement Studio User Manual
Chapter 1
Introduction to Measurement Studio
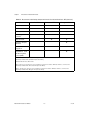
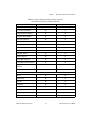
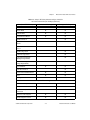
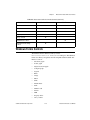
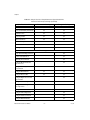
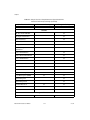
Table 1-1. Measurement Studio Package Comparison Chart for Visual C# and Visual Basic .NET (Continued)
Feature
Standard Edition
Professional Edition
Enterprise Edition
DataSocket Server
✔
✔
DataSocket Library
✔
✔
Parameter Assistant
✔
✔
Instrument I/O
Assistant2
✔
✔
DAQ Assistant2
✔
✔
Enterprise Analysis
Libraries4
✔
NI TestStand
Integration
✔
LabWindows™/CVI™
Full Development
System (FDS)
✔
1
Refer to the Standard Analysis section of Chapter 2, Measurement Studio .NET Class Libraries, for a list of the
functionality included in the Standard Analysis class library.
2 Included
with the Device Drivers CD.
3
Refer to the Professional Analysis section of Chapter 2, Measurement Studio .NET Class Libraries, for a list of the
functionality included in the Professional Analysis class library.
4 Refer
to the Enterprise Analysis section of Chapter 2, Measurement Studio .NET Class Libraries, for a list of the
functionality included in the Enterprise Analysis class library.
Measurement Studio User Manual
1-8
ni.com
Chapter 1
Introduction to Measurement Studio
Learning Measurement Studio
As you work with Measurement Studio, you might need to consult
additional resources. For detailed Measurement Studio help, including
function reference and in-depth documentation on developing with
Measurement Studio, refer to the NI Measurement Studio Help within the
Visual Studio environment. The NI Measurement Studio Help is fully
integrated with the Visual Studio help. You must have Visual Studio
installed to view the online help, and you must have the Microsoft .NET
Framework SDK 2.0 for Visual Studio 2005 or the Microsoft .NET
Framework SDK 3.5 for Visual Studio 2008 installed in order for links
from Measurement Studio help topics to .NET Framework help topics to
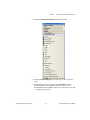
work. You can launch the NI Measurement Studio Help in the following
ways:
•
From the Windows Start menu, select Start»All Programs»National
Instruments»<Measurement Studio>»Measurement Studio
Documentation. The help launches in a stand-alone help viewer.
•
From Visual Studio, select Help»Contents to view the Visual Studio
table of contents. The NI Measurement Studio Help is listed in the table
of contents.
•
From Visual Studio, select Measurement Studio»NI Measurement
Studio Help. The help launches within the application.
As you work through this manual, you will see italicized references to relevant help
topics. To find these topics, use the table of contents in the NI Measurement Studio Help
installed on your machine.
Tip
The following resources also are available to provide you with information
about Measurement Studio.
•
Getting Started information—Refer to the Measurement Studio Core
Overview topic and the Getting Started with the Measurement Studio
Class Libraries section in the NI Measurement Studio Help for an
introduction to Measurement Studio and for walkthroughs that guide
you step-by-step in learning how to develop Measurement Studio
applications. For an introduction to Measurement Studio resources,
refer to the Using the Measurement Studio Help topic in the
NI Measurement Studio Help.
•
Examples—Measurement Studio installs examples organized by class
library, depending on the component, the version of Visual Studio or
the .NET Framework that the example supports, the version of
Measurement Studio installed on the system, and the operating system.
© National Instruments Corporation
1-9
Measurement Studio User Manual
Chapter 1
Introduction to Measurement Studio
For more information on example locations, refer to Where To Find
Examples.
Measurement Studio User Manual
•
NI Technical Support—Refer to Appendix A, Technical Support and
Professional Services, for more information.
•
Measurement Studio Web site, ni.com/mstudio—Contains
Measurement Studio news, support, downloads, white papers, product
tutorials, and evaluation software.
•
NI Developer Zone, zone.ni.com—Provides access to online
example programs, tutorials, technical news, and a Measurement
Studio Discussion Forum where you can participate in discussion
forums for Visual Basic 6.0, Visual C++, and .NET Languages.
•
Measurement Studio .NET Class Hierarchy Chart and Measurement
Studio Visual C++ Class Hierarchy Chart—Provide overviews of
class relationships within class libraries. Charts are included with all
Measurement Studio packages and are posted online at ni.com/
manuals.
•
Review the information from the Microsoft Web site on using Visual
Studio.
1-10
ni.com
Measurement Studio .NET Class
Libraries
2
This chapter provides overview information about the .NET class libraries
included with Measurement Studio support for Visual Studio 2005 and
Visual Studio 2008. Refer to the Using the Measurement Studio .NET Class
Libraries section of the NI Measurement Studio Help for detailed
information about these libraries. Refer to Chapter 5, Getting Started with
Measurement Studio, for step-by-step instructions on developing
applications with these libraries.
Measurement Studio Support for Visual Studio .NET
Class Library Overview
Measurement Studio provides .NET class libraries that you can use to
develop complete measurement and automation applications in Visual
Basic .NET and Visual C#.
Measurement Studio includes the following .NET class libraries:
•
Analysis
•
Common
•
DataSocket
•
Network Variable
•
NI-488.2
•
NI-DAQmx
•
NI-SCOPE
•
NI-VISA
•
User Interface
Refer to the following sections for information about each Measurement
Studio .NET class library.
© National Instruments Corporation
2-1
Measurement Studio User Manual
Chapter 2
Measurement Studio .NET Class Libraries
Analysis
The Measurement Studio Analysis .NET class library is in the
NationalInstruments.Analysis namespace. The Analysis class
library includes a set of classes that provides digital signal processing,
signal filtering, signal generation, peak detection, and other general
mathematical functionality. Use this library to analyze acquired data or to
generate data. Additionally, the documentation for the Analysis class
library includes analysis code snippets that you can copy and paste into an
application and use immediately.
The functionality included in the Analysis library varies based on the
Measurement Studio package you purchase. Refer to the following sections
for information about the Standard, Professional, and Enterprise Analysis
class libraries.
Standard Analysis
The Standard Analysis class library, which ships with Measurement Studio
Standard Edition, includes the sawtooth, sine, square, triangle, and basic
function wave generators.
Professional Analysis
The Professional Analysis class library, which ships with Measurement
Studio Professional Edition, includes the Standard Analysis functionality
as well as the following functionality:
Measurement Studio User Manual
•
Bessel, Chebyshev, Inverse Chebyshev, Windowed, Kaiser, and
Elliptic Low, High, Bandpass, and Bandstop filters
•
Signal processing functions such as convolution, deconvolution,
correlation, decimation, integration, and differentiation
•
FFT, Inverse FFT, Real FFT, Fast Hartley, Inverse Fast Hartley, Fast
Hilbert, Inverse Fast Hilbert, DST, Inverse DST, DCT, and Inverse
DCT transformations
•
Linear algebra functions such as determinant, check positive
definiteness, calculate dot product, and other various matrix functions
•
Scaled and unscaled windowing classes
•
Common statistical functions such as mean, median, mode, and
variance
•
Exponential, linear, and polynomial curve fitting functions
•
Signal generation functions
2-2
ni.com
Chapter 2
Measurement Studio .NET Class Libraries
Enterprise Analysis
The Enterprise Analysis class library, which ships with Measurement
Studio Enterprise Edition, includes the Standard and Professional Analysis
functionality as well as the following advanced functionality:
•
EquiRipple filters
•
Linear algebra functions such as forward and back substitution,
LU factorization, Cholesky factorization, Schur decomposition,
and Hessenberg decomposition
•
Probability and analysis of variance
•
Sinc, impulse, pulse, ramp, and chirp patterns
•
General least square curve fit, power fit, log fit, Gauss fit, cubic spline
fit, and interpolation functions
•
Measurement functions such as transition measurements, pulse
measurements, and cycle RMS average functions
•
Special functions
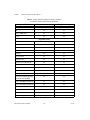
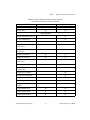
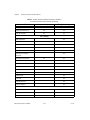
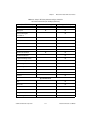
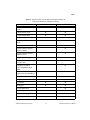
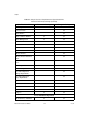
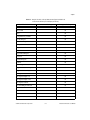
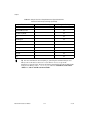
Refer to Table 2-1 to determine the type of measurements available in the
Professional and Enterprise Analysis .NET libraries.
Table 2-1. Analysis .NET Library Measurement Types included in
the Professional and Enterprise Packages
Analysis .NET Library
Professional Package
Enterprise Package
Measurements
AC and DC Estimator
✔
Amplitude and Phase
Spectrum
✔
Auto Power Spectrum
✔
Cross Power Spectrum
✔
Cycle RMS Average
✔
Harmonic Analyzer
✔
Harmonic Analyzer Using
Signal
✔
Impulse Response Function
✔
✔
Network Functions (avg)
✔
✔
© National Instruments Corporation
2-3
Measurement Studio User Manual
Chapter 2
Measurement Studio .NET Class Libraries
Table 2-1. Analysis .NET Library Measurement Types included in
the Professional and Enterprise Packages (Continued)
Analysis .NET Library
Professional Package
Enterprise Package
Power and Frequency Estimate
✔
Pulse Measurements
✔
Scaled Time Domain Window
✔
Single Tone Information
✔
Spectrum Unit Conversion
✔
State Levels
✔
Transfer Function
✔
Transition Measurements
✔
Signal Generation
Arbitrary Wave
✔
✔
Chirp Pattern
Gaussian White Noise
✔
✔
✔
Impulse Pattern
✔
Pulse Pattern
✔
Ramp Pattern
✔
Sawtooth Wave
✔
Sinc Pattern
✔
Sine Pattern
✔
✔
Sine Wave
✔
✔
Square Wave
✔
✔
Triangle Wave
✔
✔
Uniform White Noise
✔
✔
Windowing
Blackman Window
✔
✔
Blackman-Harris Window
✔
✔
Measurement Studio User Manual
2-4
ni.com
Chapter 2
Measurement Studio .NET Class Libraries
Table 2-1. Analysis .NET Library Measurement Types included in
the Professional and Enterprise Packages (Continued)
Analysis .NET Library
Professional Package
Enterprise Package
Blackman-Nuttall Window
✔
✔
Cosine Tapered Window
✔
✔
Dolph-Chebyshev Window
✔
✔
Exact Blackman Window
✔
✔
Exponential Window
✔
✔
Flat Top Window
✔
✔
Force Window
✔
✔
Gauss Window
✔
✔
General Cosine Window
✔
✔
Hamming Window
✔
✔
Hanning Window
✔
✔
Kaiser-Bessel Window
✔
✔
Scaled Time Domain Windows
✔
✔
Symmetric Time Domain
Windows
✔
✔
Triangle Window
✔
✔
Filters
Bessel
✔
✔
Butterworth
✔
✔
Cascade
✔
✔
Chebyshev
✔
✔
Elliptic
✔
✔
✔
Equiripple
FIR
✔
✔
FIR Windowed
✔
✔
© National Instruments Corporation
2-5
Measurement Studio User Manual
Chapter 2
Measurement Studio .NET Class Libraries
Table 2-1. Analysis .NET Library Measurement Types included in
the Professional and Enterprise Packages (Continued)
Analysis .NET Library
Professional Package
Enterprise Package
IIR Cascade
✔
✔
IIR
✔
✔
Inverse Chebyshev
✔
✔
Kaiser
✔
✔
Signal Processing
Autocorrelation
✔
✔
Convolution
✔
✔
Cross Power
✔
✔
Cross Correlation
✔
✔
Decimate
✔
✔
Deconvolution
✔
✔
Derivative x(t)
✔
✔
Discrete Cosine Transform
✔
✔
Discrete Sine Transform
✔
✔
Fast Hilbert Transform
✔
✔
Fast Hartley Transform
✔
✔
Integral x(t)
✔
✔
Inverse Real and Complex Fast
Fourier Transform (FFT)
✔
✔
Inverse Fast Hilbert Transform
✔
✔
Inverse Fast Hartley Transform
✔
✔
Peak Detection
✔
✔
Power Spectrum
✔
✔
Pulse Parameters
✔
✔
Real and Complex FFT
✔
✔
Measurement Studio User Manual
2-6
ni.com
Chapter 2
Measurement Studio .NET Class Libraries
Table 2-1. Analysis .NET Library Measurement Types included in
the Professional and Enterprise Packages (Continued)
Analysis .NET Library
Professional Package
Enterprise Package
Threshold Peak Detector
✔
✔
Unwrap Phase
✔
✔
Linear Algebra
Back Transform Eigen Vectors
✔
Backward Substitution
✔
Cholesky Factorization
✔
Complex Back Transform
Eigen Vectors
✔
Complex Cholesky
Factorization
✔
Complex Determinant
✔
✔
Complex Dot Product
✔
✔
Complex Eigen Vectors and
Eigen Values
✔
Complex General Eigen AB
✔
Complex Hessenberg
Decomposition
✔
Complex Inverse Matrix
✔
Complex Linear Equations
✔
Complex LU Factorization
✔
Complex Matrix Balance
✔
Complex Matrix Condition
Number
✔
✔
Complex Matrix Norm
✔
✔
Complex Matrix Rank
✔
✔
Complex Outer Product
✔
✔
© National Instruments Corporation
2-7
Measurement Studio User Manual
Chapter 2
Measurement Studio .NET Class Libraries
Table 2-1. Analysis .NET Library Measurement Types included in
the Professional and Enterprise Packages (Continued)
Analysis .NET Library
Complex Pseudo Inverse
Matrix
Professional Package
Enterprise Package
✔
✔
Complex QR Factorization
✔
Complex QR Factorization
with Pivot Matrix
✔
Complex QR Factorization
with Pivot Vector
✔
Complex QZ Decomposition
✔
Complex Schur
Decomposition
✔
Complex Solve Linear
Equations (Multiple Right
Hand)
✔
Complex Solve Linear
Equations (Single Right Hand)
✔
Complex SVD Factorization
✔
Complex Vector Norm
✔
Determinant
✔
✔
Dot Product
✔
✔
Forward Substitution
✔
General Eigen AB
✔
Hessenberg Decomposition
✔
Inverse Matrix
✔
✔
Linear Equations
✔
LU Factorization
✔
Matrix Balance
✔
Matrix Condition Number
✔
✔
Matrix Multiplication
✔
✔
Measurement Studio User Manual
2-8
ni.com
Chapter 2
Measurement Studio .NET Class Libraries
Table 2-1. Analysis .NET Library Measurement Types included in
the Professional and Enterprise Packages (Continued)
Analysis .NET Library
Professional Package
Enterprise Package
Matrix Norm
✔
✔
Matrix Rank
✔
✔
Outer Product
✔
✔
Pseudo Inverse Matrix
✔
✔
QR Factorization
✔
QR Factorization with Pivot
Matrix
✔
QR Factorization with Pivot
Vector
✔
QZ Decomposition
✔
Schur Decomposition
✔
Solve Linear Equations
(Multiple Right Hand)
✔
Solve Linear Equations
(Single Right Hand)
✔
Special Matrix
✔
✔
✔
SVD Factorization
Test Positive Definite Matrix
✔
✔
Trace
✔
✔
Transpose
✔
✔
Array and Numeric Operations
1D and 2D Array Arithmetic
✔
✔
1D and 2D Linear Evaluation
✔
✔
1D and 2D Polynomial
Evaluation
✔
✔
1D Polar to Rectangular
✔
✔
1D Rectangular to Polar
✔
✔
© National Instruments Corporation
2-9
Measurement Studio User Manual
Chapter 2
Measurement Studio .NET Class Libraries
Table 2-1. Analysis .NET Library Measurement Types included in
the Professional and Enterprise Packages (Continued)
Analysis .NET Library
Professional Package
Enterprise Package
Complex Number Arithmetic
✔
✔
Find Polynomial Roots
✔
✔
Scale 1D and 2D
✔
✔
Curve Fitting
✔
Cubic Spline Fit
Exponential Fit
✔
✔
Exponential Fit Interval
✔
Gauss Fit
✔
Gauss Fit Interval
✔
General Least Squares
Linear Fit
✔
General Polynomial Fit
✔
✔
Goodness of Fit
Linear Fit
✔
✔
✔
Linear Fit Interval
✔
Logarithm Fit
✔
Logarithm Fit Interval
✔
Nonlinear Fit
✔
Power Fit
✔
Power Fit Interval
✔
Remove Outliers
✔
Statistics
1D, 2D, and 3D ANOVA
✔
Chi-Square Distribution
✔
erf(x) and erfc(x)
✔
Measurement Studio User Manual
2-10
ni.com
Chapter 2
Measurement Studio .NET Class Libraries
Table 2-1. Analysis .NET Library Measurement Types included in
the Professional and Enterprise Packages (Continued)
Analysis .NET Library
Professional Package
✔
F-Distribution
Histogram
Enterprise Package
✔
✔
Inverse Chi-Square
Distribution
✔
Inverse F-Distribution
✔
Inverse Normal Distribution
✔
Inverse T-Distribution
✔
Mean
✔
✔
Median and Mode
✔
✔
Moment about Mean
✔
✔
Normal Distribution
✔
Polynomial Interpolation
✔
Root-Mean-Square (RMS)
✔
✔
Spline Interpolant
✔
Spline Interpolation
✔
Standard Deviation
✔
✔
T-Distribution
✔
Variance
✔
Special Functions
Airy
✔
Bessel 1st
✔
Bessel 2nd
✔
Beta
✔
Complimentary Gamma
✔
Cosine Integral
✔
© National Instruments Corporation
2-11
Measurement Studio User Manual
Chapter 2
Measurement Studio .NET Class Libraries
Table 2-1. Analysis .NET Library Measurement Types included in
the Professional and Enterprise Packages (Continued)
Analysis .NET Library
Professional Package
Enterprise Package
Dawson’s Integral
✔
Dilogarithm
✔
Elliptic 1st
✔
Elliptic 2nd
✔
Exponential Integral
✔
Factorial
✔
Fresnel Integrals
✔
Gamma
✔
Gauss Hypergeometric
✔
Hyperbolic Cosine Integral
✔
Hyperbolic Sine Integral
✔
Incomplete Beta
✔
Incomplete Elliptic 1st
✔
Incomplete Elliptic 2nd
✔
Incomplete Gamma
✔
Jacobian Elliptic Function
✔
Kelvin 1st
✔
Kelvin 2nd
✔
Kummer
✔
Logarithm of Factorial
✔
Modified Bessel 1st
✔
Modified Bessel 2nd
✔
Parabolic Cylinder
✔
Psi
✔
Sine Integral
✔
Measurement Studio User Manual
2-12
ni.com
Chapter 2
Measurement Studio .NET Class Libraries
Table 2-1. Analysis .NET Library Measurement Types included in
the Professional and Enterprise Packages (Continued)
Analysis .NET Library
Professional Package
Enterprise Package
Spherical Bessel 1st
✔
Spherical Bessel 2nd
✔
Stirling
✔
Struve
✔
Tricomi
✔
Zeta
✔
For more information about analyzing or generating data with the Analysis class
library, refer to the Using the Measurement Studio Analysis .NET Library topic in the
NI Measurement Studio Help. For more information about the functionality included in the
Analysis class library, visit ni.com/analysis and select Visual Basic, Visual Basic
.NET, C++, and C# with Measurement Studio.
Tip
Common
The Measurement Studio Common .NET class library is in the
NationalInstruments namespace. The Common class library provides
a set of classes that facilitates the exchange of data between the acquisition,
analysis, and user interface portions of your application. The Common
class library includes the following features:
•
A ComplexDouble data type. This data type represents a complex
number of type Double that is composed of a real part and an
imaginary part.
•
A DigitalWaveform data type. This data type represents a set of
digital states that are grouped by samples or signals.
•
A ComplexWaveform data type. This data type represents an analog
signal that varies over time and is composed of complex data values.
•
An AnalogWaveform data type. This data type represents an analog
signal that varies over time.
•
A DataConverter class that converts data from one data type to
another data type, such as converting an array of integers to an array of
doubles.
© National Instruments Corporation
2-13
Measurement Studio User Manual
Chapter 2
Measurement Studio .NET Class Libraries
•
An EngineeringFormatInfo class that defines a custom formatter
to format numeric values as strings with engineering notation and
International System of Units (SI) prefixes and symbols.
•
A PrecisionWaveformTiming class that you can use to represent
the timing of an analog or digital waveform that is accurate to the
nearest 2-64 second.
•
An AnalogWaveformCollection class that contains a strongly
typed collection of AnalogWaveform<TData> objects; one object for
each channel and record combination. You can access these objects
through the 1D indexer or the 2D indexer.
For more detailed information about the Common class library, refer to the
National Instruments section in the NI Measurement Studio Help.
Tip
Data Transfer
You can use the NetworkVariable class library or the DataSocket class
library to transfer live measurement data between applications over a
network. You can use NetworkVariable or DataSocket to exchange
different types of data between Measurement Studio, LabVIEW,
LabWindows/CVI, and other applications that support NI-Publish
Subscribe Protocol (psp:). NetworkVariable is the preferred method for
transferring data between these applications, and, in these cases,
NetworkVariable supersedes DataSocket. You can also use
NetworkVariable and DataSocket to exchange different types of data
between OLE for Process Control (opc:) servers. Exchanging data
between Measurement Studio applications and OPC servers with
NetworkVariable requires LabVIEW DSC Run-Time System. Use
DataSocket to communicate directly with an OPC server.
Network Variable
The Measurement Studio Network Variable .NET class library includes
three namespaces: NationalInstruments.NetworkVariable,
NationalInstruments.NetworkVariable.WindowsForms, and
NationalInstruments.NetworkVariable.WebForms. You use the
Network Variable class library to transfer live measurement data between
applications and servers over the network. You use WindowsForms and
WebForms data sources to expose Network Variable data items that you
can bind to properties of a Windows Forms or a Web Forms control.
Measurement Studio User Manual
2-14
ni.com
Chapter 2
Measurement Studio .NET Class Libraries
Use the features in the Network Variable class library to perform the
following operations:
•
Exchange different types of data between Measurement Studio,
LabVIEW, LabWindows/CVI, and other applications that support
NI-Publish Subscribe Protocol (psp:) and OLE for Process Control
(opc:) servers. Exchanging data between Measurement Studio
applications and OPC servers requires LabVIEW DSC.
Measurement Studio and LabWindows/CVI refer to variables as network variables
and LabVIEW refers to variables as shared variables. However, you can read to and write
from Measurement Studio and LabWindows/CVI network variables with LabVIEW
shared variables.
Note
•
Use Windows Forms and Web Forms data sources to expose Network
Variable data items that you can bind to properties of a Windows
Forms or a Web Forms control.
•
Use the NationalInstruments.NetworkVariable.Browser
classes to discover network variables and processes.
•
Use the NationalInstruments.NetworkVariable.
ServerProcess, NationalInstruments.NetworkVariable.
ServerProcessInfo, NationalInstruments.
NetworkVariable.ServerVariable, and
NationalInstruments.NetworkVariable.
ServerVariableInfo classes to explicitly create network variables.
•
Use the Network Variable Browser dialog box to quickly locate and
select data items on other computers and servers. The Browser Dialog
is included in the WindowsForms class.
For more detailed information about the Network Variable class library, refer to the
Using the Measurement Studio Network Variable .NET Library section in the
NI Measurement Studio Help.
Tip
DataSocket
The Measurement Studio DataSocket .NET class library is in the
NationalInstruments.Net namespace. Use the DataSocket class
library to transfer live measurement data over the Internet or an intranet,
between applications on the same computer, and to and from files. Use the
classes in the DataSocket class library to perform the following operations:
•
Read and write data between different data sources and targets.
•
Use a single, simple API to communicate with several types of servers,
including DataSocket Servers (dstp:), Web servers (http:), file
© National Instruments Corporation
2-15
Measurement Studio User Manual
Chapter 2
Measurement Studio .NET Class Libraries
transfer protocol servers (ftp:), file systems (file:), and OLE for
Process Control (opc:) servers.
•
Specify data sources and targets using a URL, the same way you access
Web pages in a Web browser.
•
Use DataSocket Transfer Protocol (DSTP) to exchange different types
of data.
•
Expose DataSocket data items as data sources that you can bind to
properties of a Windows Forms control.
•
Interactively browse to quickly locate and select data items on other
computers and servers.
For more detailed information about the DataSocket class library, refer to the Using
the Measurement Studio DataSocket .NET Library section in the NI Measurement Studio
Help.
Tip
NI-488.2
The Measurement Studio NI-488.2 .NET class library is in the
NationalInstruments.NI4882 namespace. This class library is
included when you install the NI-488.2 driver. The NI-488.2 driver is
available at ni.com/downloads. The NI-488.2 class library includes a set
of classes for communicating with GPIB instruments, controlling GPIB
devices, and acquiring GPIB status information. Use this library to design
code that communicates with and controls instruments on a GPIB interface.
Use the NI-488.2 class library to configure and communicate with GPIB
devices using the Device and Board classes.
For more information about the NI-488.2 class library, refer to the Using the
Measurement Studio NI-488.2 .NET Library topic in the NI Measurement Studio Help.
For more information about GPIB visit ni.com/gpib.
Tip
NI-DAQmx
The Measurement Studio NI-DAQmx .NET class library is in the
NationalInstruments.DAQmx namespace. This class library is
included when you install the NI-DAQmx driver. The NI-DAQmx driver
is available at ni.com/downloads. Use the NI-DAQmx class library to
communicate with and control NI data acquisition (DAQ) devices.
Some DAQ devices are not currently supported by the NI-DAQmx driver. Refer to
the NI-DAQ Readme for a complete listing of supported hardware.
Note
Measurement Studio User Manual
2-16
ni.com
Chapter 2
Measurement Studio .NET Class Libraries
Use the NI-DAQmx class library to perform the following types of tasks:
•
Analog signal measurement
•
Analog signal generation
•
Digital I/O
•
Counting and timing
•
Pulse generation
•
Signal switching
Tip For more information about the NI-DAQmx class library, refer to the Using the
Measurement Studio NI-DAQmx.NET Library topic in the NI Measurement Studio Help.
For more information about DAQ, visit ni.com/dataacquisition.
NI-SCOPE
The .NET class libraries for NI-SCOPE include .NET APIs for NI-Scope,
NI-TClk, and NI-ModInst instrument drivers. These class libraries provide
a .NET interface to the underlying driver API. You can use the .NET class
libraries to create and configure NI-SCOPE components programmatically
and at design time.
For further information on NI-SCOPE .NET driver support and to download the
NI-SCOPE .NET class libraries, refer to NI-SCOPE .NET Driver Support at NI Developer
Zone, ni.com/devzone.
Tip
NI-VISA
The Measurement Studio NI-VISA .NET class library is in the
NationalInstruments.VisaNS namespace. This class library is
included when you install the NI-VISA driver. The NI-VISA driver is
available at ni.com/downloads. The NI-VISA class library includes a set
of classes that provides a rich, object-oriented interface to the NI-VISA
driver. Use this library to quickly create bus-independent or bus-specific
instrument control applications.
The NI-VISA class library supports formatted I/O operations, locking,
event handling, and interface-specific extensions. With this class library
you can access the functionality available in NI-VISA for communicating
with message-based and register-based instruments using the following
interfaces:
•
GPIB
•
IEEE 1394
© National Instruments Corporation
2-17
Measurement Studio User Manual
Chapter 2
Measurement Studio .NET Class Libraries
•
PXI
•
Serial (RS-232 and RS-485)
•
TCP/IP
•
USB
•
VXI
For information about creating a Measurement Studio NI-VISA application using the
Instrument I/O Assistant, refer to the Creating an Instrument Control Application section
in Chapter 4, Measurement Studio Integrated Tools and Features or the Walkthrough:
Creating a Measurement Studio Instrument I/O Application in Chapter 5, Getting Started
with Measurement Studio. For more information about NI-VISA, visit ni.com/visa.
Tip
User Interface
The Measurement Studio user interface controls are in the Windows Forms
and Web Forms .NET class libraries. The following sections list the
functionality included with the Measurement Studio Windows Forms and
Web Forms controls.
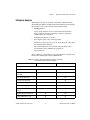
Refer to Table 2-2 for the UI controls provided by Measurement Studio.
Table 2-2. Measurement Studio User Interface Controls
User Interface Controls
Windows Forms
Web Forms
Waveform graph
✔
✔
Scatter graph
✔
✔
Digital waveform graph
✔
✔
Complex graph
✔
✔
Legend
✔
✔
Knob
✔
✔
Gauge
✔
✔
Meter
✔
✔
Slide
✔
✔
Thermometer
✔
✔
Tank
✔
✔
Measurement Studio User Manual
2-18
ni.com
Chapter 2
Measurement Studio .NET Class Libraries
Table 2-2. Measurement Studio User Interface Controls (Continued)
User Interface Controls
Windows Forms
Web Forms
Numeric edit
✔
✔
Switch
✔
✔
LED
✔
✔
Property editor
✔
Array controls
✔
✔
AutoRefresh control
✔
InstrumentControlStrip
control
Windows Forms Controls
The Windows Forms .NET class library is in the
NationalInstruments.UI.WindowsForms namespace. The Windows
Forms class library encapsulates the following Measurement Studio user
interface controls:
•
Waveform graph
•
Scatter graph
•
Digital waveform graph
•
Complex graph
•
Legend
•
Knob
•
Gauge
•
Meter
•
Slide
•
Thermometer
•
Tank
•
Numeric edit
•
Switch
•
LED
•
Property editor
•
Array controls
© National Instruments Corporation
2-19
Measurement Studio User Manual
Chapter 2
Measurement Studio .NET Class Libraries
Use this class library to add measurement-specific user interface controls
to your application. You can configure the controls programmatically at
design time, through the Properties window in the Windows Forms
Designer, or at run time with the property editor control. The following
sections describe each of the Measurement Studio Windows Forms user
interface controls.
For more information about using the .NET user interface controls, refer to the Using
the Measurement Studio Windows Forms .NET Controls section in the NI Measurement
Studio Help.
Tip
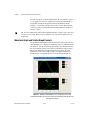
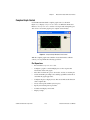
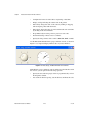
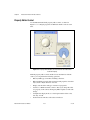
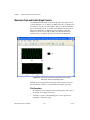
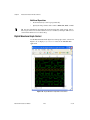
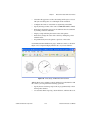
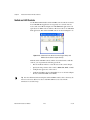
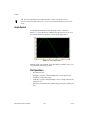
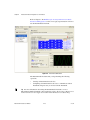
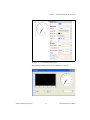
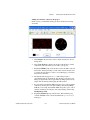
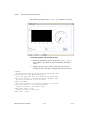
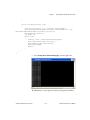
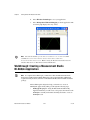
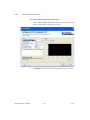
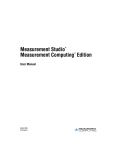
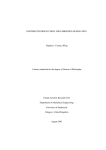
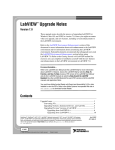
Waveform Graph and Scatter Graph Controls
Use the Measurement Studio waveform graph and scatter graph controls, as
shown in Figure 2-1, to display two-dimensional data on a Windows Forms
user interface. Use the waveform graph to display two-dimensional linear
data. You explicitly specify each value in one dimension and provide an
initial value and interval to implicitly specify the values in the other
dimension. Use the scatter graph to display two-dimensional linear or
nonlinear data: you explicitly specify each value in both dimensions.
Figure 2-1. Waveform Graph Windows Forms Control with Cursors and
Scatter Graph Windows Forms Control with XY Point Annotation; Both Graphs Have
Corresponding Legends
Measurement Studio User Manual
2-20
ni.com
Chapter 2
Measurement Studio .NET Class Libraries
With the waveform graph and scatter graph controls and the classes that
interface with the controls, you can perform the following operations:
Plot Operations
•
Plot and chart arrays of double-precision floating point values, analog
waveforms, and complex waveforms.
•
Configure a graph to contain multiple plots to show separate but
related data on the same graph.
•
Draw lines or fills from a plot to an X value, Y value, or another plot.
•
Specify plots in the scatter graph control as X and Y data. Specify plots
in the waveform graph control as X or Y data and optionally with date
and time scaling.
•
Use the extensible plot and plot area drawing capabilities and events to
customize the graph appearance.
•
Use plot data tooltips to display X and Y coordinates when a user
hovers the mouse over a data point.
•
Create custom point and line styles for plots.
•
Specify anti-aliased plots for plot lines.
•
Calculate and display error bands.
Axis Operations
•
Configure a graph to include multiple axes or independent ranges so
that plot data fits the graph plot area.
•
Configure the axis modes to: fixed; autoscaling, including autoscaling
based on the visible data only; strip chart; or scope chart.
•
Use logarithmic axes with configurable bases.
•
Interactively change the range of an axis and invert the axis at run time
by clicking on the axis end labels.
•
Display origin lines.
•
Display captions on the axis.
•
Display grid lines.
•
Position the axis to display on one or both sides of the graph’s plot
area.
•
Configure major, minor, and custom divisions and origin lines.
© National Instruments Corporation
2-21
Measurement Studio User Manual
Chapter 2
Measurement Studio .NET Class Libraries
Cursor Operations
•
Use cursors to identify key points in plots and the plot area.
•
Configure cursor snap modes to be fixed, floating, nearest point, or
to plot.
•
Use cursor labels to display X and Y data coordinates in a customized
format that the cursor crosshair points to, and customize the text font
and colors of the label.
•
Create custom point and line styles for cursors.
•
Interactively move the cursor by clicking and dragging the vertical or
horizontal crosshair or the center of the cursor.
•
Programmatically move the cursor to previous or next position or to a
specified coordinate.
Annotation Operations
•
Configure text labels, arrows, and drawing shapes to annotate a point
anywhere in the plot area of the graph.
•
Configure range area, text labels, and arrows to annotate a range in the
plot area of the graph.
•
Show tooltips configured to display data or other custom text.
Additional Operations
•
Pan and zoom interactively, as well as programatically.
•
Copy the graph as a BMP, GIF, JPEG, or PNG image to the clipboard
or a file.
•
Perform hit testing of mouse cursor coordinates.
•
Bind a plot to a data source on the waveform graph.
For more information about using the waveform and scatter graph controls, refer to
the Using the Measurement Studio Windows Forms Scatter and Waveform Graph .NET
Controls section in the NI Measurement Studio Help.
Tip
Measurement Studio User Manual
2-22
ni.com
Chapter 2
Measurement Studio .NET Class Libraries
Digital Waveform Graph Control
Use the Measurement Studio digital waveform graph control, as shown in
Figure 2-2, to display DigitalWaveform data on a Windows Forms user
interface.
Figure 2-2. Digital Graph Windows Forms Control
With the digital waveform graph control and the classes that interface with
the control, you can perform the following operations:
Plot Operations
•
Plot digital waveform data. Data values can represent up to eight
different digital states.
•
Configure plot labels on the y-axis.
•
Configure plot templates to customize plots that are implicitly created
from plotted data.
•
Specify anti-aliased digital plots.
•
Expand and collapse signal plots interactively or programmatically.
•
Display tooltips.
© National Instruments Corporation
2-23
Measurement Studio User Manual
Chapter 2
Measurement Studio .NET Class Libraries
Waveform Sample and Signal State Operations
•
Simultaneously display waveforms and signals or display signals only.
•
Create custom waveform sample and signal state styles.
•
Configure the appearance of sample and state labels.
•
Create custom waveform sample and signal state labels.
Axis Operations
•
Configure the axis modes to fixed, exact autoscaling, or loose
autoscaling.
•
Interactively change the range of an axis and invert the axis at run time
by clicking on the axis end labels.
•
Display captions on the axis.
•
Display grid lines.
•
Position the axis to display on one or both sides of the graph’s plot
area.
•
Configure major, minor, and custom divisions.
Additional Operations
•
Display data in sample or time mode.
•
Perform hit testing of mouse cursor coordinates.
•
Pan with scroll bars.
•
Configure the style and mode of scroll bars.
•
Create custom scroll bars.
•
Pan and zoom interactively and programmatically.
•
Copy the graph as a BMP, GIF, JPEG, or PNG image to the clipboard
or a file.
For more information about using the digital waveform graph control, refer to the
Using the Measurement Studio Windows Forms Digital Waveform Graph .NET Control
section in the NI Measurement Studio Help.
Tip
Measurement Studio User Manual
2-24
ni.com
Chapter 2
Measurement Studio .NET Class Libraries
Complex Graph Control
Use the Measurement Studio complex graph control, as shown in
Figure 2-3, to display ComplexDouble data on a Windows Forms user
interface. A ComplexDouble consists of a real part and an imaginary part.
You can use a waveform graph to plot complex waveform data.
Figure 2-3. Complex Graph Windows Forms Control
With the complex graph control and the classes that interface with the
control, you can perform the following operations:
Plot Operations
•
Plot and chart ComplexDouble data.
•
Configure a graph to contain multiple plots to show separate but
related data on the same graph.
•
Draw lines or fills from a plot to an X value, Y value, or another plot.
•
Use the extensible plot and plot area drawing capabilities and events to
customize the graph appearance.
•
Configure the plot to display arrows. The arrows indicate the direction
of the complex data.
•
Create custom point and line styles for plots.
•
Specify anti-aliased plots for plot lines.
•
Calculate and display error bands.
•
Display tooltips.
© National Instruments Corporation
2-25
Measurement Studio User Manual
Chapter 2
Measurement Studio .NET Class Libraries
Axis Operations
•
Configure a graph to include multiple axes or independent ranges so
that plot data fits the graph plot area.
•
Configure the axis modes to: fixed; autoscaling, including autoscaling
based on the visible data only; strip chart; or scope chart.
•
Interactively change the range of an axis and invert the axis at run time
by clicking on the axis end labels.
•
Display origin lines and grid lines.
•
Configure major, minor, and custom divisions and origin lines.
•
Position the axis to display on one or both sides of the graph’s plot
area.
•
Display captions on the axis.
Cursor Operations
•
Use cursors to identify key points in plots and the plot area.
•
Configure cursor snap modes to be fixed, floating, nearest point, or to
plot.
•
Use cursor labels to display X and Y data coordinates that the cursor
crosshair points to, and customize the text font and colors of the label.
•
Create custom point and line styles for cursors.
•
Configure the graph to display cursors that are used to determine the
real, imaginary, magnitude, and phase data coordinates of a point on
the plot area.
Annotation Operations
Measurement Studio User Manual
•
Configure text labels, arrows, and drawing shapes to annotate a point
anywhere in the plot area of the graph.
•
Configure range area, text labels, and arrows to annotate a range in the
plot area of the graph.
•
Annotate points and ranges of real, imaginary, and magnitude values.
•
Annotate and label a range of magnitude values for a particular phase.
2-26
ni.com
Chapter 2
Measurement Studio .NET Class Libraries
Additional Operations
•
Pan and zoom interactively.
•
Copy the graph as a BMP, GIF, JPEG, or PNG image to the clipboard
or a file.
For more information about using the complex graph control, refer to the Using the
Measurement Studio Windows Forms Complex Graph .NET Control section in the
NI Measurement Studio Help.
Tip
Legend Control
Use the Measurement Studio legend control, as shown in Figure 2-1, to
display symbols and descriptions for a specific set of elements of another
object, such as the plots or cursors of a graph. When you associate the
legend control with another object, any changes you make to that object are
automatically reflected in the legend. For example, if you associate the
legend control with the plots of a graph, any changes you make in the plots
collection editor are automatically reflected in the legend.
For more information about using the legend control, refer to the Using the
Measurement Studio Windows Forms Legend .NET Control section in the NI Measurement
Studio Help.
Tip
Numeric Controls
Use the Measurement Studio numeric controls to display numerical
information, on a Windows Forms user interface, with the look of scientific
instruments. The numeric controls include a knob, gauge, meter, slide,
thermometer, and tank. The following sections describe operations
available with the controls and the classes that interface with them.
With all of the numeric controls and the classes that interface with them,
you can perform the following operations:
•
Configure the scale to be linear or logarithmic and toggle the visibility
of the scale.
•
Fill the scale and configure the range, color, dimensions, and style of
the fill.
•
Connect to the Measurement Studio .NET numeric edit control so that
if you change the value of one control, it changes the value of the other
control.
•
Customize the appearance of the control using 3D lab styles or classic
2D styles and change the color and length of ticks and labels.
© National Instruments Corporation
2-27
Measurement Studio User Manual
Chapter 2
Measurement Studio .NET Class Libraries
•
Configure the format of value labels to engineering or date/time.
•
Display tooltips reflecting the current value of the pointer.
•
Interactively change the value of the control by clicking or dragging
and moving the pointer with the mouse.
•
Interactively change the range of an axis and invert the axis at run time
by clicking on the axis end labels.
•
Programmatically move the pointer to previous or next value.
•
Perform hit testing of mouse cursor coordinates.
•
Specify the image format of the control as BMP, GIF, JPEG, or PNG.
Use the Measurement Studio knob, gauge, and meter controls, as shown in
Figure 2-4, to input and display numeric data on your user interface.
Figure 2-4. Knob, Gauge, and Meter Windows Forms Controls
With the knob, gauge, and meter controls and the classes that interface with
the controls, you can perform the following operations:
Measurement Studio User Manual
•
Specify the start and sweep angle of the arc programmatically or from
the Properties window.
•
Use automatic division spacing, custom divisions, and invert the scale.
2-28
ni.com
Chapter 2
Measurement Studio .NET Class Libraries
Use the Measurement Studio slide, tank, and thermometer controls, as
shown in Figure 2-5, to input and display numeric data on your interface.
Figure 2-5. .NET Slide, Tank, and Thermometer Controls
With the slide, tank, and thermometer controls and the classes that interface
with them, you can perform the following operations:
•
Fill to the minimum or maximum value of the scale.
•
Position the scale horizontally with left, right, or both and position the
scale vertically with top, bottom, or both.
For more information about using the Windows Forms knob, gauge, meter, slide,
tank, or thermometer controls, refer to the Knob, Gauge, Meter, Slide, Tank, or
Thermometer Class sections in the NI Measurement Studio Help.
Tip
Numeric Edit Control
Use the Measurement Studio numeric edit control, as shown in Figure 2-6,
to display numeric values and to provide a way by which end users can edit
numeric values. Typically, you use a numeric edit control to input or
display double numerical data instead of using a Windows Forms TextBox
or NumericUpDown control.
Figure 2-6. Numeric Edit Windows Forms Control
© National Instruments Corporation
2-29
Measurement Studio User Manual
Chapter 2
Measurement Studio .NET Class Libraries
With the numeric edit control and the classes that interface with the control
you can perform the following operations:
•
Use up and down buttons for easy incrementing and decrementing.
•
Perform range checking.
•
Set the minimum range value to negative infinity and the maximum
range value to positive infinity.
•
Create custom formats or use built-in numeric formats including
generic, engineering, and simple double. You can use these numeric
formats with other Measurement Studio user interface controls, such
as the waveform graph and numeric pointer controls.
•
Connect to a Measurement Studio numeric control so that if you
change the value of one control, it changes the value of the other
control.
•
Set the coercion mode property to discrete or continuous values. This
property configures the control to allow entry or display of either a
discrete set of values or any value.
•
Set the interaction mode to keyboard and mouse, keyboard only,
mouse only, or none.
For more information about using the Windows Forms numeric edit control, refer to
the NumericEdit Class section in the NI Measurement Studio Help.
Tip
Switch and LED Controls
Use the Measurement Studio switch and LED controls as Boolean controls
on a Windows Forms user interface. You typically use a switch control, as
shown in Figure 2-7, to receive and control Boolean input on an application
user interface.
Figure 2-7. Switch Windows Forms Control in Vertical Toggle 3D Style
Measurement Studio User Manual
2-30
ni.com
Chapter 2
Measurement Studio .NET Class Libraries
You typically use an LED control, as shown in Figure 2-8, to indicate a
Boolean value on an application user interface.
Figure 2-8. LED Windows Forms Control in Square 3D Style
With the switch and LED controls and the classes that interface with the
controls, you can perform the following operations:
•
Receive notification before or after the state of the control changes.
•
Configure how the control behaves when you click it with the mouse
or press the spacebar when the control has focus.
•
Configure the appearance of the control.
•
Make the control background transparent.
•
Configure the LED control to blink while it is on or off and configure
the rate at which the LED control blinks.
Tip For more information about using the switch and LED controls, refer to the Using the
Measurement Studio Windows Forms Switch and LED .NET Controls section in the
NI Measurement Studio Help.
© National Instruments Corporation
2-31
Measurement Studio User Manual
Chapter 2
Measurement Studio .NET Class Libraries
Property Editor Control
Use the Measurement Studio property editor control, as shown in
Figure 2-9, to configure properties for Windows Forms controls at run
time.
Figure 2-9. Property Editor Windows Forms Control for the Knob Control
Scale Arc Property
With the property editor control and the classes that interface with the
control, you can perform the following operations:
Measurement Studio User Manual
•
Edit any .NET type at run time, including collections.
•
Edit expandable properties that represent nested properties of another
object, such as major divisions of an axis.
•
Display custom editors and type converters for properties.
•
Connect to a Windows Forms control so that if you change the value
of a property of the control, the Property Editor updates to reflect the
change.
•
Configure the display mode as a visual representation of the value,
text-only, or both.
•
Set the interaction mode to edit values or indicator.
2-32
ni.com
Chapter 2
Measurement Studio .NET Class Libraries
For more information about using the property editor control, refer to the Using the
Measurement Studio Property Editor Control topic in the NI Measurement Studio Help.
Tip
Windows Forms Array Controls
You can create an array of Measurement Studio controls that behave as a
single unit. For example, you can use these array controls to visualize and
control ports of a digital line or values of an array. Measurement Studio
includes switch, LED, and numeric edit array controls. You can create
control arrays of other controls if those controls meet the constraints of the
generic type parameter TControl.
Switch and LED Array Controls
Use the Measurement Studio switch and LED array controls as an array of
Boolean controls on a Windows Forms user interface. You typically use a
switch array control, as shown in Figure 2-10, to control ports of a digital
line or values of an array. You typically use an LED array control, as shown
in Figure 2-10, to visualize ports of a digital line or values of an array.
Figure 2-10. Switch and LED Array Controls
With the switch and LED array controls and the classes that interface with
the controls, you can perform the following operations:
•
Set values by passing an array of data.
•
Modify the number of controls displayed based on the length of the
specified values.
•
Receive notification before or after the state of the control changes.
•
Configure how the control behaves when you click it with the mouse
or press the spacebar when the control has focus.
•
Configure the appearance of the control.
© National Instruments Corporation
2-33
Measurement Studio User Manual
Chapter 2
Measurement Studio .NET Class Libraries
•
Make the control background transparent.
•
Configure the LED controls to blink while they are on or off and
configure the rate at which the LED controls blink.
•
Configure the layout of the control to be horizontal or vertical.
•
Bind the value of the control to a data source.
•
Mark an array of Boolean controls so that only one can be true at a
time.
For more information about using the switch and LED array controls, refer to the
Using the Measurement Studio Control Array .NET Controls topic in the NI Measurement
Studio Help.
Tip
Numeric Edit Array Control
Use the Measurement Studio numeric edit array control, as shown in
Figure 2-11 to control and visualize values of an array of double values.
With the numeric edit array control and the classes that interface with the
control you can perform the following operations:
Figure 2-11. Numeric Edit Array control
Measurement Studio User Manual
•
Set values by passing an array of data.
•
Modify the number of controls displayed based on the length of the
array of values you specify.
•
Use up and down buttons for easy incrementing and decrementing.
•
Perform range checking.
•
Set the minimum range value to negative infinity and the maximum
range value to positive infinity.
•
Create custom formats or use built-in numeric formats including
generic, engineering, and simple double.
•
Connect to a numeric control so that if you change the value of one
control, it changes the value of the other control.
•
Set the coercion mode property to discrete or continuous values. This
property configures the control to allow entry or display of either a
discrete set of values or any value.
2-34
ni.com
Chapter 2
Measurement Studio .NET Class Libraries
•
Set the interaction mode to keyboard and mouse, keyboard only,
mouse only, or none.
•
Use the edit box to select text programmatically and to validate text
values.
•
Configure the layout of the control to be horizontal or vertical.
•
Bind the value of the control to a data source.
For more information about using the numeric edit array control, refer to the Using
the Measurement Studio Control Array .NET Controls topic in the NI Measurement Studio
Help.
Tip
InstrumentControlStrip Control
You can use the InstrumentControlStrip control as a toolbar for editing
property values of another control through the associated editors at run
time. For example, you can populate the InstrumentControlStrip with
ToolStripPropertyEditor items that edit property values of a waveform
graph through the associated editors at run time. The editor displayed by
the ToolStripPropertyEditor is the same editor that displays when you edit
the property at design time.
© National Instruments Corporation
2-35
Measurement Studio User Manual
Chapter 2
Measurement Studio .NET Class Libraries
Figure 2-12. InstrumentControlStrip Control
For more information about the InstrumentControlStrip control, refer to Using the
Measurement Studio Windows Forms Instrument Control Strip .NET Control topic in the
NI Measurement Studio Help.
Tip
Measurement Studio User Manual
2-36
ni.com
Chapter 2
Measurement Studio .NET Class Libraries
ASP.NET Web Forms Controls
The Measurement Studio ASP.NET user interface controls are in the Web
Forms .NET class library. The Web Forms .NET class library is in the
NationalInstruments.UI.WebForms namespace. The Web Forms
class library encapsulates the following Measurement Studio user interface
controls:
•
Waveform graph
•
Scatter graph
•
Digital waveform graph
•
Complex graph
•
Legend
•
Knob
•
Gauge
•
Meter
•
Slide
•
Thermometer
•
Tank
•
Numeric edit
•
Switch
•
LED
•
AutoRefresh
All Measurement Studio ASP.NET Web Forms controls for Visual Studio 2008 are
designed to work with ASP.NET AJAX controls. The Measurement Studio ASP.NET Web
Forms controls for Visual Studio 2005 are not designed to work with Microsoft ASP.NET
AJAX controls.
Note
Use this class library to add measurement-specific user interface controls
to your Web application. You can configure the controls programmatically
at design time or through the Properties window in the Web Forms
Designer. The following sections describe each of the Measurement Studio
Web Forms user interface controls.
© National Instruments Corporation
2-37
Measurement Studio User Manual
Chapter 2
Measurement Studio .NET Class Libraries
Waveform Graph and Scatter Graph Controls
Use the Measurement Studio waveform graph and scatter graph controls,
as shown in Figure 2-13, to display two-dimensional data on a Web-based
user interface. Use the waveform graph to display two-dimensional linear
data. You explicitly specify each value in one dimension and provide an
initial value and interval to implicitly specify the values in the other
dimension. Use the scatter graph to display two-dimensional linear or
nonlinear data: you explicitly specify each value in both dimensions.
Figure 2-13. Waveform Graph and Scatter Graph Web Forms Controls;
Both Graphs Have Corresponding Legends
With the waveform graph and scatter graph controls and the classes that
interface with the controls, you can perform the following operations:
Plot Operations
Measurement Studio User Manual
•
Plot and chart arrays of double-precision floating point values, analog
waveforms, and complex waveforms.
•
Configure a graph to contain multiple plots to show separate but
related data on the same graph.
2-38
ni.com
Chapter 2
Measurement Studio .NET Class Libraries
•
Draw lines or fills from a plot to an X value, Y value, or another plot.
•
Specify plots in the scatter graph control as X and Y data. Specify plots
in the waveform graph control as X or Y data and optionally with date
and time scaling.
•
Use the extensible plot and plot area drawing capabilities and events to
customize the graph appearance.
•
Create custom point and line styles for plots.
•
Specify anti-aliased plots for plot lines.
•
Calculate and display error bands.
•
Configure plot to specify how data is saved and restored across HTTP
requests.
Axis Operations
•
Configure a graph to include multiple axes or independent ranges so
that plot data fits the graph plot area.
•
Configure the axis modes to: fixed; autoscaling, including autoscaling
based on the visible data only; strip chart; or scope chart.
•
Use logarithmic axes with configurable bases.
•
Interactively change the range of an axis and invert the axis at run time
by clicking on the axis end labels.
•
Configure major, minor, and custom divisions and origin lines.
Cursor Operations
•
Use cursors to identify key points in plots and the plot area.
•
Configure cursor snap modes to be floating, nearest point, or to plot.
•
Use cursor labels to display X and Y data coordinates in a customized
format that the cursor crosshair points to, and customize the text font
and colors of the label.
•
Create custom point and line styles for cursors.
•
Interactively move the cursor by clicking and dragging the vertical or
horizontal crosshair or the center of the cursor.
•
Programmatically move the cursor to previous or next position or to a
specified coordinate.
Annotation Operations
•
Configure text labels, arrows, and drawing shapes to annotate a point
anywhere in the plot area of the graph.
•
Configure range area, text labels, and arrows to annotate a range in the
plot area of the graph.
© National Instruments Corporation
2-39
Measurement Studio User Manual
Chapter 2
Measurement Studio .NET Class Libraries
Additional Operations
•
Zoom interactively as well as programatically.
•
Specify the image format of the control as BMP, GIF, JPEG, or PNG.
For more information about using the waveform and scatter graph controls, refer to
the Using the Measurement Studio Web Forms Scatter and Waveform Graph .NET Controls
section in the NI Measurement Studio Help.
Tip
Digital Waveform Graph Control
Use the Measurement Studio digital waveform graph control, as shown in
Figure 2-14, to display DigitalWaveform data in an ASP.NET Web
application.
Figure 2-14. Digital Waveform Graph Web Forms Control
Measurement Studio User Manual
2-40
ni.com
Chapter 2
Measurement Studio .NET Class Libraries
With the digital waveform graph control and the classes that interface with
the control, you can perform the following operations:
Plot Operations
•
Plot digital waveform data, including digital signal state data and
timing information.
•
Configure plot labels on the y-axis.
•
Configure plot templates to customize plots that are implicitly created
from plotted data.
•
Specify anti-aliased digital plots.
•
Expand and collapse signal plots interactively as well as
programmatically.
Waveform Sample and Signal State Operations
•
Simultaneously display waveforms and signals or display signals only.
•
Create custom waveform sample and signal state styles.
•
Configure the appearance of sample and state labels.
•
Create custom waveform sample and signal state labels.
Axis Operations
•
Configure the axis modes to fixed, exact autoscaling, or loose
autoscaling.
•
Interactively change the range of an axis and invert the axis at run time
by clicking on the axis end labels.
•
Display captions on the axis and grid lines.
•
Position the axis to display on one or both sides of the graph’s plot
area.
•
Configure major, minor, and custom divisions.
Additional Operations
•
Display data in sample or time mode.
•
Configure the style and mode of scroll bars.
•
Create custom scroll bars.
•
Zoom interactively as well as programmatically.
•
Specify the image format of the control as BMP, GIF, JPEG, or PNG.
© National Instruments Corporation
2-41
Measurement Studio User Manual
Chapter 2
Measurement Studio .NET Class Libraries
For more information about using the digital waveform graph control, refer to the
Using the Measurement Studio Web Forms Digital Waveform Graph .NET Control section
in the NI Measurement Studio Help.
Tip
Complex Graph Control
Use the Measurement Studio complex graph control, as shown in
Figure 2-15, to display ComplexDouble data on a ASP.NET Web
application. A ComplexDouble consists of a real part and an imaginary
part. You can use a waveform graph to plot complex waveform data.
Figure 2-15. Complex Graph Web Forms Control
With the complex graph control and the classes that interface with the
control, you can perform the following operations:
Plot Operations
Measurement Studio User Manual
•
Plot and chart ComplexDouble data.
•
Configure a graph to contain multiple plots to show separate but
related data on the same graph.
•
Draw lines or fills from a plot to an X value, Y value, or another plot.
•
Use the extensible plot and plot area drawing capabilities and events to
customize the graph appearance.
•
Configure the plot to display arrows. The arrows indicate the direction
of the complex data.
2-42
ni.com
Chapter 2
Measurement Studio .NET Class Libraries
•
Create custom point and line styles for plots.
•
Specify anti-aliased plots for plot lines.
•
Calculate and display error bands.
•
Configure plot to specify how data is saved and restored across HTTP
requests.
Axis Operations
•
Configure a graph to include multiple axes or independent ranges so
that plot data fits the graph plot area.
•
Configure the axis modes to: fixed; autoscaling, including autoscaling
based on the visible data only; strip chart; or scope chart.
•
Interactively change the range of an axis and invert the axis at run time
by clicking on the axis end labels.
•
Display origin lines, captions on the axis, and grid lines.
•
Position the axis to display on one or both sides of the graph’s plot
area.
•
Configure major, minor, and custom divisions and origin lines.
Cursor Operations
•
Use cursors to identify key points in plots and the plot area.
•
Configure cursor snap modes to be floating, nearest point, or to plot.
•
Use cursor labels to display real, imaginary, magnitude, or phase data
that the cursor crosshair points to, and customize the text font and
colors of the label.
•
Create custom point and line styles for cursors.
•
Interactively move the cursor by clicking and dragging the vertical or
horizontal crosshair or the center of the cursor.
•
Programmatically move the cursor to previous or next position or to a
specified coordinate.
Annotation Operations
•
Configure text labels, arrows, and drawing shapes to annotate a point
anywhere in the plot area of the graph.
•
Configure range area, text labels, and arrows to annotate a range in the
plot area of the graph.
© National Instruments Corporation
2-43
Measurement Studio User Manual
Chapter 2
Measurement Studio .NET Class Libraries
•
Annotate and label a magnitude value.
•
Annotate and label a range of magnitude values for a particular phase.
Additional Operations
•
Zoom interactively as well as programmatically.
•
Specify the image format of the control as BMP, GIF, JPEG, or PNG.
For more information about using the complex graph control, refer to the Using the
Measurement Studio Web Forms Complex Graph .NET Control section in the
NI Measurement Studio Help.
Tip
Legend Control
Use the Measurement Studio legend control, as shown in Figure 2-13, to
display symbols and descriptions for a specific set of elements of another
object, such as the plots or cursors of a graph. When you associate the
legend control with another object, any changes you make to that object are
automatically reflected in the legend. For example, if you associate the
legend control with the plots of a graph, any changes you make in the plots
collection editor are automatically reflected in the legend.
For more information about using the legend control, refer to the Using the
Measurement Studio Web Forms Legend .NET Control section in the NI Measurement
Studio Help.
Tip
Numeric Controls
Use the Measurement Studio numeric controls to display numerical
information in an ASP.NET Web application with the look of scientific
instruments. The numeric controls include a knob, gauge, meter, slide,
thermometer, and tank. The following sections describe operations
available with the controls and the classes that interface with them.
With all of the numeric controls and the classes that interface with them,
you can perform the following operations:
Measurement Studio User Manual
•
Configure the scale to be linear or logarithmic and toggle the visibility
of the scale.
•
Fill the scale and configure the range, color, dimensions, and style of
the fill.
•
Connect to a Measurement Studio .NET numeric edit control so that if
you change the value of one control, it changes the value of the other
control.
2-44
ni.com
Chapter 2
Measurement Studio .NET Class Libraries
•
Customize the appearance of the control using 3D lab styles or classic
2D styles and change the color and length of ticks and labels.
•
Configure the format of value labels to engineering or date/time.
•
Specify the image format of the control as BMP, GIF, JPEG, or PNG.
•
Interactively change the range of an axis and invert the axis at run time
by clicking on the axis end labels.
•
Display tooltips reflecting the current value of the pointer.
•
Interactively change the value of the control by clicking the pointer
with the mouse.
•
Programmatically move the pointer to previous or next value.
Use the Measurement Studio knob, gauge, and meter controls, as shown in
Figure 2-16, to input and display numeric data on your user interface.
Figure 2-16. Knob, Gauge, and Meter Web Forms Controls
With the knob, gauge, and meter controls and the classes that interface with
the controls, you can perform the following operations:
•
Specify the start and sweep angle of the arc programmatically or from
the Properties window.
•
Use automatic division spacing, custom divisions, and invert the scale.
© National Instruments Corporation
2-45
Measurement Studio User Manual
Chapter 2
Measurement Studio .NET Class Libraries
Use the Measurement Studio slide, tank, and thermometer controls, as
shown in Figure 2-17, to input and display numeric data on your interface.
Figure 2-17. Slide, Tank, and Thermometer Web Forms Controls
With the slide, tank, and thermometer controls and the classes that interface
with them, you can perform the following operations:
•
Fill to the minimum or maximum value of the scale.
•
Position the scale horizontally with left, right, or both and position the
scale vertically with top, bottom, or both.
For more information about using the Web Forms knob, gauge, meter, slide, tank, or
thermometer controls, refer to the Knob, Gauge, Meter, Slide, Tank, or Thermometer Class
sections in the NI Measurement Studio Help.
Tip
Measurement Studio User Manual
2-46
ni.com
Chapter 2
Measurement Studio .NET Class Libraries
Numeric Edit Control
Use the Measurement Studio numeric edit control, as shown in
Figure 2-18, to display numeric values and to provide a way by which end
users can edit numeric values. Typically, you use a numeric edit control to
input or display double numerical data instead of using a Web Forms
TextBox control.
Figure 2-18. Numeric Edit Web Forms Control
With the numeric edit control and the classes that interface with the control
you can perform the following operations:
•
Perform range checking.
•
Set the minimum range value to negative infinity and the maximum
range value to positive infinity.
•
Create custom formats or use built-in numeric formats including
generic, engineering, and simple double. You can use these numeric
formats with other Measurement Studio user interface controls, such
as the waveform graph and numeric pointer controls.
•
Connect to a Measurement Studio numeric control so that if you
change the value of one control, it changes the value of the other
control.
•
Set the coercion mode property to discrete or continuous values. This
property configures the control to allow entry or display of either a
discrete set of values or any value.
•
Validate and format data without posting back to the Web server.
For more information about using the Web Forms numeric edit control, refer to the
NumericEdit Class section in the NI Measurement Studio Help.
Tip
© National Instruments Corporation
2-47
Measurement Studio User Manual
Chapter 2
Measurement Studio .NET Class Libraries
Switch and LED Controls
Use the Measurement Studio switch and LED controls as Boolean controls
in an ASP.NET Web application. You typically use a switch control to
receive and control Boolean input in an ASP.NET Web application. You
typically use an LED control to indicate a Boolean value on an ASP.NET
Web application. The switch and LED controls are shown in Figure 2-19.
Figure 2-19. Switch Web Forms Control in Vertical Toggle 3D Style and
LED Web Forms Control in Square 3D Style
With the switch and LED controls and the classes that interface with the
controls, you can perform the following operations:
•
Receive notification before or after the state of the control changes.
•
Specify the image format of the control as BMP, GIF, JPEG, or PNG.
•
Configure the appearance of the control.
•
Configure the LED control to blink while it is on or off and configure
the rate at which the LED control blinks.
Tip For more information about using the switch and LED controls, refer to the Using the
Measurement Studio Web Forms Switch and LED .NET Controls section in the
NI Measurement Studio Help.
Measurement Studio User Manual
2-48
ni.com
Chapter 2
Measurement Studio .NET Class Libraries
AutoRefresh Control
Use the AutoRefresh control to update a Web control or a group of Web
controls on the client at a specified interval.
The AutoRefresh control uses the ASP.NET client callback architecture to
update a control or a group of controls at a specified interval. The
AutoRefresh control sets up a timer inside the browser using Javascript.
When the timer elapses, the AutoRefresh updates the controls in the
AutoRefresh group. For down-level browsers, the controls update when the
page posts back to the server. If the client browser supports client callbacks,
the client-side script rendered by the AutoRefresh control uses a client
callback to update the associated controls on the client without posting the
page back to the server.
The AutoRefresh control is designed to work with the ASP.NET AJAX UpdatePanel
and Timer controls in Visual Studio 2008.
Note
AutoRefresh Callback
This feature provides a mechanism for updating the
RefreshManager.Enabled and AutoRefresh.Interval properties
for AutoRefresh from within the AutoRefresh.Refresh callback,
allowing you to turn off the AutoRefresh or change the Interval during an
asynchronous HTTP request without causing a postback.
© National Instruments Corporation
2-49
Measurement Studio User Manual
Measurement Studio Visual C++
Class Libraries
3
This chapter provides overview information about the Visual C++ class
libraries that are available with Measurement Studio. Measurement Studio
Visual C++ support for Visual Studio .NET 2003 and Visual Studio 2005 is
the same, except where noted. Refer to the Using the Measurement Studio
Visual C++ Class Libraries section of the NI Measurement Studio Help for
detailed information about these libraries.
Measurement Studio 8.5 support for Visual Studio 2008 does not include Visual
C++ class libraries.
Note
Measurement Studio Visual C++ Class Library Overview
Measurement Studio provides libraries of MFC-based classes that you can
use to develop complete measurement and automation applications in
Visual C++.
Measurement Studio includes the following Visual C++ class libraries:
•
3D Graph
•
Analysis
•
Common
•
DataSocket
•
Microsoft Excel Interface
•
Microsoft Word Interface
•
NI-488.2
•
NI-DAQmx
•
NI-Reports
•
NI-VISA
•
User Interface
•
Utility
© National Instruments Corporation
3-1
Measurement Studio User Manual
Chapter 3
Refer to the following sections for information about each Measurement
Studio Visual C++ class library.
ActiveX Controls in Visual C++
ActiveX controls are specialized COM servers that implement a specific set
of interfaces. The Measurement Studio Visual C++ button, graph, knob,
numeric edit, slide, and 3D graph are ActiveX controls. Measurement
Studio includes classes that provide native C++ interfaces to the ActiveX
controls. For example, the CNiGraph class provides an interface to the
CWGraph ActiveX graph control.
The Measurement Studio classes that provide interfaces to the
Measurement Studio ActiveX controls simplify using ActiveX controls in
Visual C++ interfaces and programs. The features that simplify this process
include overloaded functions, the ability to call the control from any thread,
and automatic data type translations.
3D Graph Control
Use the Measurement Studio ActiveX 3D graph control, as shown in
Figure 3-1, to plot three-dimensional data. The 3D graph is included only
in the Measurement Studio Enterprise and Professional packages.
Figure 3-1. ActiveX 3D Graph Control
With the Measurement Studio ActiveX 3D graph control and the classes
that interface with the control, you can perform the following operations:
Measurement Studio User Manual
3-2
ni.com
Chapter
3
Plot Operations
•
Plot three-dimensional data, including curves and surfaces.
•
Use multiple plot styles—point-line, line-point, hidden-line, contour,
surface, surface-line, surface-contour, and surface-normal.
•
Create multiple plots with individual properties, such as name, line and
point style, width, and base value.
•
Configure the control to render directly to OpenGL-enabled hardware
accelerator cards.
•
Bind the control to a DataSocket Server to enable automatic read and
write functionality.
Additional Operations
•
Configure the axes using customizable ticks, labels, value pairs, and
captions.
•
Use legends and plane projections.
•
Use cartesian, cylindrical, and spherical coordinate systems.
•
Customize the control using color maps, transparency, and lighting.
•
Display in orthographic and perspective views.
•
Use built-in format styles for labels including scientific, symbolic
engineering, scaling, time, and date.
•
Rotate, pan, and zoom interactively.
For information about easily creating graphs with the 3D graph control library, refer
to the 3D Graph Visual C++ Class Library Overview topic in the NI Measurement Studio
Help.
Tip
Analysis
The Analysis class library includes a set of classes that provides various
digital signal processing, signal filtering, signal generation, peak detection,
and other general mathematical functionality. Use this library to analyze
acquired data or to generate data.
The functionality included in the Analysis library varies based on the
Measurement Studio package you purchased. Refer to the following
sections for information about the Standard, Professional, and Enterprise
Analysis class libraries.
© National Instruments Corporation
3-3
Measurement Studio User Manual
Chapter 3
Standard Analysis
The Standard Analysis class library, which ships with Measurement Studio
Standard Edition, includes the sawtooth, sine, square, triangle, and basic
function wave generators.
Professional Analysis
The Professional Analysis class library, which ships with Measurement
Studio Professional Edition, includes the Standard Analysis functionality
as well as the following functionality:
•
Bessel, Chebyshev, Inverse Chebyshev, Windowed, Kaiser, and
Elliptic Low, High, Bandpass, and Bandstop filters
•
Signal processing functions such as convolution, deconvolution,
correlation, decimation, integration, and differentiation
•
FFT, Inverse FFT, Real FFT, Fast Hartley, Inverse Fast Hartley, Fast
Hilbert, Inverse Fast Hilbert, DST, Inverse DST, DCT, and Inverse
DCT transformations
•
Linear algebra functions such as determinant, check positive
definiteness, calculate dot product, and other various matrix methods
•
Scaled and unscaled windowing classes
•
Common statistical functions such as mean, median, mode, and
variance
•
Exponential, linear, and polynomial curve fitting functions
•
Signal generation functions
Enterprise Analysis
The Enterprise Analysis class library, which ships with Measurement
Studio Enterprise Edition, includes the Standard and Professional Analysis
functionality as well as the following advanced functionality:
Measurement Studio User Manual
•
EquiRipple filters
•
Linear algebra functions such as forward and back substitution,
LU factorization, Cholesky factorization, Schur decomposition, and
Hessenberg decomposition
•
Probability and analysis of variance
•
Sinc, impulse, pulse, ramp, and chirp patterns
•
General least squares fit, power fit, log fit, Gauss Fit, cubic spline fit,
and interpolation functions
•
Special functions
3-4
ni.com
Chapter
3
Refer to Table 3-1 to determine the type of measurements available in the
Professional and Enterprise Analysis Visual C++ libraries.
Table 3-1. Analysis Visual C++ Library Measurement Types Included in the
Professional and Enterprise Packages
Analysis Visual C++ Library
Professional Package
Enterprise Package
Measurements
AC and DC Estimator
✔
Amplitude and Phase
Spectrum
✔
Auto Power Spectrum
✔
Cross Power Spectrum
✔
Harmonic Analyzer
✔
Impulse Response Function
✔
✔
Network Functions (avg)
✔
✔
Power and Frequency Estimate
✔
Scaled Time Domain Window
✔
Spectrum Unit Conversion
✔
Transfer Function
✔
Signal Generation
Arbitrary Wave
✔
✔
Chirp Wave
Gaussian White Noise
✔
✔
✔
Impulse Pattern
✔
Pulse Pattern
✔
Ramp Pattern
✔
Sawtooth Wave
✔
Sinc Pattern
✔
Sine Pattern
✔
Sine Wave
© National Instruments Corporation
✔
3-5
✔
Measurement Studio User Manual
Chapter 3
Table 3-1. Analysis Visual C++ Library Measurement Types Included in the
Professional and Enterprise Packages (Continued)
Analysis Visual C++ Library
Professional Package
Enterprise Package
Square Wave
✔
✔
Triangle Wave
✔
✔
Uniform White Noise
✔
✔
Windowing
Blackman Window
✔
✔
Blackman-Harris Window
✔
✔
Blackman-Nuttall Window
✔
✔
Cosine Tapered Window
✔
✔
Dolph-Chebyshev Window
✔
✔
Exact Blackman Window
✔
✔
Exponential Window
✔
✔
Flat Top Window
✔
✔
Force Window
✔
✔
Gauss Window
✔
✔
General Cosine Window
✔
✔
Hamming Window
✔
✔
Hanning Window
✔
✔
Kaiser-Bessel Window
✔
✔
Scaled Time Domain Windows
✔
✔
Symmetric Time Domain
Windows
✔
✔
Triangle Window
✔
✔
Filters
Bessel
✔
✔
Butterworth
✔
✔
Measurement Studio User Manual
3-6
ni.com
Chapter
3
Table 3-1. Analysis Visual C++ Library Measurement Types Included in the
Professional and Enterprise Packages (Continued)
Analysis Visual C++ Library
Professional Package
Enterprise Package
Cascade
✔
✔
Chebyshev
✔
✔
Elliptic
✔
✔
✔
Equiripple
FIR
✔
✔
FIR Windowed
✔
✔
IIR Cascade
✔
✔
IIR
✔
✔
Inverse Chebyshev
✔
✔
Kaiser
✔
✔
Signal Processing
Autocorrelation
✔
✔
Convolution
✔
✔
Cross Power
✔
✔
Cross Correlation
✔
✔
Decimate
✔
✔
Deconvolution
✔
✔
Derivative x(t)
✔
✔
Discrete Cosine Transform
✔
✔
Discrete Sine Transform
✔
✔
Fast Hilbert Transform
✔
✔
Fast Hartley Transform
✔
✔
Integral x(t)
✔
✔
Inverse Real and Complex Fast
Fourier Transform (FFT)
✔
✔
© National Instruments Corporation
3-7
Measurement Studio User Manual
Chapter 3
Table 3-1. Analysis Visual C++ Library Measurement Types Included in the
Professional and Enterprise Packages (Continued)
Analysis Visual C++ Library
Professional Package
Enterprise Package
Inverse Fast Hilbert Transform
✔
✔
Inverse Fast Hartley Transform
✔
✔
Peak Detection
✔
✔
Power Spectrum
✔
✔
Pulse Parameters
✔
✔
Real and Complex FFT
✔
✔
Threshold Peak Detector
✔
✔
Unwrap Phase
✔
✔
Linear Algebra
Back Transform Eigen Vectors
✔
Backward Substitution
✔
Cholesky Factorization
✔
Complex Back Transform
Eigen Vectors
✔
Complex Cholesky
Factorization
✔
Complex Determinant
✔
✔
Complex Dot Product
✔
✔
Complex Eigen Vectors and
Eigen Values
✔
Complex General Eigen AB
✔
Complex Hessenberg
Decomposition
✔
Complex Inverse Matrix
✔
Complex Linear Equations
✔
Complex LU Factorization
✔
Complex Matrix Balance
✔
Measurement Studio User Manual
3-8
ni.com
Chapter
3
Table 3-1. Analysis Visual C++ Library Measurement Types Included in the
Professional and Enterprise Packages (Continued)
Analysis Visual C++ Library
Professional Package
Enterprise Package
Complex Matrix Condition
Number
✔
✔
Complex Matrix Norm
✔
✔
Complex Matrix Rank
✔
✔
Complex Outer Product
✔
✔
Complex Pseudo Inverse
Matrix
✔
✔
Complex QR Factorization
✔
Complex QR Factorization
with Pivot Matrix
✔
Complex QR Factorization
with Pivot Vector
✔
Complex QZ Decomposition
✔
Complex Schur
Decomposition
✔
Complex Solve Linear
Equations (Multiple Right
Hand)
✔
Complex Solve Linear
Equations (Single Right Hand)
✔
Complex SVD Factorization
✔
Complex Vector Norm
✔
Determinant
✔
✔
Dot Product
✔
✔
Forward Substitution
✔
General Eigen AB
✔
Hessenberg Decomposition
✔
Inverse Matrix
© National Instruments Corporation
✔
3-9
✔
Measurement Studio User Manual
Chapter 3
Table 3-1. Analysis Visual C++ Library Measurement Types Included in the
Professional and Enterprise Packages (Continued)
Analysis Visual C++ Library
Professional Package
Enterprise Package
Linear Equations
✔
LU Factorization
✔
Matrix Balance
✔
Matrix Condition Number
✔
✔
Matrix Multiplication
✔
✔
Matrix Norm
✔
✔
Matrix Rank
✔
✔
Outer Product
✔
✔
Pseudo Inverse Matrix
✔
✔
QR Factorization
✔
QR Factorization with Pivot
Matrix
✔
QR Factorization with Pivot
Vector
✔
QZ Decomposition
✔
Schur Decomposition
✔
Solve Linear Equations
(Multiple Right Hand)
✔
Solve Linear Equations
(Single Right Hand)
✔
Special Matrix
✔
✔
✔
SVD Factorization
Test Positive Definite Matrix
✔
✔
Trace
✔
✔
Transpose
✔
✔
Array and Numeric Operations
1D and 2D Array Arithmetic
Measurement Studio User Manual
✔
3-10
✔
ni.com
Chapter
3
Table 3-1. Analysis Visual C++ Library Measurement Types Included in the
Professional and Enterprise Packages (Continued)
Analysis Visual C++ Library
Professional Package
Enterprise Package
1D and 2D Linear Evaluation
✔
✔
1D and 2D Polynomial
Evaluation
✔
✔
1D Polar to Rectangular
✔
✔
1D Rectangular to Polar
✔
✔
Complex Number Arithmetic
✔
✔
Find Polynomial Roots
✔
✔
Scale 1D and 2D
✔
✔
Curve Fitting
✔
Cubic Spline Fit
Exponential Fit
✔
✔
Exponential Fit Interval
✔
Gauss Fit
✔
Gauss Fit Interval
✔
General Least Squares
Linear Fit
✔
General Polynomial Fit
✔
✔
Goodness of Fit
Linear Fit
✔
✔
✔
Linear Fit Interval
✔
Logarithm Fit
✔
Logarithm Fit Interval
✔
Nonlinear Fit
✔
Polynomial Fit
✔
✔
Power Fit
✔
Power Fit Interval
✔
© National Instruments Corporation
3-11
Measurement Studio User Manual
Chapter 3
Table 3-1. Analysis Visual C++ Library Measurement Types Included in the
Professional and Enterprise Packages (Continued)
Analysis Visual C++ Library
Professional Package
Enterprise Package
✔
Remove Outliers
Statistics
1D, 2D, and 3D ANOVA
✔
Chi-Square Distribution
✔
erf(x) and erfc(x)
✔
F-Distribution
✔
Histogram
✔
✔
Inverse Chi-Square
Distribution
✔
Inverse F-Distribution
✔
Inverse Normal Distribution
✔
Inverse T-Distribution
✔
Mean
✔
✔
Median and Mode
✔
✔
Moment about Mean
✔
✔
Normal Distribution
✔
Polynomial Interpolation
✔
Root-Mean-Square (RMS)
✔
✔
Spline Interpolant
✔
Spline Interpolation
✔
Standard Deviation
✔
✔
T-Distribution
✔
Variance
✔
Special Functions
✔
Airy
Measurement Studio User Manual
3-12
ni.com
Chapter
3
Table 3-1. Analysis Visual C++ Library Measurement Types Included in the
Professional and Enterprise Packages (Continued)
Analysis Visual C++ Library
Professional Package
Enterprise Package
Bessel 1st
✔
Bessel 2nd
✔
Beta
✔
Complimentary Gamma
✔
Cosine Integral
✔
Dawson’s Integral
✔
Dilogarithm
✔
Elliptic 1st
✔
Elliptic 2nd
✔
Exponential Integral
✔
Factorial
✔
Fresnel Integrals
✔
Gamma
✔
Gauss HyperGeometric
✔
Hyperbolic Cosine Integral
✔
Hyperbolic Sine Integral
✔
Incomplete Beta
✔
Incomplete Elliptic 1st
✔
Incomplete Elliptic 2nd
✔
Incomplete Gamma
✔
Jacobian Elliptic Function
✔
Kelvin 1st
✔
Kelvin 2nd
✔
Kummer
✔
Logarithm of Factorial
✔
© National Instruments Corporation
3-13
Measurement Studio User Manual
Chapter 3
Table 3-1. Analysis Visual C++ Library Measurement Types Included in the
Professional and Enterprise Packages (Continued)
Analysis Visual C++ Library
Professional Package
Enterprise Package
Modified Bessel 1st
✔
Modified Bessel 2nd
✔
Parabolic Cylinder
✔
Psi
✔
Sine Integral
✔
Spherical Bessel 1st
✔
Spherical Bessel 2nd
✔
Stirling
✔
Struve
✔
Tricomi
✔
Zeta
✔
For more information about analyzing or generating data with the Analysis class
library, refer to the Analysis Visual C++ Class Library Overview topic in the
NI Measurement Studio Help. For more information about the functionality included in the
Analysis class library, visit ni.com/analysis and select Visual Basic, Visual Basic
.NET, C++, and C# with Measurement Studio.
Tip
Measurement Studio User Manual
3-14
ni.com
Chapter
3
Common
The Measurement Studio Common Visual C++ class library provides data
types and classes that other Measurement Studio Visual C++ class libraries
use. The classes that are implemented natively in Visual C++ include the
CNiVector and CNiMatrix classes.
The Common class library includes the following data types:
•
CNiScalarVector—Implements a vector object that contains scalar
numbers.
•
CNiScalarMatrix—Implements a matrix object that contains scalar
numbers.
•
CNiString—Extends the MFC CString class with streaming
operators for a variety of data types and with various other string
manipulation functions.
•
CNiScalarVector—Implements a vector object that contains scalar
numbers.
•
CNiVariant—Extends the MFC COleVariant class with additional
constructors and assignment operators for CNiComplex-, CNiVector-,
and CNiMatrix-derived objects and with cast operators to convert
CNiVariant objects to a variety of other object types.
•
CNiException—Extends the MFC CException class and serves as
the base class for many Measurement Studio exceptions.
•
CNiRegKey—Encapsulates the interface to the Windows registry. Use
this class and related classes to open and create keys, get keys, and get
values associated with those keys.
For more detailed information about the Common class library, refer to the Common
Visual C++ Class Library Overview topic in the NI Measurement Studio Help.
Tip
DataSocket
Use the Measurement Studio DataSocket Visual C++ class library to
transfer live measurement data over the Internet or an intranet, between
applications on the same computer, and to and from files. Use the classes
in the DataSocket Visual C++ class library to perform the following
operations:
•
Read and write data between different data sources and targets.
•
Use a single, simple API to communicate with several types of servers,
including DataSocket Servers (dstp:), Web servers (http:), file
© National Instruments Corporation
3-15
Measurement Studio User Manual
Chapter 3
transfer protocol servers (ftp:), file systems (file:), and OLE for
Process Control (opc:) servers.
•
Specify data sources and targets using a URL, the same way you access
Web pages in a Web browser.
•
Use DataSocket Transfer Protocol (DSTP) to exchange different types
of data.
•
Interactively browse to quickly locate and select data items on other
computers and servers.
Tip For more information about using DataSocket, refer to the DataSocket Visual C++
Class Library Overview topic in the NI Measurement Studio Help.
Microsoft Excel Interface
Use the Measurement Studio Excel Visual C++ class library to
automatically create Excel spreadsheets and charts from within
measurement and automation applications. Use the Microsoft Excel
Interface class library to perform offline processing of the measurement
and automation data you acquire and analyze using other Measurement
Studio Visual C++ classes. This class library is included only in the
Measurement Studio Enterprise package.
For more information about using the Measurement Studio Excel Visual C++
class library to create applications that present data in Microsoft Excel format, refer to
the Microsoft Excel Interface Visual C++ Class Library Overview topic in the
NI Measurement Studio Help.
Tip
Microsoft Word Interface
Use the Measurement Studio Microsoft Word Interface Visual C++ class
library to automatically create Word documents from within measurement
and automation applications. Use the Microsoft Word Interface class
library to perform offline processing of the measurement and automation
data you acquire and analyze using other Measurement Studio Visual C++
classes. This class library is included only in the Measurement Studio
Enterprise package.
For more information about using the Measurement Studio Word Visual C++ class
library to create applications that present data in Microsoft Word, refer to the Microsoft
Word Interface Visual C++ Class Library Overview topic in the NI Measurement Studio
Help.
Tip
Measurement Studio User Manual
3-16
ni.com
Chapter
3
NI-488.2
Use the Measurement Studio NI-488.2 Visual C++ class library to
communicate with and control instruments on a GPIB interface. This class
library is included when you install the NI-488.2 driver. Use this class
library to configure and communicate with GPIB devices using the
CNi4882Device and CNi4882Board classes.
You can use the NI-488.2 class library to create programs that interface
with a device that is using GPIB and programs that interface with the GPIB
device directly.
For information about easily creating a Measurement Studio NI-488.2 application
using the Instrument I/O Assistant, refer to the Creating an Instrument Control Application
section of Chapter 4, Measurement Studio Integrated Tools and Features. You can create
Measurement Studio NI-488.2 applications with the Instrument I/O Assistant in Visual
Studio .NET 2003 only. For more information about GPIB, visit ni.com/gpib.
Tip
NI-DAQmx
Use the Measurement Studio NI-DAQmx Visual C++ class library to
communicate with and control an NI data acquisition (DAQ) device. This
class library is included when you install the NI-DAQmx driver.
Some DAQ devices are not currently supported by the NI-DAQmx driver. Refer to
the NI-DAQ Readme for a complete listing of supported hardware.
Note
Use the NI-DAQmx class library to perform the following types of tasks:
•
Analog signal measurement
•
Analog signal generation
•
Digital I/O
•
Counting and timing
•
Pulse generation
•
Signal switching
For information about easily creating an NI-DAQmx application using the DAQ
Assistant, refer to the Creating a Measurement Studio NI-DAQmx Application section of
Chapter 4, Measurement Studio Integrated Tools and Features, or the Walkthrough:
Creating a Measurement Studio NI-DAQmx Application section of Chapter 5, Getting
Started with Measurement Studio. For more information about DAQ, visit ni.com/daq.
Tip
© National Instruments Corporation
3-17
Measurement Studio User Manual
Chapter 3
NI-Reports
Use the Measurement Studio NI-Reports Visual C++ class library to
generate printed reports from Measurement Studio Visual C++
applications. This class library is included only in the Measurement Studio
Enterprise package.
For information about generating printed reports using the NI-Reports class library,
refer to the NI-Reports Visual C++ Class Library Overview topic in the NI Measurement
Studio Help.
Tip
NI-VISA
The Measurement Studio NI-VISA Visual C++ class library includes
Visual C++ classes that provide an object-oriented interface to the
NI-VISA driver. This class library is included when you install the
NI-VISA driver. Use the NI-VISA class library to quickly create
bus-independent and bus-specific instrument control applications.
The NI-VISA class library supports I/O operations, locking, event
handling, and interface-specific extensions. With this class library, you can
access the functionality available in NI-VISA for communicating with
message-based and register-based instruments using the following
interfaces:
•
GPIB
•
PXI
•
Serial (RS-232 and RS-485)
•
TCP/IP
•
USB
•
VXI
For information about easily creating a Measurement Studio NI-VISA application
using the Instrument I/O Assistant, refer to the Creating an Instrument Control Application
section of Chapter 4, Measurement Studio Integrated Tools and Features, or the
Walkthrough: Creating a Measurement Studio Instrument I/O Application section of
Chapter 5, and Getting Started with Measurement Studio. For more information about
NI-VISA, visit ni.com/visa.
Tip
Measurement Studio User Manual
3-18
ni.com
Chapter
3
User Interface
Use the Measurement Studio User Interface Visual C++ class library to add
user interface controls to your application. You can configure the user
interface controls programmatically or through the property pages in the
Visual C++ resource editor. Measurement Studio includes the following
Visual C++ user interface controls:
•
Button
•
Graph
•
Knob
•
Numeric edit
•
Slide
The following sections describe each of the Measurement Studio Visual
C++ user interface controls.
Button Control
Use the Measurement Studio ActiveX button control, as shown in
Figure 3-2, for different Boolean displays, such as on or off or true or false.
Typically, you use buttons to input or display Boolean information or
initiate an action in a program. The CNiButton class provides the Visual
C++ interface to the ActiveX button control.
Figure 3-2. ActiveX Button Control
With the button control and the classes that interface with the control, you
can perform the following operations:
•
Configure how the control behaves when you click it with the mouse
or press the spacebar when the control has focus.
•
Configure how the button control appears using button styles. You can
configure the button control to appear as a push button, LED, or
switch.
•
Bind properties to a DataSocket source or target. You use binding to
read property values from a source and write property values to a
target.
© National Instruments Corporation
3-19
Measurement Studio User Manual
Chapter 3
Tip For more information about using the button control, refer to the Using the
Measurement Studio Button Visual C++ Control section in the NI Measurement Studio
Help.
Graph Control
Use the Measurement Studio ActiveX graph control, as shown in
Figure 3-3, to plot and chart two-dimensional data. The CNiGraph class
provides the Visual C++ interface to the ActiveX graph control.
Figure 3-3. ActiveX Graph Control
With the graph control and the classes that interface with the control, you
can perform the following operations:
Plot Operations
Measurement Studio User Manual
•
Plot and chart data.
•
Configure a graph to contain multiple plots to show separate but
related data on the same graph.
•
Configure a graph to include multiple Y axes so that plot data fits the
graph plot area.
•
Use cursors and annotations to identify key points in plots and the plot
area.
3-20
ni.com
Chapter
3
Axis Operations
•
Use the CNiAxis class to interface to a single axis of a graph control.
This feature allows you to modify the appearance and behavior of the
axis.
•
Automatically label axes with log or inverted numeric scales.
•
Configure the axis modes for manual scaling or autoscaling.
Additional Operations
•
Configure cursor snap modes to be fixed, floating, nearest point, and
to plot.
•
Pan and zoom interactively.
•
Configure the graph for fixed, strip, or scope charting.
•
Customize the graph by using ticks, labels, and value pairs.
•
Bind properties to a DataSocket source or target. You use binding to
read property values from a source and write property values to a
target.
For more information about easily using the graph control, refer to the Using the
Measurement Studio Graph Visual C++ Control section in the NI Measurement Studio
Help.
Tip
Knob Control
Use the Measurement Studio ActiveX knob control, as shown in
Figure 3-4, to display numerical information. The CNiKnob class
provides the Visual C++ interface to the ActiveX knob control.
Figure 3-4. ActiveX Knob Control with Knob, Dial, and Meter Styles
© National Instruments Corporation
3-21
Measurement Studio User Manual
Chapter 3
With the knob control and the classes that interface with the control, you
can perform the following operations:
•
Use different display styles—knobs, dials, and meters.
•
Use multiple control pointers, each representing one scalar value.
A control pointer indicates the current value of the knob.
•
Use the CNiAxis class to interface to a single axis of a knob control.
This feature allows you to modify the appearance and behavior of the
axis.
•
Automatically label axes with log or inverted numeric scales and
continuous or discrete values.
•
Customize the knob by using ticks, labels, and value pairs.
•
Bind properties to a DataSocket source or target. You use binding to
read property values from a source and write property values to a
target.
For more information about easily using the knob control, refer to the Using the
Measurement Studio Knob Visual C++ Control section in the NI Measurement Studio
Help.
Tip
Numeric Edit Control
Use the Measurement Studio ActiveX numeric edit control, as shown in
Figure 3-5, to display numeric values and provide a way by which end
users can edit numeric values. Typically, you use a numeric edit control to
input or display numerical data instead of using a text box. The
CNiNumEdit class provides the Visual C++ interface to the ActiveX
numeric edit control.
Figure 3-5. ActiveX Numeric Edit Control
With the numeric edit control and the classes that interface with the control,
you can perform the following operations:
Measurement Studio User Manual
•
Use built-in numeric format styles, including scientific, symbolic
engineering, scaling, time, and date.
•
Perform range checking.
•
Bind properties to a DataSocket source or target. You use binding to
read property values from a source and write property values to a
target.
3-22
ni.com
Chapter
3
For more information about easily using the numeric edit control, refer to the Using
the Measurement Studio Numeric Edit Visual C++ Control section in the NI Measurement
Studio Help.
Tip
Slide Control
Use the Measurement Studio ActiveX slide control, as shown in
Figure 3-6, to display numerical data. CNiSlide is the class that
provides the Visual C++ interface to the ActiveX slide control.
Figure 3-6. ActiveX Slide Control
With the slide control and the classes that interface with the control, you
can perform the following operations:
•
Use different display styles—vertical, horizontal, tank, and
thermometer.
•
Use the CNiAxis class to interface to a single axis of a slide control.
This ability allows you to modify the appearance and behavior of the
axis.
•
Use multiple control pointers, each one representing one scalar value.
•
Automatically label axes with log or inverted numeric scales and
continuous or discrete values.
•
Customize the slide by using ticks, labels, and value pairs.
•
Bind properties to a DataSocket source or target. You use binding to
read property values from a source and write property values to a
target.
For more information about easily using the slide control, refer to the Using the
Measurement Studio Slide Visual C++ Control section in the NI Measurement Studio Help.
Tip
© National Instruments Corporation
3-23
Measurement Studio User Manual
Chapter 3
Utility
Use the Measurement Studio Utility Visual C++ class library to easily
access Windows operating system functionality. Table 3-2 lists classes in
the Utility class library and their functionality.
Table 3-2. Utility Class Names and Functionalities
Utility Class
CNiFile
Functionality
CNiFile extends the MFC CStdioFile class by adding
streaming operators for standard Visual C++ data types. In
addition, a variety of class static functions add the ability to
manipulate file, path, directory, and drive attributes.
CNiSound
CNiSound encapsulates an interface for generating synchronous
and asynchronous tones at specific frequencies.
CNiSystem
CNiSystem provides the following functionality:
• Getting and setting system preferences
• Displaying help files
• Getting input for the keyboard
CNiSystemTrayIcon
CNiSystemTrayIcon encapsulates the interface to the system
tray area that displays changes in the status of an application. The
CNiSystemTrayIcon class includes the following features:
• Icons—You can place an icon in the system tray to notify the
user of changes in an application status.
• String tooltips—You can associate a string tooltip with an icon
and display the tooltip when the user hovers over the icon.
• Shortcut menus—You can associate a shortcut menu with an
icon and display the shortcut menu when the user right-clicks
the icon.
• Overridable event handling.
Measurement Studio User Manual
3-24
ni.com
Chapter
3
Table 3-2. Utility Class Names and Functionalities (Continued)
Utility Class
Functionality
CNiTempFile
CNiTempFile extends the functionality of CNiFile to add
temporary file creation and manipulation.
CNiTimer
CNiTimer objects use the Windows multimedia timer to generate
high-resolution, asynchronous tick events. Respond to tick events
when you want to perform an action at a discrete interval.
Additionally, you can count the tick events to calculate elapsed
time. The CNiTimer class also contains static functions you can
use to delay for a period of time or to determine elapsed time
between two points in your program.
For more information about using the Utility class library, refer to the Utility Visual
C++ Class Library Overview section in the NI Measurement Studio Help.
Tip
© National Instruments Corporation
3-25
Measurement Studio User Manual
Measurement Studio Integrated
Tools and Features
4
When you use Measurement Studio in the Visual Studio environment, you
have access to measurement and automation tools and features for Visual
Basic .NET, Visual C#, ASP.NET, and Visual C++. These integrated tools
and features are designed to help you quickly and easily build measurement
and automation applications. These integrated tools and features are
included in support for both Visual Studio 2005 and Visual Studio 2008.
This chapter includes the following sections to help you develop
applications with Measurement Studio:
•
Measurement Studio Menu
•
Creating a Measurement Studio Project
•
Adding or Removing Measurement Studio .NET Class Libraries
•
Creating a Measurement Studio NI-DAQmx Application
•
Creating an Instrument Control Application
•
Selecting a Measurement Studio Parameter Value
•
Using the Instrument Driver Wizard
Refer to the Developing with Measurement Studio section in the
NI Measurement Studio Help for more information about the functionality
of these tools and features.
Measurement Studio Menu
The Measurement Studio Menu provides an easy way to access the
following National Instruments resources and tools:
•
© National Instruments Corporation
Parameter Assistant—Use the Measurement Studio Parameter
Assistant to discover and insert valid parameter values for various
Measurement Studio class libraries, such as NI-DAQmx, NI-488.2,
and NI-VISA methods. The Parameter Assistant is available only if
you have Measurement Studio class libraries installed that use
parameter values.
4-1
Measurement Studio User Manual
Chapter 4
Measurement Studio Integrated Tools and Features
Measurement Studio User Manual
•
Add/Remove .NET Class Libraries Wizard—Use the Measurement
Studio Add/Remove Class Libraries wizard to add or remove
Measurement Studio class libraries or assemblies in existing Visual
Basic .NET, Visual C#, or Visual C++ projects.
•
Refresh Project License File—Use the Refresh Project License File
to update the licenses.licx file in a Measurement Studio project to
the currently referenced Measurement Studio assemblies. The Refresh
Project process works by going through the licenses.licx file line
by line for the active project and removing each Measurement Studio
licensed type that matches the Measurement Studio
PublicKeyToken. After all Measurement Studio licensed types are
removed from the licenses.licx file, the current Measurement
Studio licensed types that are referenced by the project are added to the
licenses.licx file. This ensures all Measurement Studio licensed
types used by the project are added to the licenses.licx file.
•
Add 64-Bit Protection to Project—Updates your project’s platform
target to x86 and updates your project to protect it from build error
LC0000. Refer to Using Measurement Studio on 64-Bit Operating
Systems and Protecting Your Project from LC0000 Build Error in the
NI Measurement Studio Help for more information. This menu item is
only available in Visual Studio 2005 on a 64-bit Windows OS. Visual
Studio 2008 projects function correctly without this protection.
•
Remove 64-Bit Protection from Project—Removes protection for
build error LC0000 from your project. Refer to Using Measurement
Studio on 64-Bit Operating Systems and Protecting Your Project from
LC0000 Build Error in the NI Measurement Studio Help for more
information. This menu item is only available in Visual Studio 2005 on
a 64-bit Windows OS. Visual Studio 2008 projects function correctly
without this protection.
•
Update Measurement Studio Project References—Updates any
outdated Measurement Studio references to the latest version installed
on the system.
•
NI Tools»Measurement & Automation Explorer (MAX)—Use
MAX to configure NI hardware; add new channels, interfaces, and
tasks; execute system diagnostics; and view devices and instruments
connected to the system. Select NI Tools»Measurement &
Automation Explorer (MAX) to access this menu item. The MAX
menu option is available only if you have MAX installed.
•
NI Tools»NI Spy—Use NI Spy to monitor, record, and display
National Instruments API calls made by instrument connectivity
applications. Use NI Spy to quickly locate and analyze any erroneous
National Instruments API calls that an application makes and verify
4-2
ni.com
Chapter 4
Measurement Studio Integrated Tools and Features
that the communication with an instrument is correct. Select
NI Tools»NI Spy to access this menu item. The NI Spy menu item is
available only if you have NI Spy installed.
•
NI Tools»Variable Manager—Use Variable Manager to create new
processes and variables, delete existing processes and variables, start
and stop processes, create variables with specific data types or the
variant data type, allow multiple writers or restrict write access to a
single client, and configure server buffering. Select NI Tools»Variable
Manager to access this menu item.
•
NI Measurement Studio Help—Use the NI Measurement Studio
Help to access detailed Measurement Studio help, including function
reference, walkthroughs, and conceptual topic documentation on
developing with Measurement Studio.
•
Measurement Studio Online Resources»Measurement Studio
Home Page—Use the Measurement Studio Web site at
ni.com/mstudio to find Measurement Studio news, support,
downloads, and evaluation software. Select Measurement Studio
Online Resources»Measurement Studio Home Page to access this
menu item.
•
Measurement Studio Online Resources»Instrument Driver
Network—Use the NI Instrument Driver Network at ni.com/idnet
as a central resource for downloading, developing, and submitting
instrument drivers. Select Measurement Studio Online
Resources»Instrument Driver Network to access this menu item.
•
Measurement Studio Online Resources»Discussion Forums—Use
the NI Discussion Forums at forums.ni.com to participate in
discussion forums and exchange code with measurement and
automation developers around the world. Select Measurement Studio
Online Resources»Discussion Forums to access this menu item.
•
Measurement Studio Online Resources»Search Technical
Support—Use NI Technical Support at ni.com/support to find
support resources available for most products, including software
drivers and updates, KnowledgeBase articles, product manuals,
step-by-step troubleshooting wizards, conformity documentation,
example code, tutorials and application notes, instrument drivers,
discussion forums, and a measurement glossary. Select Measurement
Studio Online Resources»Search Technical Support to access this
menu item.
© National Instruments Corporation
4-3
Measurement Studio User Manual
Chapter 4
Measurement Studio Integrated Tools and Features
•
Measurement Studio Online Resources»NI Developer
Zone—NI Developer Zone, zone.ni.com, provides access to online
example programs, tutorials, technical news, and a Measurement
Studio Discussion Forum where you can participate in discussion
forums for Visual Basic 6.0, Visual C++, and .NET Languages. Select
Measurement Studio Online Resources»NI Developer Zone to
access this menu item.
•
Patents—Use the Patents dialog box to view information about
NI patents.
•
Licenses—Use the Licenses dialog box to view information about
NI licenses.
•
About Measurement Studio—Use the Measurement Studio About
box to view version information.
•
Preferences—Use the Measurement Studio Preferences dialog box to
configure Measurement Studio settings, such as conversion options
and add-in preferences. Select Tools»Options to access this menu
item.
Tip For more information about the resources included in the Measurement Studio Menu,
refer to the Measurement Studio Menu topic in the NI Measurement Studio Help.
Creating a Measurement Studio Project
Measurement Studio includes class library and application templates that
you can use to quickly create measurement applications with Visual Basic
.NET, Visual C#, ASP.NET, and Visual C++. Refer to the following
sections, Walkthrough: Creating an Application with Windows Forms
Controls and Analysis or Walkthrough: Creating an Application with Web
Forms Controls and Analysis, for step-by-step instructions on how to
create a Measurement Studio project. Use the Visual Studio New Project
dialog box, as shown in Figure 4-1, to access these templates and to create
projects. You can create the following projects in Measurement Studio:
Measurement Studio User Manual
•
Measurement Studio Visual Basic .NET project
•
Measurement Studio Visual C# project
•
Measurement Studio ASP.NET project
•
Measurement Studio Visual C++ project (Visual Studio 2005 only)
•
Measurement Studio Visual C++ project with LabWindows/CVI
libraries (Visual Studio 2005 only)
4-4
ni.com
Chapter 4
Measurement Studio Integrated Tools and Features
Figure 4-1. New Project Dialog Box in Visual Studio 2005
Tip For more information about using project templates to create a new Measurement
Studio project, refer to the Creating a New Measurement Studio Project section in the
NI Measurement Studio Help.
Note For information about converting Measurement Studio projects, refer to the
Converting Measurement Studio Projects section in the NI Measurement Studio Help.
Adding or Removing Measurement Studio .NET Class
Libraries
To add or remove Measurement Studio .NET class libraries from a project,
use the Measurement Studio Add/Remove .NET Class Libraries wizard on
the Measurement Studio menu. This wizard provides an interface, as shown
in Figure 4-2, that you can use to select the Measurement Studio .NET class
libraries you want to add to or remove from a project.
© National Instruments Corporation
4-5
Measurement Studio User Manual
Chapter 4
Measurement Studio Integrated Tools and Features
When you exit the wizard, the wizard adds or removes the appropriate
references to or from the project, thus adding or removing the functionality
associated with the class library.
Figure 4-2. Measurement Studio Add/Remove Class Libraries Wizard for
Visual Studio 2005
For more information about using the Add/Remove .NET Class Libraries wizard to
add or remove Measurement Studio .NET class libraries, refer to the Adding or Removing
Measurement Studio .NET Class Libraries section in the NI Measurement Studio Help.
Tip
Creating a Measurement Studio NI-DAQmx Application
To create a Measurement Studio NI-DAQmx application, use the DAQ
Assistant. The DAQ Assistant integrates into Visual Studio as a code
designer. Use the Add New Item wizard to add an NI-DAQmx task to your
project, and use the DAQ Assistant user interface, as shown in Figure 4-3,
to interactively create and configure the NI-DAQmx task. The DAQ
Assistant automatically generates a Visual Basic .NET, Visual C#, or
Visual C++ (Visual Studio 2005 only) class that includes the functionality
you configure in the user interface.
Measurement Studio User Manual
4-6
ni.com
Chapter 4
Measurement Studio Integrated Tools and Features
The DAQ Assistant is available only if you have installed NI-DAQmx and either the
Measurement Studio Professional or Measurement Studio Enterprise package.
Note
Refer to Chapter 5, the Walkthrough: Creating a Measurement Studio
NI-DAQmx Application section, for step-by-step instructions on how to
create DAQ applications.
Figure 4-3. DAQ Assistant
© National Instruments Corporation
4-7
Measurement Studio User Manual
Chapter 4
Measurement Studio Integrated Tools and Features
The DAQ Assistant interactively assists you in performing the following
operations:
• Creating an NI-DAQmx task class
• Configuring an NI-DAQmx task class
• Generating a Visual Basic .NET, Visual C#, or Visual C++ class that
includes the functionality you configure in the user interface
• Generating code that uses an NI-DAQmx task class
• Using an NI-DAQmx task class in a project
• Generating a DAQ component that uses the task to provide appropriate
operations for your measurement type.
For more information about using the DAQ Assistant to create a Measurement Studio
NI-DAQmx application, refer to the Creating a Measurement Studio NI-DAQmx
Application section in the NI Measurement Studio Help.
Tip
Creating an NI-DAQmx User Interface
Using the Configure DAQ Component UI wizard, as shown in Figure 4-4,
you can customize and preview a user interface and code for your task. The
wizard also generates event handlers and code to acquire data and present
it on your generated user interface.
Figure 4-4. Configure DAQ Component UI Wizard
Measurement Studio User Manual
4-8
ni.com
Chapter 4
Measurement Studio Integrated Tools and Features
For more information on how to create an NI-DAQmx user interface, refer to the
Using a .NET DAQ Component in a Project topic in the NI Measurement Studio Help.
Tip
Creating NI-DAQmx User Code in Visual C++
Measurement Studio 8.5 support for Visual Studio 2008 does not include support for
Visual C++.
Note
You can create NI-DAQmx user code in Visual C++. The DAQmx User
Code wizard wraps the configured DAQmx task class in a user-friendly
class and creates a dialog that provides an example of using the new class.
You can use the user code in two different ways. You can call the DoModal
function on the new dialog class, or you can use the user-friendly wrapper
class directly in your code by calling the class programmatically.
To use the user code directly, create an instance of the DAQmx user code
class and call the appropriate function in your source code. You can create
an instance of the user code directly in source code, just as you create an
instance of any class directly in source code. Declare a variable of the
appropriate type and use it directly. The .h file for the user-friendly
wrapper for the DAQmx task class contains additional information on using
the user code.
For more information on how to create user code, refer to the Using a DAQmx Task
Class in a Project topic in the NI Measurement Studio Help.
Tip
Creating an Instrument Control Application
To create a Measurement Studio instrument control application, use the
Instrument I/O Assistant. The Instrument I/O Assistant, as shown in
Figure 4-5, integrates into Visual Studio as a code designer. Use the Add
New Item wizard to add an instrumentation task to your project, and use the
Instrument I/O Assistant user interface to create and configure the
instrumentation task. The Instrument I/O Assistant generates a Visual
Basic .NET, Visual C#, or Visual C++ class that includes the functionality
you configure in the user interface. Use this assistant to help you write code
that communicates with devices such as serial, Ethernet, or GPIB
instruments.
The Instrument I/O Assistant is available only if you have installed either the
Measurement Studio Professional or Measurement Studio Enterprise package.
Note
© National Instruments Corporation
4-9
Measurement Studio User Manual
Chapter 4
Measurement Studio Integrated Tools and Features
Refer to Chapter 5, the Walkthrough: Creating a Measurement Studio
Instrument I/O Application section, for step-by-step instructions on how to
use the Instrument I/O Assistant.
Figure 4-5. Instrument I/O Assistant
The Instrument I/O Assistant aids you in performing the following
operations:
•
Creating an instrumentation task class
•
Configuring an instrumentation task class to communicate with an
instrument and parse data you receive from the instrument
For more information about using the Instrument I/O Assistant to create a
Measurement Studio instrument control application, refer to the Creating a Measurement
Studio Instrument Control Application section of the NI Measurement Studio Help.
Tip
Measurement Studio User Manual
4-10
ni.com
Chapter 4
Measurement Studio Integrated Tools and Features
Selecting a Measurement Studio Parameter Value
To access I/O devices or resources, you must specify string constants or
scalar values for many method parameters and property values. Use the
Measurement Studio Parameter Assistant, on the Measurement Studio
menu, to discover and insert into your code valid parameter values for
methods and various Measurement Studio class libraries, such as
NI-DAQmx, NI-488.2, and NI-VISA.
The Parameter Assistant is available in prior versions of Visual Studio only if you
have at least one Measurement Studio class library installed that supports the Parameter
Assistant.
Note
With the Parameter Assistant, you can select the correct parameter value for
a device or resource, as shown in Figure 4-6, based on your current system
configuration. Click the Insert Selected Item button on the Parameter
Assistant to insert the value into the current location in the active source
file.
Figure 4-6. Measurement Studio Parameter Assistant
For information about using the Measurement Studio Parameter Assistant to select a
parameter value, refer to the Selecting a Measurement Studio Parameter Value section in
the NI Measurement Studio Help.
Tip
© National Instruments Corporation
4-11
Measurement Studio User Manual
Chapter 4
Measurement Studio Integrated Tools and Features
Using the Instrument Driver Wizard
To use an IVI or VXI plug&play instrument driver with a C DLL in a
Measurement Studio .NET application, use the Measurement Studio .NET
Instrument Driver wizard to create .NET entry points to the C DLL
functions you need to call from your application. Use the Add New Item
wizard to select the .NET Instrument Driver Wizard.
The Measurement Studio .NET Instrument Driver wizard, as shown in
Figure 4-7, generates a .NET wrapper class for calling into IVI, VXI
plug&play, and legacy instrument drivers based on the instrument driver
function panel, header file, and an optional .sub file for IVI drivers. The
wizard can generate both Visual C# and Visual Basic .NET source code.
After completing the wizard, a new instrument driver wrapper class is
added to your project and opened in the source code editor.
Figure 4-7. Launching the Measurement Studio .NET Instrument Driver Wizard from
the Add New Item Wizard
For information about the .NET instrument driver wizard, refer to the Using
Instrument Drivers in Measurement Studio Applications section in the NI Measurement
Studio Help.
Tip
Measurement Studio User Manual
4-12
ni.com
5
Getting Started with
Measurement Studio
The following sections include overview information and step-by-step
instructions on developing applications with Measurement Studio tools and
features. Refer to the Developing with Measurement Studio section and the
Getting Started with the Measurement Studio Class Libraries section of the
NI Measurement Studio Help for more information about the functionality
of these tools and features.
Measurement Studio Walkthroughs
Use the following walkthroughs to help you develop Measurement Studio
applications in Visual Studio 2005 or Visual Studio 2008:
•
Walkthrough: Creating a Measurement Studio Application with
Windows Forms Controls and Analysis
•
Walkthrough: Creating a Measurement Studio Application with Web
Forms Controls and Analysis
•
Walkthrough: Creating a Measurement Studio Application with
Windows Forms Controls and Network Variable
•
Walkthrough: Creating a Measurement Studio Application with Web
Forms Controls and Network Variable
•
Walkthrough: Creating a Measurement Studio NI-DAQmx
Application
•
Walkthrough: Creating a Measurement Studio Instrument I/O
Application
© National Instruments Corporation
5-1
Measurement Studio User Manual
Chapter 5
Getting Started with Measurement Studio
Walkthrough: Creating a Measurement Studio
Application with Windows Forms Controls and Analysis
To complete this walkthrough, you must have either the Measurement Studio
Professional or Measurement Studio Enterprise package installed for Visual Studio 2005
or later. This walkthrough will not work with the Measurement Studio Standard package.
Note
Measurement Studio includes user interface controls, such as a waveform
graph control and a gauge control, and analysis functionality, such as signal
generation and mathematical functions. This walkthrough is designed to
help you learn how to add analysis and presentation functionality to a
Windows Forms application by taking you through the following steps:
•
Setting up the project—Using the Measurement Studio Application
Wizard, you will create a new project that references the Measurement
Studio Analysis class library and Windows Forms controls.
•
Adding user interface controls to the project—Using the Toolbox,
smart tags, and the Properties window, you will add and configure a
button, waveform graph, legend, gauge, and numeric edit user
interface control.
•
Generating, plotting, and analyzing the data—Using
NationalInstruments.Analysis.SignalGeneration.White
NoiseSignal and NationalInstruments.Analysis.Math.
Statistics.Mean, you will generate data, plot the generated data on
a waveform graph, and calculate the mean of the data.
•
Customizing the user interface—Using smart tags and the Collection
Editor and Auto Format dialog boxes, you will display the mean value
on the gauge and the numeric edit, as well as customize your user
interface.
Before you begin
The following components are required to complete this walkthrough:
Measurement Studio User Manual
•
Microsoft Visual Studio 2005 or Visual Studio 2008
•
Measurement Studio 8.0.1 or later (Professional or Enterprise
package) for Visual Studio 2005 or Measurement Studio 8.5 or later
(Professional or Enterprise package) for Visual Studio 2008
5-2
ni.com
Chapter 5
Getting Started with Measurement Studio
Setting up the project
1.
Select Start»All Programs»Microsoft Visual Studio 2005»
Microsoft Visual Studio 2005 or Start»All Programs»Microsoft
Visual Studio 2008»Microsoft Visual Studio 2008.
2.
Select File»New»Project. The New Project dialog box launches.
3.
In the Project Types pane, select Measurement Studio under Visual
C# or Visual Basic, depending on which language you want to create
the project in.
4.
In the Templates pane, select NI Windows Application. Specify
MyMeasurementStudioProject for Name and specify a Location
of your choice.
5.
Click OK. The Measurement Studio Application Wizard launches.
6.
Select Analysis Library and Windows Forms User Interface
Control Library.
© National Instruments Corporation
5-3
Measurement Studio User Manual
Chapter 5
Getting Started with Measurement Studio
If you are working with an existing project, you can access the Add/Remove Class
Libraries dialog box by selecting Measurement Studio»View .NET Class Library
Wizard.
Tip
7.
Click Finish to display Form1 in the Windows Forms Designer.
Adding user interface controls to the project
Measurement Studio User Manual
1.
Select View»Toolbox to display the Toolbox. The Toolbox contains
components and controls that you can add to your project.
2.
Expand the All Windows Forms group. The All Windows Forms
group contains controls and components included in the
System.WindowsForms namespace.
3.
Select the Button control and drag and drop it onto the form.
4.
Right-click the button and select Properties to display the Properties
window. You configure the properties of the control in the Properties
window.
5.
The Text property will be highlighted. Type Start for the button text.
5-4
ni.com
Chapter 5
Getting Started with Measurement Studio
6.
Expand the Measurement Studio group in the Toolbox.
7.
Select the WaveformGraph control and drag and drop it onto the
form.
8.
Right-click the waveform graph and select Edit Plots to display
the WaveformPlot Collection Editor dialog box. You use the
WaveformPlot Collection Editor dialog box to add or remove plots and
to configure plot properties.
© National Instruments Corporation
5-5
Measurement Studio User Manual
Chapter 5
Getting Started with Measurement Studio
You can also access the WaveformPlot Collection Editor dialog box by clicking the
waveform graph smart tag. To access the smart tag, left click on the control to select it and
then left click on the arrow button in the upper right corner of the control.
Note
9.
Type Plot for the Name. Click OK.
10. Before you add the Measurement Studio legend, numeric edit, and
gauge controls, you need to resize the form to accommodate them.
Select the form and use the double-sided arrow to resize it.
11. Select the Legend control and drag and drop it onto the form.
12. Select the NumericEdit control and drag and drop it onto the form.
13. Select the Gauge control and drag and drop it onto the form.
14. Click the gauge smart tag to display the Gauge Tasks.
Measurement Studio User Manual
5-6
ni.com
Chapter 5
Getting Started with Measurement Studio
15. Type gauge for the name of the gauge.
The following screenshot shows Form1 with the user controls.
© National Instruments Corporation
5-7
Measurement Studio User Manual
Chapter 5
Getting Started with Measurement Studio
Generating, plotting, and analyzing the data
1.
Double-click the button control to display the Form1 code, with the
cursor inside the click event handler of the button control.
2.
Add the following code to generate random data, plot the data,
calculate the mean of the data, and display the mean on the gauge.
[VB.NET]
' Declare and initialize an instance of WhiteNoiseSignal.
Dim whiteNoise As New WhiteNoiseSignal()
' Store the generated data in a double array named data.
Dim data As Double() = whiteNoise.Generate(1000.0, 256)
' Use the PlotY method to plot the data.
Plot.PlotY(data)
' Use the Mean method to calculate the mean of the data.
Dim mean As Double = Statistics.Mean(data)
' Display the mean on the gauge.
gauge.Value = mean
[C#]
// Declare and initialize an instance of WhiteNoiseSignal.
WhiteNoiseSignal whiteNoise = new WhiteNoiseSignal();
// Store the generated data in a double array named data.
double[] data = whiteNoise.Generate(1000.0, 256);
// Use the PlotY method to plot the data.
Plot.PlotY(data);
// Use the Mean method to calculate the mean of the data.
double mean = Statistics.Mean(data);
// Display the mean on the gauge.
gauge.Value = mean;
Measurement Studio User Manual
5-8
ni.com
Chapter 5
Getting Started with Measurement Studio
Customizing your user interface
1.
Right-click the legend and select Edit Items to display the LegendItem
Collection Editor dialog box. You use the LegendItem Collection
Editor dialog box to add or remove legend items and to configure
legend item properties.
2.
Select Plot in the Source drop-down list and enter Signal in the Text
box. Click OK. Now that you have specified a legend item for the plot,
changes you make to the plot will be reflected on the legend.
3.
Right-click the graph and select Auto Format to display the Auto
Format dialog box. The Auto Format dialog box provides a set of
pre-configured control styles. When you select a style and click OK,
the Auto Format feature configures the appropriate control properties
to reflect the style you chose.
© National Instruments Corporation
5-9
Measurement Studio User Manual
Chapter 5
Getting Started with Measurement Studio
4.
Select Points Only. Click OK. Notice that the legend changed
automatically to match the formatting of the graph.
5.
Click the gauge smart tag to display the Gauge Tasks.
6.
Select Auto Format to display the Auto Format dialog box.
7.
Select Dark and click OK.
8.
Right-click the gauge and select Properties to display the Properties
window.
9.
Set the Range property for the gauge with the drop-down Range type
editor. Type -0.2 for the minimum value and type 0.2 for the
maximum value.
10. Click the numeric edit smart tag to display the Numeric Edit Tasks.
11. Select Gauge in the Source drop-down list. Setting the Source
property to the gauge allows two-way binding between the controls.
12. Deselect ArrowKeys, Buttons, and Text for the InteractionMode
property of the numeric edit control. Deselecting these interaction
modes makes the numeric edit an indicator. The numeric edit control
only displays the calculated mean.
13. Select the Format Mode property and in the Numeric Edit Format
Mode Editor dialog box, change the Precision to 4 to show four
decimal places of precision.
14. Select File»Save Form1.cs to save your application.
Measurement Studio User Manual
5-10
ni.com
Chapter 5
Getting Started with Measurement Studio
15. Select Debug»Start Without Debugging to run the application.
16. After your program builds, click Start. Notice the graph shows the
data plot, and the gauge and the numeric edit display the mean of
the data.
Walkthrough: Creating a Measurement Studio
Application with Web Forms Controls and Analysis
To complete this walkthrough, you must have either the Measurement Studio
Professional or Measurement Studio Enterprise package installed for Visual Studio 2005
or later. This walkthrough will not work with the Measurement Studio Standard package.
Note
Measurement Studio includes user interface controls, such as a waveform
graph control and a gauge control, and Analysis functionality, such as
signal generation and mathematical functions. This walkthrough is
designed to help you learn how to add analysis and presentation
functionality to a Web Forms application by taking you through the
following steps:
•
Setting up the project—Using the Measurement Studio Application
Wizard, you will create a new project that references the Measurement
Studio Analysis class library and Web Forms controls.
•
Adding user interface controls to the project—Using the Toolbox
and the Properties window, you will add and configure a button,
waveform graph, legend, gauge, and numeric edit user interface
control.
© National Instruments Corporation
5-11
Measurement Studio User Manual
Chapter 5
Getting Started with Measurement Studio
•
Generating, plotting, and analyzing the data—Using
NationalInstruments.Analysis.SignalGeneration.White
NoiseSignal and NationalInstruments.Analysis.Math.
Statistics.Mean, you will generate data, plot the generated data on
a waveform graph, and calculate the mean of the data.
•
Customizing the user interface—Using the Collection Editor and
Auto Format dialog boxes, you will display the mean value on the
gauge and the numeric edit, as well as customize your user interface.
Before you begin
The following components are required to complete this walkthrough:
•
Microsoft Visual Studio 2005 or Visual Studio 2008
•
Measurement Studio 8.0.1 or later (Professional or Enterprise
package) for Visual Studio 2005 or Measurement Studio 8.5 or later
(Professional or Enterprise package) for Visual Studio 2008
Setting up the project
Measurement Studio User Manual
1.
Select Start»All Programs»Microsoft Visual Studio 2005»
Microsoft Visual Studio 2005 or Start»All Programs»Microsoft
Visual Studio 2008»Microsoft Visual Studio 2008.
2.
Select File»New»Web Site. The New Web Site dialog box launches.
5-12
ni.com
Chapter 5
3.
Getting Started with Measurement Studio
In the Templates pane, select NI ASP.NET Web Site. Select File
System and specify a file path of your choice.
4.
Use the drop-down box to select Visual C# or Visual Basic, depending
on which language you want to create the project in.
5.
Click OK. The Measurement Studio ASP.NET Web Site Wizard
launches.
6.
Select Analysis Library and Web Forms User Interface Control
Library.
© National Instruments Corporation
5-13
Measurement Studio User Manual
Chapter 5
Getting Started with Measurement Studio
If you are working with an existing project, you can access the Add/Remove Class
Libraries dialog box by selecting Measurement Studio»Add/Remove .NET Class
Libraries Wizard.
Tip
Measurement Studio User Manual
7.
Click Finish to display Default.aspx in the Web Forms Designer.
8.
You can change the title of your Web page. Click inside the <title>
tag and rename the title to Measurement Studio Web Forms
Controls and Analysis Walkthrough.
5-14
ni.com
Chapter 5
Getting Started with Measurement Studio
Adding user interface controls to the project
In this section, you will build a Web page that looks like the following
screenshot.
1.
Click Design in the lower left corner to switch from Source View to
Design View.
2.
Select View»Toolbox to display the Toolbox. The Toolbox contains
components and controls that you can add to your project.
3.
Expand the HTML group on the Toolbox. Select the Table control in
the Toolbox and drag and drop it on the form. You use the table cells
to arrange the user interface controls on your Web page, as shown in
the previous screenshot.
4.
The default table that appears is 3 × 3. This table provides a
customizable form for arranging the user interface controls for your
Web page. Expand the table to approximately 300 px (pixels) tall by
550 px wide by clicking and dragging the table borders.
5.
If you are using Visual Studio 2005, merge the top two cells of all three
columns by selecting the cells, right-clicking, and selecting Merge
Cells. If you are using Visual Studio 2008, merge the top two cells of
all three columns by selecting the cells, right-clicking, and selecting
Modify»Merge Cells.
6.
Expand the Standard group on the Toolbox. The Standard group
contains ASP.NET server controls included in the System.Web.UI
namespace.
© National Instruments Corporation
5-15
Measurement Studio User Manual
Chapter 5
Getting Started with Measurement Studio
7.
Select the Button control and drag and drop it into the lower right table
cell.
8.
Right-click the button and select Properties to display the Properties
window. You configure the properties of the control in the Properties
window.
9.
Scroll to the Text property in the Properties window. Type Start for
the button text.
10. Expand the Measurement Studio group on the Toolbox.
11. Select the WaveformGraph control and drag and drop it into the top
table cell.
12. On the waveform graph smart tag, type graph for the name of the
waveform graph ID.
Tip To access the smart tag, left click on a control to select it and then left click on the
arrow button in the upper right corner of the control.
Measurement Studio User Manual
5-16
ni.com
Chapter 5
Getting Started with Measurement Studio
13. Select the Legend control and drag and drop it into the bottom left
table cell.
14. Select the NumericEdit control and drag and drop it into the bottom
center table cell.
15. On the numeric edit smart tag, type numericedit for the name of the
numeric edit ID.
16. Select the Gauge control and drag and drop it into the top table cell, to
the right of the waveform graph. Resize controls and table cells as
necessary.
17. On the gauge smart tag, type gauge for the name of the gauge ID.
© National Instruments Corporation
5-17
Measurement Studio User Manual
Chapter 5
Getting Started with Measurement Studio
The following screenshot shows Default.aspx with the user controls.
Generating, plotting, and analyzing the data
1.
Double-click the button control to display the Default.aspx.cs
code, with the cursor inside the click event handler of the button
control.
2.
Add the following code to generate random data, plot the data,
calculate the mean of the data, and display the mean on the gauge.
[VB.NET]
' Declare and initialize an instance of WhiteNoiseSignal.
Dim whiteNoise As New WhiteNoiseSignal()
' Store the generated data in a double array named data.
Dim data As Double() = whiteNoise.Generate(1000.0, 256)
' Use the PlotY method to plot the data.
graph.PlotY(data)
' Use the Mean method to calculate the mean of the data.
Dim mean As Double = Statistics.Mean(data)
' Display the mean on the numeric edit.
numericedit.Value = mean
' Display the mean on the gauge.
gauge.Value = mean
Measurement Studio User Manual
5-18
ni.com
Chapter 5
Getting Started with Measurement Studio
[C#]
// Declare and initialize an instance of WhiteNoiseSignal.
WhiteNoiseSignal whiteNoise = new WhiteNoiseSignal();
// Store the generated data in a double array named data.
double[] data = whiteNoise.Generate(1000.0, 256);
// Use the PlotY method to plot the data.
graph.PlotY(data);
// Use the Mean method to calculate the mean of the data.
double mean = Statistics.Mean(data);
// Display the mean on the numeric edit.
numericedit.Value = mean;
// Display the mean on the gauge.
gauge.Value = mean;
Customizing your user interface
1.
Select the Default.aspx tab to return to the Web Forms Designer.
2.
Right-click the legend and select Edit Items to display the LegendItem
Collection Editor dialog box. You use the LegendItem Collection
Editor dialog box to add or remove legend items and to configure
legend item properties.
© National Instruments Corporation
5-19
Measurement Studio User Manual
Chapter 5
Getting Started with Measurement Studio
3.
Select Plots[0] in the Source drop-down list and enter Signal in the
Text box. Click OK. Now that you have specified a legend item for the
plot, changes you make to the plot will be reflected on the legend.
4.
Right-click the graph and select Auto Format to display the Auto
Format dialog box. The Auto Format dialog box provides a set of
pre-configured control styles. When you select a style and click OK,
the Auto Format feature configures the appropriate control properties
to reflect the style you chose.
5.
Select Points Only. Click OK. Notice that the legend changed
automatically to match the formatting of the graph.
6.
Right-click the gauge and select Auto Format to display the Auto
Format dialog box.
7.
Select Dark and click OK.
8.
On the gauge smart tag, set the Range property for the gauge with the
drop-down Range type editor. Type -0.2 for the minimum value and
type 0.2 for the maximum value.
9.
On the numeric edit smart tag, select Indicator for the
InteractionMode property of the numeric edit control.
10. On the numeric edit smart tag, select Format Mode and in the Numeric
Format Mode Editor dialog box, change the Precision to 4 to show four
decimal places of precision. Click OK.
Measurement Studio User Manual
5-20
ni.com
Chapter 5
Getting Started with Measurement Studio
11. Select File»Save Default.aspx to save your application.
12. Select Debug»Start Without Debugging to run the application.
13. After your program builds, click Start. Notice the graph shows the
data plot, and the gauge and the numeric edit display the mean of the
data. The following screenshot shows Default.aspx in its final
form.
© National Instruments Corporation
5-21
Measurement Studio User Manual
Chapter 5
Getting Started with Measurement Studio
Walkthrough: Creating a Measurement Studio
Application with Windows Forms Controls and
Network Variable
To complete this walkthrough, you must have either the Measurement Studio
Professional or Measurement Studio Enterprise package installed for Visual Studio 2005
or later. This walkthrough will not work with the Measurement Studio Standard package.
Note
Measurement Studio includes user interface controls, such as a waveform
graph control, and network variable functionality to transfer live
measurement data between applications over the network. This
walkthrough is designed to help you learn how to add network variable
functionality to a Windows Forms application by taking you through the
following steps:
•
Writing an array of data to the server—Using
NationalInstruments.NetworkVariable.NetworkVariable
BufferedWriter<TValue>, you will create and run a console
application that writes an array of values to the server.
•
Setting up a Windows Forms project—Using the Measurement
Studio Application Wizard, you will create a new project that
references the Measurement Studio Network Variable class library and
Windows Forms controls.
•
Configuring the network variable data source control—Using the
Toolbox and the NationalInstruments.NetworkVariable.
WindowsForms.NetworkVariableDataSource smart tag, you
will add and configure a data source control to your application.
•
Displaying the array of data on a Windows Forms page—Using the
Toolbox, you will add and configure a NationalInstruments.
WaveformGraph control to display the data.
Before you begin
The following components are required to complete this walkthrough:
Measurement Studio User Manual
•
Microsoft Visual Studio 2005 or Visual Studio 2008
•
Measurement Studio 8.0.1 or later (Professional or Enterprise
package) for Visual Studio 2005 or Measurement Studio 8.5 or later
(Professional or Enterprise package) for Visual Studio 2008
5-22
ni.com
Chapter 5
Getting Started with Measurement Studio
Writing an array of data to the server
1.
Select Start»All Programs»Microsoft Visual Studio 2005»
Microsoft Visual Studio 2005 or Start»All Programs»Microsoft
Visual Studio 2008»Microsoft Visual Studio 2008.
2.
Select File»New»Project. The New Project dialog box launches.
3.
In the Project Types pane, select Visual C# or Visual Basic, depending
on which language you want to create the project in.
4.
In the Templates pane, select Console Application. Specify
NetworkVariableWriter for Name and specify a Location of your
choice.
5.
Click OK.
6.
Select Measurement Studio»Add/Remove .NET Class Libraries.
The Measurement Studio Add/Remove Class Libraries Wizard
launches. You use this wizard to add Measurement Studio components
to your project.
© National Instruments Corporation
5-23
Measurement Studio User Manual
Chapter 5
Getting Started with Measurement Studio
7.
Select NetworkVariable Communication Library. Click Finish.
8.
In Program.cs, add the following code to write an array of data to the
server:
You should choose the appropriate code depending on whether you created a VB or
C# project.
Note
[VB.NET]
Imports System
Imports System.Collections.Generic
Imports System.Text
Imports System.Threading
Imports NationalInstruments.NetworkVariable
Module Module1
Private Function GenerateDoubleArray(ByVal phase As Double) As Double()
Dim values(999) As Double
Dim x As Integer
For x = 0 To 999
values(x) = Math.Sin(((2 * Math.PI * x) / 1000) + phase) * 2
Next x
Measurement Studio User Manual
5-24
ni.com
Chapter 5
Getting Started with Measurement Studio
Return values
End Function
Sub Main()
Const location As String = "\\localhost\system\double"
Dim bufferedWriter As NetworkVariableBufferedWriter(Of Double()) =
New
NetworkVariableBufferedWriter(Of Double())(location)
bufferedWriter.Connect()
Dim phase As Integer = 0
While (True)
Dim values As Double() = GenerateDoubleArray(phase)
Console.WriteLine("Writing Array")
bufferedWriter.WriteValue(values)
Thread.Sleep(500)
phase = phase + 1
End While
End Sub
End Module
[C#]
using
using
using
using
using
System;
System.Collections.Generic;
System.Text;
System.Threading;
NationalInstruments.NetworkVariable;
namespace NetworkVariableWriter
{
class Program
{
private static double[] GenerateDoubleArray(double phase)
{
double[] values = new double[1000];
for (int x = 0; x < 1000; x++)
values[x] = Math.Sin(((2 * Math.PI * x) / 1000) + phase) * 2;
return values;
}
static void Main(string[] args)
{
const string Location = @"\\localhost\system\double";
NetworkVariableBufferedWriter<double[]> bufferedWrite = new
NetworkVariableBufferedWriter<double[]>(Location);
bufferedWrite.Connect();
int phase = 0;
while (true)
{
double[] value = GenerateDoubleArray(phase);
Console.WriteLine("Writing array");
© National Instruments Corporation
5-25
Measurement Studio User Manual
Chapter 5
Getting Started with Measurement Studio
bufferedWrite.WriteValue(value);
Thread.Sleep(500);
phase++;
}
}
}
}
9.
Select Debug»Start Without Debugging to run the application.
10. Minimize the console, but keep the application running.
Measurement Studio User Manual
5-26
ni.com
Chapter 5
Getting Started with Measurement Studio
Setting up a Windows Forms project
1.
Select Start»All Programs»Microsoft Visual Studio 2005»
Microsoft Visual Studio 2005.
2.
Select File»New»Project. The New Project dialog box launches.
3.
In the Project types pane, select Measurement Studio under Visual
C# or Visual Basic, depending on which language you want to create
the project in.
4.
In the Templates pane, select NI Windows Application. Name the
project WindowsNetworkVariableReader and specify a Location
you wish to save to project by clicking Browse and navigating to a
directory of your choice.
5.
Click OK. The Measurement Studio Application Wizard launches.
© National Instruments Corporation
5-27
Measurement Studio User Manual
Chapter 5
Getting Started with Measurement Studio
6.
Select Network Variable Communication Library and Windows
Forms User Interface Control Library.
If you are working with an existing project, you can access the Add/Remove Class
Libraries dialog box by selecting Measurement Studio»Add/Remove Class Libraries
Wizard.
Tip
7.
Measurement Studio User Manual
Click Finish to display Form1 in the Windows Forms Designer.
5-28
ni.com
Chapter 5
Getting Started with Measurement Studio
Configuring the network variable data source control
1.
Select View»Toolbox to display the Toolbox. The toolbox contains
components and controls that you can add to your project.
2.
Expand the Measurement Studio group on the Toolbox.
3.
Select the NetworkVariableDataSource control in the toolbox and drag
and drop it on the form. The NetworkVariableDataSource control is a
data source control with functionality similar to System.Web.
UI.WebControls.ObjectDataSource and System.Web.UI.
WebControls.SqlDataSource in the .NET Framework. The
NetworkVariableDataSource control encapsulates Network Variable
functionality.
4.
In the NetworkVariableDataSource smart tag, select Edit Bindings to
launch the NetworkVariableBinding Collection Editor dialog box.
5.
Select Add to create a connection with the underlying network
variable, You can use the NetworkVariableBinding Collection Editor
to configure the binding properties. Enter 0 as the DefaultReadValue.
© National Instruments Corporation
5-29
Measurement Studio User Manual
Chapter 5
Getting Started with Measurement Studio
6.
For the Location, browse to the \\localhost\System\double
location in the Select Network Item dialog box.
7.
Click OK to return to the NetworkVariableBinding Collection Editor
dialog box.
8.
After you configure the binding properties, click OK to return to the
Windows Forms Designer.
Displaying the array of data on a Windows form
Measurement Studio User Manual
1.
Select WaveformGraph in the Toolbox and drag and drop it on the
form.
2.
Right-click the waveform graph and select Properties to display the
Properties window for the graph. You can configure the properties of
the control in the Properties window.
3.
Expand the Data Bindings group in the Properties window.
Select Other Data Sources»Form 1 List Instances»
networkVariableDataSource1»Binding1 from the Binding Data
drop-down list. This will bind the waveform graph to the network
variable that you are writing to in the console application. The
waveform graph will then read and display the data being written to the
network variable.
4.
Select File»Save Form1 to save your application.
5.
Select Debug»Start Without Debugging to run the application. The
waveform graph displays the array of data.
5-30
ni.com
Chapter 5
Getting Started with Measurement Studio
Walkthrough: Creating a Measurement Studio
Application with Web Forms Controls and Network
Variable
To complete this walkthrough, you must have either the Measurement Studio
Professional or Measurement Studio Enterprise package installed for Visual Studio 2005
or later. This walkthrough will not work with the Measurement Studio Standard package.
Note
Measurement Studio includes user interface controls, such as a waveform
graph control, and network variable functionality to transfer live
measurement data between applications over the network. This
walkthrough is designed to help you learn how to add network variable
functionality to a Web Forms application by taking you through the
following steps:
•
Writing an array of data to the server—Using
NationalInstruments.NetworkVariable.NetworkVariable
BufferedWriter<TValue>, you will create and run a console
application that writes an array of values to the server.
•
Setting up a Web Forms project—Using the Measurement Studio
Application Wizard, you will create a new project that references the
Measurement Studio Network Variable class library and Web Forms
controls.
•
Configuring the network variable data source control—Using the
Toolbox and the NationalInstruments.NetworkVariable.
WebForms.NetworkVariableDataSource smart tag, you will add
and configure a data source control to your application.
© National Instruments Corporation
5-31
Measurement Studio User Manual
Chapter 5
Getting Started with Measurement Studio
•
Displaying the array of data on a Web page—Using the Toolbox,
you will add and configure an NationalInstruments.UI.
WebForms.AutoRefresh control and a NationalInstruments.
UI.WebForms.WaveformGraph control to display the data.
Before you begin
The following components are required to complete this walkthrough:
•
Microsoft Visual Studio 2005 or Visual Studio 2008
•
Measurement Studio 8.0.1 or later (Professional or Enterprise
package) for Visual Studio 2005 or Measurement Studio 8.5 or later
(Professional or Enterprise package) for Visual Studio 2008
Writing an array of data to the server
Measurement Studio User Manual
1.
Select Start»All Programs»Microsoft Visual Studio 2005»
Microsoft Visual Studio 2005 or Start»All Programs»Microsoft
Visual Studio 2008»Microsoft Visual Studio 2008.
2.
Select File»New»Project. The New Project dialog launches.
5-32
ni.com
Chapter 5
3.
4.
Getting Started with Measurement Studio
In the Project Types pane, select Visual C# or Visual Basic, depending
on which language you want to create the project in.
In the Templates pane, select Console Application. Specify
NetworkVariableWriter for Name and specify a Location of your
choice.
5.
Click OK.
6.
Select Measurement Studio»Add/Remove .NET Class Libraries.
The Measurement Studio Add/Remove Class Libraries wizard
launches. You use this wizard to add Measurement Studio components
to your project.
7.
Select NetworkVariable Communication Library. Click Finish.
© National Instruments Corporation
5-33
Measurement Studio User Manual
Chapter 5
Getting Started with Measurement Studio
8.
In Program.cs, add the following code to write an array of data to the
server:
[VB.NET]
Imports NationalInstruments.NetworkVariable
Imports System.Threading
Imports System
Module Module1
Private Function GenerateDoubleArray(ByVal phase As Double) As Double()
Dim values(999) As Double
Dim x As Integer
For x = 0 To 999
values(x) = Math.Sin(((2 * Math.PI * x) / 1000) + phase) * 2
Next x
Return values
End Function
Sub Main()
Const location As String = "\\localhost\system\double"
Dim bufferedWriter As NetworkVariableBufferedWriter(Of Double()) =
New NetworkVariableBufferedWriter(Of Double())(location)
bufferedWriter.Connect()
Dim phase As Integer = 0
While (True)
Dim values As Double() = GenerateDoubleArray(phase)
Console.WriteLine("Writing Array")
bufferedWriter.WriteValue(values)
Thread.Sleep(500)
phase = phase + 1
End While
End Sub
End Module
[C#]
using System;
using System.Threading;
using NationalInstruments.NetworkVariable;
namespace NetworkVariableWriter
{
class Program
{
private static double[] GenerateDoubleArray(double phase)
{
double[] values = new double[1000];
for (int x = 0; x < 1000; x++)
values[x] = Math.Sin(((2 * Math.PI * x) / 1000) + phase) * 2;
return values;
Measurement Studio User Manual
5-34
ni.com
Chapter 5
Getting Started with Measurement Studio
}
static void Main(string[] args)
{
const string Location = @"\\localhost\system\double";
NetworkVariableBufferedWriter<double[]> bufferedWriter = new
NetworkVariableBufferedWriter<double[]>(Location);
bufferedWriter.Connect();
int phase = 0;
while (true)
{
double[] value = GenerateDoubleArray(phase);
Console.WriteLine("Writing array");
bufferedWriter.WriteValue(value);
Thread.Sleep(500);
phase++;
}
}
}
}
9.
Select Debug»Start Without Debugging to run the application.
10. Minimize the console application, but keep the application running.
© National Instruments Corporation
5-35
Measurement Studio User Manual
Chapter 5
Getting Started with Measurement Studio
Setting up a Web Forms project
1.
Select Start»All Programs»Microsoft Visual Studio 2005»
Microsoft Visual Studio 2005 or Start»All Programs»Microsoft
Visual Studio 2008»Microsoft Visual Studio 2008.
2.
Select File»New»Web Site. The New Web Site dialog box launches.
3.
In the Templates pane, select NI ASP.NET Web Site. Select File
System for Location and specify a file path of your choice.
Measurement Studio User Manual
4.
Use the drop-down box to select Visual C# or Visual Basic, depending
on which language you want to create the project in.
5.
Click OK. The Measurement Studio ASP.NET Web Site Wizard
launches.
5-36
ni.com
Chapter 5
6.
Getting Started with Measurement Studio
Select Network Variable Communication Library and Web Forms
User Interface Control Library.
If you are working with an existing project, you can access the Add/Remove Class
Libraries dialog box by selecting Measurement Studio»Add/Remove Class Libraries
Wizard.
Tip
7.
Click Finish to display Default.aspx in the Web Forms Designer.
8.
You can rename the title of your Web page. Click inside the <title>
tag and rename the title to Measurement Studio Network Variable
and Web Forms Controls Walkthrough.
© National Instruments Corporation
5-37
Measurement Studio User Manual
Chapter 5
Getting Started with Measurement Studio
Configuring the network variable data source control
Measurement Studio User Manual
1.
Click Design in the lower left corner to switch from Source View to
Design View.
2.
Select View»Toolbox to display the Toolbox. The toolbox contains
components and controls that you can add to your project.
3.
Expand the Measurement Studio group on the Toolbox.
4.
Select the NetworkVariableDataSource control in the toolbox and drag
and drop it on the form. The NetworkVariableDataSource control is a
data source control with functionality similar to System.Web.UI.
WebControls.ObjectDataSource and System.Web.UI.
WebControls.SqlDataSource in the .NET Framework. The
NetworkVariableDataSource control encapsulates Network Variable
functionality.
5.
In the NetworkVariableDataSource smart tag, select Edit Bindings to
launch the NetworkVariableBinding Collection Editor dialog box.
5-38
ni.com
Chapter 5
Getting Started with Measurement Studio
6.
Select Add. You add a binding to create a connection with the
underlying network variable, and you use the NetworkVariableBinding
Collection Editor to configure the binding properties. Select Object
for the BindingType. You select Object because this walkthrough
binds to NationalInstruments.UI.WebForms.
WaveformGraph.BindingData. Enter 0 as the DefaultReadValue.
7.
Browse to the \\localhost\System\double location in the Select
Network Item dialog box.
© National Instruments Corporation
5-39
Measurement Studio User Manual
Chapter 5
Getting Started with Measurement Studio
8.
Click OK to return to the NetworkVariableBinding Collection Editor
dialog box.
9.
After you configure the binding properties, click OK to return to the
ASP.NET Designer.
Displaying the array of data on a Web page
Measurement Studio User Manual
1.
Select WaveformGraph in the Toolbox and drag and drop it on the
form.
2.
Select AutoRefresh in the Toolbox and drag and drop it on the form.
3.
In the AutoRefresh smart tag, check Enabled. Select Edit Default
Refresh Items to launch the RefreshItem Collection Editor dialog
box.
5-40
ni.com
Chapter 5
Getting Started with Measurement Studio
4.
Select Add. Select WaveformGraph1 for the ItemID and click OK.
5.
Double-click the AutoRefresh control. Add the following code to the
AutoRefresh event handler to bind the waveform graph control to the
network variable data source control:
[VB.NET]
WaveformGraph1.BindingData =
NetworkVariableDataSource1.Bindings(0).GetValue()
[C#]
WaveformGraph1.BindingData =
NetworkVariableDataSource1.Bindings[0].GetValue();
© National Instruments Corporation
5-41
Measurement Studio User Manual
Chapter 5
Getting Started with Measurement Studio
6.
Select File»Save Default.aspx to save your application.
7.
Select Debug»Start Without Debugging to run the application. The
waveform graph displays the array of data.
Note You can also use the System.Web.UI.WebControls.FormView control
to bind to NationalInstruments.NetworkVariable.WebForms.
NetworkVariableDataSource. Refer to Using the Measurement Studio Network
Variable Data Source in Web Forms for more information.
Walkthrough: Creating a Measurement Studio
NI-DAQmx Application
To complete this walkthrough, you must have either the Measurement Studio
Professional or Measurement Studio Enterprise package installed. This walkthrough
requires the DAQ Assistant, which is not included in the Measurement Studio Standard
package.
Note
This walkthrough is designed to help you learn how to create an
NI-DAQmx applicationby taking you through the following steps:
•
Measurement Studio User Manual
Setting up the project—Using the Measurement Studio DAQ
Application Wizard, you will create a new project that references the
NI-DAQmx assembly and launches the DAQ Assistant to create an
NI-DAQmx task.
5-42
ni.com
Chapter 5
Getting Started with Measurement Studio
•
Configuring your task—Using the DAQ Assistant, you will
interactively configure and save your task. The wizard then generates
code to reflect your configuration settings. The wizard also generates
a component that provides common operations for your task and
integration with the Windows Forms designer.
•
Creating a custom user interface for the task—Using the DAQ
Component UI generation wizard, you will create a custom user
interface that uses the DAQ component you created to automatically
plot the DAQ signal.
Before you begin
The following components are required to complete this walkthrough:
•
Visual Studio 2005 or Visual Studio 2008
•
Measurement Studio 8.0.1 or later (Professional or Enterprise
package) for Visual Studio 2005 or Measurement Studio 8.5 or later
(Professional or Enterprise package) for Visual Studio 2008
•
NI-DAQmx 8.1 or later for Visual Studio 2005 or NI-DAQmx 8.7.1 or
later for Visual Studio 2008
•
NI-DAQmx-supported DAQ device or simulated device
For information about installing and configuring your DAQ device, refer to
the DAQ Getting Started Guide. You can also use a simulated device to
complete this walkthrough. For information on how to create an
NI-DAQmx simulated device, refer to Creating NI-DAQmx Simulated
Devices in the Measurement & Automation Explorer Help for NI-DAQmx.
To open this help, select Start»All Programs»National Instruments»
Measurement & Automation. In Measurement & Automation Explorer
(MAX), select Help»Help Topics»NI-DAQmx»MAX Help for
NI-DAQmx. For the purposes of this walkthrough, the NI PCI-6280 device
of the M Series DAQ family is recommended.
To set up the project
1.
Open Visual Studio from Start»All Programs»Microsoft Visual
Studio 2005»Microsoft Visual Studio 2005 or Start»All Programs»
Microsoft Visual Studio 2008»Microsoft Visual Studio 2008.
2.
Select File»New»Project.The New Project dialog box launches.
© National Instruments Corporation
5-43
Measurement Studio User Manual
Chapter 5
Getting Started with Measurement Studio
3.
4.
In the Project types pane, expand the Visual C# or Visual Basic node,
depending on which language you want to create the project in, and
select Measurement Studio. Code generation works in both
languages.
In the Templates pane, select NI DAQ Windows Application. Specify
MyDAQmxProject for Name and specify a Location of your choice.
Click OK. The Measurement Studio DAQ Application Wizard
launches.
Measurement Studio User Manual
5-44
ni.com
Chapter 5
5.
Getting Started with Measurement Studio
In the Add DAQ Component dialog box, you can choose to create a
new project task, create a new MAX task, create a reference to a MAX
task, copy a MAX task to a project task, or copy an existing .mxb. For
this walkthrough, select Create a new project task and click Finish.
The Measurement Studio DAQ Application Wizard automatically sets up
your data acquisition project and launches the DAQ Assistant.
© National Instruments Corporation
5-45
Measurement Studio User Manual
Chapter 5
Getting Started with Measurement Studio
To configure your task
Measurement Studio User Manual
1.
In the Create New dialog box of the DAQ Assistant, you can begin to
interactively define your DAQ task. Select Acquire Signals, and then
Analog Input as the measurement type for your task.
2.
Next, select Voltage.
5-46
ni.com
Chapter 5
3.
Getting Started with Measurement Studio
From the Supported Physical Channels tree in the Physical tab,
select the physical channel, such as ai1, on the DAQ device to which
you connected the voltage signal. Click Finish.
You can also use a simulated device in this walkthrough. For more information, refer
to Creating NI-DAQmx Simulated Devices in the Measurement & Automation Explorer
Help for NI-DAQmx.
Note
© National Instruments Corporation
5-47
Measurement Studio User Manual
Chapter 5
Getting Started with Measurement Studio
4.
Measurement Studio User Manual
In the Edit DAQ Task dialog box, you can edit the configuration of
your DAQ task. If the embedded DAQ Assistant help is not open by
default, click the Show Help button in the upper-right corner of the
window to display the help.
5-48
ni.com
Chapter 5
Getting Started with Measurement Studio
5.
To complete the DAQ configuration, select the N Samples Acquisition
Mode in the Timing Settings section. For more information on
timing, refer to Timing in the NI-DAQmx Help.
6.
Next, click the Run button in the toolbar near the top of the Edit DAQ
Task dialog box. The test runs automatically. You can run the test in the
DAQ Assistant to test the task and make sure you connected the signal
properly. If necessary, you can modify the settings before any code is
generated.
7.
Click the Finish button in the Edit DAQ Task dialog box to complete
the configuration of your DAQ task and to launch the Configure DAQ
Component UI wizard.
© National Instruments Corporation
5-49
Measurement Studio User Manual
Chapter 5
Getting Started with Measurement Studio
To create a custom user interface for the task
Measurement Studio User Manual
1.
In the Configure DAQ Component UI wizard, you can customize and
preview a user interface and code for your task.
2.
Click Finish to generate the task user interface in your project form.
5-50
ni.com
Chapter 5
Getting Started with Measurement Studio
The wizard also generates event handlers and code to acquire data and
present it on your generated user interface.
© National Instruments Corporation
5-51
Measurement Studio User Manual
Chapter 5
Getting Started with Measurement Studio
3.
Press <F5> to run the application.
4.
After you have started the application, click the Read button to begin
acquiring data from your DAQ device.
What’s next
To learn more about tasks, channels, and other NI-DAQmx concepts, refer
to the NI-DAQmx Help located at Start»All Programs»National
Instruments»NI-DAQ»NI-DAQmx Help.
For more information about creating and using tasks in Measurement
Studio, refer to Using the Measurement Studio NI-DAQmx .NET Library.
You can also look at examples that ship with NI-DAQmx. Refer to
Measurement Studio NI-DAQmx .NET Examples for the locations of these
examples.
Walkthrough: Creating a Measurement Studio
Instrument I/O Application
To complete this walkthrough, you must have either the Measurement Studio
Professional or Measurement Studio Enterprise package installed. This walkthrough
requires the Instrument I/O Assistant, which is not included in the Measurement Studio
Standard package.
Note
Measurement Studio User Manual
5-52
ni.com
Chapter 5
Getting Started with Measurement Studio
The National Instruments Instrument I/O Assistant organizes instrument
communication for a serial, Ethernet, or GPIB instrument into ordered
steps. This walkthrough is designed to help you learn how to build an
instrument I/O application by taking you through the following steps:
•
Setting up the project—Using the Measurement Studio VISA
Windows Application project, you will create a new project that
references the VisaNS assembly and launches the Instrument I/O
Assistant to create a VisaNS task.
•
Performing a query on the instrument—Using the Instrument I/O
Assistant, you will write a command to an instrument and read the
instrument response.
•
Displaying Instrument I/O Assistant data on your UI—Using text
box and button controls, you will create a Windows Forms application
to display the Instrument I/O Assistant data.
Before you begin
The following components are required to complete this walkthrough:
•
Visual Studio 2005 or Visual Studio 2008
•
Measurement Studio 8.0.1 or later (Professional or Enterprise
package) for Visual Studio 2005 or Measurement Studio 8.5 or later
(Professional or Enterprise package) for Visual Studio 2008
•
National Instruments Device Driver CD
•
Message-based instrument on a supported VISA bus, such as GPIB or
Serial
Note For more information about the Instrument I/O Assistant, refer to the Instrument I/O
Assistant Help by selecting the Show Help button inside the assistant.
Setting up the project
1.
Open Visual Studio from Start»All Programs»Microsoft Visual
Studio 2005»Microsoft Visual Studio 2005 or Start»All Programs»
Microsoft Visual Studio 2008»Microsoft Visual Studio 2008.
2.
Select File»New»Project. The New Project dialog box launches.
© National Instruments Corporation
5-53
Measurement Studio User Manual
Chapter 5
Getting Started with Measurement Studio
Measurement Studio User Manual
3.
In the Project Types pane, select Measurement Studio under Visual
C# or Visual Basic, depending on which language you want to create
the project in. This walkthrough refers to Visual C#, but you can follow
the same process if you use Visual Basic .NET.
4.
In the Templates pane, select NI VISA Windows Application.
Specify MyIIOAProject for Name and select a Location of your
choice.
5.
Click OK. Your project opens in Visual Studio with a VisaTask.mxb
file and references to NationalInstruments.VisaNS,
NationalInstruments.UI.WindowsForms, and
NationalInstruments created for you.
6.
Select View»Solution Explorer to display the Solution Explorer.
Double-click VisaTask.mxb in the Solution Explorer to launch the
Instrument I/O Assistant.
5-54
ni.com
Chapter 5
Getting Started with Measurement Studio
Performing a query on the instrument
This walkthrough was created using the NI Instrument Simulator. Any identification
information or sample code generated for this device will be different depending on the
instrument actually used.
Note
1.
The Select Instrument step automatically appears in the Step
Sequence window when you launch the Instrument I/O Assistant.
Select the instrument you want to communicate with or the port to
which your instrument is connected from the Select an instrument
drop-down listbox.
2.
Select Add Step and then select Query and Parse from the expanded
list. You use a Query and Parse step to both write a command to an
instrument and read the instrument’s response.
3.
Enter the command *idn? and click Run this step. The *idn?
command is a standard instrument command for querying an
instrument’s identification information. If your instrument does not
support the *idn? command, refer to the documentation for the
instrument for more information about the instrument’s command set.
4.
Click Auto parse to parse the instrument’s response. The Auto parse
button automatically parses binary block data and ASCII text. Refer to
the Parsing an Instrument Response topic in the Instrument I/O
Assistant Help for information about how the Assistant parses different
data formats.
© National Instruments Corporation
5-55
Measurement Studio User Manual
Chapter 5
Getting Started with Measurement Studio
Measurement Studio User Manual
5.
If there are more than two tokens in the token list, remove them for this
example. To remove a token, right-click on it in the response window
and select Remove. The response window displays data in binary
form, ASCII form, or binary form and ASCII form together. If there is
only one token in the token list, split the token into two tokens for this
example. Refer to Parsing an Instrument Response in the Instrument
I/O Assistant Help for more information about how to manually parse
the data into two tokens.
6.
In the Token name text box, enter Vendor to rename the first token.
You use this name to reference the token in your application. Ensure
that the data type of the token is String. You specify the data type of
the token using the Type drop-down list on the Data Type tab.
7.
Select Token2, rename it to Device, and ensure that the data type for
Token2 is String. To select Token2, left click on it within the Query
and Parse step in the Step Sequence window on the left side of the
Instrument I/O Assistant. Follow the instructions from step 6 to change
the token name and to set the token data type.
8.
Select File»Save to save your task.
9.
Select View»Solution Explorer to display the Solution Explorer.
5-56
ni.com
Chapter 5
Getting Started with Measurement Studio
10. Click the Show All Files icon and expand the VisaTask.mxb node.
11. Double-click the VisaNSTask1 file to view the code that the
Instrument I/O Assistant generated for you.
Displaying Instrument I/O Assistant data on your user interface
1.
Double-click the Form1 file in the Solution Explorer to open your
main application form.
2.
Select View»Toolbox to display the Toolbox.
3.
Expand the All Windows Forms group on the Toolbox.
4.
Select the Button control and drag and drop it onto the form.
5.
Select the TextBox control and drag and drop it onto the form. Repeat
this step to add a second text box to the form. The following screenshot
shows the controls on the form:
6.
Double-click the Button control to display the Form1 code, with the
cursor inside the click event handler of the button control.
© National Instruments Corporation
5-57
Measurement Studio User Manual
Chapter 5
Getting Started with Measurement Studio
7.
Add the following code to display the vendor and model name of your
instrument in the text boxes.
[VB.NET]
' Declare an instance of VisaTask
Dim myTask As New VisaTask()
Dim results As VisaTaskResults
'Display the data in the text boxes
results = myTask.Run()
textBox1.Text = results.Vendor
textBox2.Text = results.Device
[C#]
//Declare an instance of VisaTask
VisaTask myTask = new VisaTask();
//Display the data in the text boxes
VisaTaskResults results = myTask.Run();
textBox1.Text = results.Vendor;
textBox2.Text = results.Device;
Note
Your sample code will be different depending on the instrument actually used.
8.
Build and run the application.
9.
Click the Button on the form to run the task. The following
screenshot shows the controls on the form, with sample returned data.
Although this walkthrough only covers the use of a simple Query and Parse step,
the Instrument I/O Assistant offers additional capabilities, such as independent Write and
Read and Parse steps and advanced parsing capabilities. The following screenshot shows
the IIOA’s ability to scale and parse IEEE long definite block data.
Note
Measurement Studio User Manual
5-58
ni.com
Technical Support and
Professional Services
A
Visit the following sections of the award-winning National Instruments
Web site at ni.com for technical support and professional services:
•
Support—Technical support resources at ni.com/support include
the following:
–
Self-Help Technical Resources—For answers and solutions,
visit ni.com/support for software drivers and updates, a
searchable KnowledgeBase, product manuals, step-by-step
troubleshooting wizards, thousands of example programs,
tutorials, application notes, instrument drivers, and so on.
Registered users also receive access to the NI Discussion Forums
at ni.com/forums. NI Applications Engineers make sure every
question submitted online receives an answer.
–
Standard Service Program Membership—This program
entitles members to direct access to NI Applications Engineers
via phone and email for one-to-one technical support as well as
exclusive access to on demand training modules via the Services
Resource Center. NI offers complementary membership for a full
year after purchase, after which you may renew to continue your
benefits.
For information about other technical support options in your
area, visit ni.com/services, or contact your local office at
ni.com/contact.
•
Training and Certification—Visit ni.com/training for
self-paced training, eLearning virtual classrooms, interactive CDs,
and Certification program information. You also can register for
instructor-led, hands-on courses at locations around the world.
•
System Integration—If you have time constraints, limited in-house
technical resources, or other project challenges, National Instruments
Alliance Partner members can help. To learn more, call your local
NI office or visit ni.com/alliance.
© National Instruments Corporation
A-1
Measurement Studio User Manual
Appendix A
Technical Support and Professional Services
If you searched ni.com and could not find the answers you need, contact
your local office or NI corporate headquarters. Phone numbers for our
worldwide offices are listed at the front of this manual. You also can visit
the Worldwide Offices section of ni.com/niglobal to access the branch
office Web sites, which provide up-to-date contact information, support
phone numbers, email addresses, and current events.
Measurement Studio User Manual
A-2
ni.com
Glossary
A
ActiveX
Set of Microsoft technologies for reusable software components. Formerly
called OLE.
ActiveX control
Reusable software component that adds functionality to any ActiveX
control container through exposed properties, methods, and events. The
Measurement Studio data acquisition, user interface, and analysis controls
are examples of ActiveX controls.
ActiveX control
container
Development environment that fully supports ActiveX controls and
integrates them into its own environment using COM. An ActiveX control
container enables you to specify how ActiveX controls interact with the
environment through environment properties. Visual Basic is an example of
an ActiveX control container.
analog I/O
Reading or writing data in continuously variable physical quantities, such
as voltage or current.
annotate
Adding text, arrows, or shapes to describe or highlight a point or region on
a graph.
ANSI C
C programming language defined by the American National Standards
Institute.
API
Application Programming Interface. A specification of software functions
and their input and return parameters.
array control
An array of Measurement Studio user interface controls that behave as a
single unit.
assembly
A collection of one or more files that are versioned and deployed as a unit.
An assembly is the primary building block of a .NET Framework
application. All managed types and resources are contained within an
assembly and are marked either as accessible only within the assembly or
as accessible from code in other assemblies.
asynchronous
Function that begins an operation and returns control to the program prior
to the completion or termination of the operation.
© National Instruments Corporation
G-1
Measurement Studio User Manual
Glossary
B
button
A control used to input or display Boolean information or to initiate an
action in a program.
C
channel
1. Physical—a terminal or pin at which you can measure or generate an
analog or digital signal. A single physical channel can include more than
one terminal, as in the case of a differential analog input channel or a digital
port of eight lines. The name used for a counter physical channel is an
exception because that physical channel name is not the name of the
terminal where the counter measures or generates the digital signal.
2. Virtual—a collection of property settings that can include a name, a
physical channel, input terminal connections, the type of measurement or
generation, and scaling information. You can define NI-DAQmx virtual
channels outside a task (global) or inside a task (local). Configuring virtual
channels is optional in Traditional NI-DAQ and earlier versions, but is
integral to every measurement you take in NI-DAQmx. In Traditional
NI-DAQ, you configure virtual channels in MAX. In NI-DAQmx, you can
configure virtual channels in either MAX or in a program, and you can
configure channels as part of a task or separately.
3. Switch—a switch channel represents any connection point on a switch.
It may be made up of one or more signal wires (commonly one, two, or
four), depending on the switch topology. A virtual channel cannot be
created with a switch channel. Switch channels may be used only in the
NI-DAQmx Switch functions and VIs.
chart
To append new data points to the end of an existing plot over time.
client callback
In Web Forms, page calls back to the server without fully posting back.
Callbacks are asynchronous and are accomplished with XML-HTTP.
Client callbacks do not include postback data, and they do not force the
page to refresh. Client callbacks do require a browser that supports the
XML-HTTP protocol.
CodeBuilder
LabWindows/CVI feature that creates code based on a .uir file to connect
your GUI to the rest of your program. This code can be compiled and run
as soon as it is created.
Measurement Studio User Manual
G-2
ni.com
Glossary
coercion
Automatic conversion that Measurement Studio controls perform to change
the numeric representation of a data element.
COM
Component Object Model. Microsoft specification for architecting and
developing reusable software components.
complex graph
A control that displays a ComplexDouble data type; the ComplexDouble
data type represents a complex number of type Double that is composed of
a real part and an imaginary part.
context-sensitive help
Help for dialog boxes, the controls in dialog boxes, and keywords in source
code that you can access with the key or a Help button, or by clicking the
link that appears in the Dynamic Help window in Visual Studio.
control
1. ActiveX control. See ActiveX control.
2. Object for entering, displaying, or manipulating data on a user interface.
counter/timer I/O
Reading or writing data based on high-precision timing through a counter
or timer. By combining a counter with a highly accurate clock, you can
create a wide variety of timing and counting applications, such as
monitoring and analyzing digital waveforms and generating complex
square waves.
cursor
Flashing rectangle that shows where you may enter text on the screen. If
you have a mouse installed, there is a rectangular mouse cursor, or pointer.
cursor label
Text object used to display X and Y coordinates that a cursor crosshair
points to on a graph.
D
DAQ
Data acquisition. Process of acquiring data, typically from A/D or digital
input plug-in boards.
DAQ Assistant
A graphical interface for configuring measurement tasks, channels, and
scales.
DAQ device
A device that acquires or generates data and can contain multiple channels
and conversion devices. DAQ devices include plug-in devices, PCMCIA
cards, and DAQPad devices, which connect to a computer USB or 1394
(FireWire®) port. SCXI modules are considered DAQ devices.
© National Instruments Corporation
G-3
Measurement Studio User Manual
Glossary
DataSocket
Technology that simplifies live data exchange between applications and
HTTP, FTP, OPC, logos (Lookout objects) and file servers over the Internet.
It provides one common API to a number of different communication
protocols.
device
An instrument or controller you can access as a single entity that controls
or monitors real-world I/O points. A device is often connected to a host
computer through some type of communication network. See also DAQ
device and measurement device.
digital I/O
Reading or writing digital representations of data in discrete units (the
binary digits 1 and 0). Digital information is either on or off.
digital waveform
graph
A control that displays DigitalWaveform data on a Windows Forms or
Web Forms user interface; the DigitalWaveform data type represents a
set of digital states that are grouped by samples or signals.
distribution
Ability to install programs you develop with Measurement Studio to others
working on different computers.
DLL
Dynamic Link Library. A library of functions that link to a program and
load at run time rather than being compiled into the program. Loading
libraries only when they are needed saves memory in software applications.
DMM
Digital Multimeter. A common measurement instrument that measures
resistance, current, and voltage in a wide variety of applications.
downlevel browser
Previous generation Web browser with limited client interaction. See also
uplevel browser.
driver
Software that controls a specific hardware device, such as a data acquisition
board or GPIB interface board. See also instrument driver.
DSTP
DataSocket Transfer Protocol. Protocol based on TCP/IP to exchange data
directly between two applications using DataSocket clients. Data is passed
through a DataSocket Server between the applications.
Measurement Studio User Manual
G-4
ni.com
Glossary
E
Ethernet
Standard connection type for networks, where computers are connected by
coaxial or twisted-pair cable.
event
Object-generated response to some action or change in state, such as a
mouse click or a completed acquisition. The event calls an event procedure
that processes the event.
executable
Program file with a .exe extension that you can run independently of the
development environment in which it was created.
F
form
Window or area on the screen on which you place controls and indicators
to create the user interface for your program.
front panel
Interactive user interface of a virtual instrument. Modeled after the front
panel of physical instruments, it is composed of switches, slides, meters,
graphs, charts, gauges, LEDs, and other controls and indicators.
FTP
File Transfer Protocol. Protocol based on TCP/IP to exchange files between
computers.
G
gauge
A control used to input or display numerical data.
GPIB
General Purpose Interface Bus. The standard bus used for controlling
electronic instruments with a computer. Also called IEEE 488 bus because
it is defined by ANSI/IEEE Standards 488-1978, 488.1-1987, and
488.2-1987.
graph
A 2D or 3D display of one or more plots.
H
HTTP
HyperText Transfer Protocol. Protocol based on TCP/IP, which is used to
download Web pages from an HTTP server to a Web browser.
© National Instruments Corporation
G-5
Measurement Studio User Manual
Glossary
I
IEEE 488
Shortened notation for ANSI/IEEE Standards 488-1978, 488.1-1987, and
488.2-1987. See also GPIB.
IMAQ Vision
National Instruments image acquisition and analysis software that you can
use to acquire images from National Instruments image acquisition
(IMAQ) boards, display them in your program, perform interactive viewer
operations, and analyze the images to extract information.
indicator
A control in read-only mode.
installer
Software program that copies program, system, and other necessary files to
computers.
instrument driver
Library of functions to control and use one specific physical instrument.
Also a set of functions that adds specific functionality to an application.
Instrument I/O
Assistant
Assists in writing code to communicate with devices such as serial,
Ethernet, or GPIB instruments. The Instrument I/O Assistant provides a
user interface within the Visual Studio environment. You use the
Instrument I/O Assistant to interactively write commands to a device, read
data that the device returns, and specify how to parse the response.
interface
Connection between one or more of the following: hardware, software, and
the user. For example, hardware interfaces connect two other pieces of
hardware.
IVI
Interchangeable Virtual Instruments. A technology involving standard
programming interfaces for classes of instruments, such as oscilloscopes,
DMMs, and function generators, that results in hardware-independent
instrument drivers. The IVI standard programming interfaces have been
defined by the IVI Foundation, an industry consortium. Refer to
www.ivifoundation.org for more information.
K
knob
Measurement Studio User Manual
A control used to input or display numerical data.
G-6
ni.com
Glossary
L
LabVIEW
Laboratory Virtual Instrument Engineering Workbench. Graphical
development environment used for developing test and measurement
applications.
LabWindows/CVI
ANSI C development environment for building test and measurement
applications.
LED
Light-Emitting Diode. An indicator that emits a light when current passes
through it. For example, an LED shows if your computer or printer is turned
on.
legend
A control that displays symbols and descriptions for a specific set of
elements of another object, such as the plots or cursors of a graph.
M
matrix
A rectangular array of numbers or mathematical elements that represent the
coefficients in a system of linear equations.
MB
Megabytes of memory.
Measurement &
Automation Explorer
(MAX)
National Instruments tool for configuring your National Instruments
hardware and driver software; executing system diagnostics; adding new
devices, interfaces, and virtual channels; and viewing devices and
instruments connected to your system.
measurement device
DAQ devices such as the E Series multifunction I/O (MIO) devices, SCXI
signal conditioning modules, and switch modules.
Measurement Studio
National Instruments software that includes tools to build measurement
applications in Visual Basic .NET, Visual C#, and Visual C++.
meter
A control used to input or display numerical data.
method
Function that performs a specific action on or with an object. The operation
of the method often depends on the values of the object properties.
MFC
Microsoft Foundation Class. A framework for programming in Microsoft
Windows, MFC provides code for managing windows, menus, and dialog
boxes; performing basic input/output; storing collections of data objects;
and more.
© National Instruments Corporation
G-7
Measurement Studio User Manual
Glossary
N
NI-488.2
Driver-level software to control and communicate with National
Instruments GPIB hardware.
NI-DAQ
Driver-level software to control and communicate with DAQ hardware.
NI-DAQ is an extensive library of VIs and functions you can call from an
application development environment (ADE) to program all the features of
an NI measurement device, such as configuring, acquiring and generating
data from, and sending data to the device.
NI-DAQmx
The latest NI-DAQ driver with new VIs, functions, and development tools
for controlling measurement devices. The advantages of NI-DAQmx over
earlier versions of NI-DAQ include the DAQ Assistant for configuring
channels and measurement tasks for your device for use in LabVIEW,
LabWindows/CVI, and Measurement Studio; increased performance such
as faster single-point analog I/O; and a simpler API for creating DAQ
applications using fewer functions and VIs than earlier versions of
NI-DAQ.
NI-IMAQ
Driver-level software to control and communicate with National
Instruments image acquisition hardware.
numeric edit
A control used to display and edit numeric values.
O
OCX
OLE Control eXtension. Another name for ActiveX controls, reflected by
the .ocx file extension of ActiveX control files.
OLE
Object Linking and Embedding. See also ActiveX.
OPC
OLE for Process Control. An industry standard based on ActiveX and
COM technologies that enables you to create a single client application
that can communicate with disparate devices. Refer to
www.opcfoundation.org for more information.
oscilloscope
Measurement instrument widely used in high-speed testing applications,
such as telecommunication physical layer testing, video testing, and
high-speed digital design verification.
Measurement Studio User Manual
G-8
ni.com
Glossary
P
PCI
Peripheral Component Interconnect. High-performance expansion bus
architecture commonly found in PCs.
PID
Proportional-Integral-Derivative. A three-term control mechanism
combining proportional, integral, and derivative control. You might use a
PID algorithm to control processes such as heating and cooling systems,
fluid level monitoring, flow control, and pressure control.
plot
1. Trace (data line) on a graph representing the data in one row or column
of an array.
2. To display a new set of data while deleting any previous data on the
graph.
point
Structure that contains two 16-bit integers that represent horizontal and
vertical coordinates.
postback
The process in which a Web page sends data back to the same page on the
server.
property
Attribute that defines the appearance or state of an object. The property can
be a specific value or another object with its own properties and methods.
For example, a value property is the color (property) of a plot (object),
while an object property is a specific Y axis (property) on a graph (object).
The Y axis itself is another object with properties, such as minimum and
maximum values.
property editor
A control used to configure properties for Windows Forms controls at run
time.
property pages
Window or dialog box that displays current configuration information and
allows users to modify the configuration.
PXI
PCI eXtensions for Instrumentation. Rugged, open platform for modular
instrumentation with specialized mechanical, electrical, and software
features. Refer to www.pxisa.org for more information.
© National Instruments Corporation
G-9
Measurement Studio User Manual
Glossary
R
range
Region between the limits within which a quantity is measured, received,
or transmitted. The range is expressed by stating the lower and upper range
values.
S
scalar
Number that a point on a scale can represent. The number is a single value
as opposed to an array.
scale
Part of graph, chart, and some numeric controls and indicators that contains
a series of marks or points at known intervals to denote units of measure.
scatter graph
A control that displays two-dimensional data on a Windows Forms or Web
Forms user interface; displays a graph of X and Y data pairs.
scope
See oscilloscope.
serial
Standard serial bus on a computer used to communicate with instruments.
Also known as RS-232.
slide
A control used to input or display numerical data.
slider
Moveable part of a slide control.
smart tag
A glyph attached to a Measurement Studio control or component that
exposes commonly performed tasks.
switch
A control used to receive and control Boolean input in an application user
interface.
synchronous
Property or operation that begins and returns control to the program only
when the operation is complete.
T
tank
A control used to input or display numerical data.
task
NI-DAQmx—a set of channels and the channel configurations, timing, and
triggering, and other details that define a measurement or generation you
want to perform.
Measurement Studio User Manual
G-10
ni.com
Glossary
TCP/IP
Transmission Control Protocol/Internet Protocol. A standard format for
transferring data in packets from one computer to another. The two parts of
TCP/IP are TCP, which deals with the construction of data pockets, and IP,
which routes them from computer to computer.
TestStand
Ready-to-run test executive from National Instruments for organizing,
controlling, and executing your automated prototype, validation, or
manufacturing test systems.
thermometer
A control used to input or display numerical data.
U
UI
User Interface.
uplevel browser
Recent generation Web browser that supports rich client interaction and
functionality. See also downlevel browser.
V
vector
1D array.
virtual instrument (VI)
Program in Measurement Studio that models the appearance and function
of a physical instrument.
VISA
Driver-software architecture developed by National Instruments to unify
instrumentation software for serial, GPIB, and VXI instruments or
controllers. It has been accepted as a standard for VXI by the
VXIplug&play Systems Alliance.
VXI
VME eXtension for Instrumentation. Instrumentation architecture and bus
based on the VME standard. Used in high-end test applications.
W
waveform graph
A control that displays two-dimensional data on a Windows Forms or Web
Forms user interface; displays data that is uniformly spaced in one
dimension.
© National Instruments Corporation
G-11
Measurement Studio User Manual
Index
A
B
ActiveX controls in Visual C++, 3-2
Add/Remove Class Libraries wizard, 4-5
adding or removing Measurement Studio class
libraries, 4-5
Analysis
.NET class library, 2-2
Array and Numeric Operations
(table), 2-9
Curve Fitting (table), 2-10
Enterprise Analysis, 2-3
Filters (table), 2-5
Linear Algebra (table), 2-7
Measurements (table), 2-3
Professional Analysis, 2-2
Signal Generation (table), 2-4
Signal Processing (table), 2-6
Standard Analysis, 2-2
Statistics (table), 2-10
Windowing (table), 2-4
Visual C++ class library, 3-3
Array and Numeric Operations
(table), 3-10
Curve Fitting (table), 3-11
Enterprise Analysis, 3-4
Filters (table), 3-6
Linear Algebra (table), 3-8
Measurements (table), 3-5
Professional Analysis, 3-4
Signal Generation (table), 3-5
Signal Processing (table), 3-7
Standard Analysis, 3-4
Statistics (table), 3-12
Windowing (table), 3-6
AutoRefresh control, 2-49
button control, 3-19
© National Instruments Corporation
C
Common
.NET class library, 2-13
Visual C++ class library, 3-15
complex graph control, 2-25, 2-42
conventions used in the manual, x
creating
Measurement Studio Application with
Web Forms Controls and Analysis in
Visual Studio 2005 (walkthrough), 5-11
Measurement Studio Application with
Web Forms Controls and Network
Variable in Visual Studio 2005
(walkthrough), 5-31
Measurement Studio Application with
Windows Forms Controls and Analysis
(walkthrough), 5-2
Measurement Studio Application with
Windows Forms Controls and Network
Variable (walkthrough), 5-22
Measurement Studio Instrument I/O
Application (walkthrough), 5-52
Measurement Studio NI-DAQmx
application, 4-6
Measurement Studio NI-DAQmx
Application (walkthrough), 5-42
new Measurement Studio project, 4-4
NI-DAQmx user code, 4-9
NI-DAQmx user interface, 4-8
I-1
Measurement Studio User Manual
Index
D
instrument drivers (NI resources), A-1
Instrument I/O Assistant, 4-9
DAQ Assistant, 4-6
data acquisition (DAQ), 2-16, 3-17
DataSocket, .NET class library, 2-15
deployment requirements, 1-3
developing with Measurement Studio, 4-1
diagnostic tools (NI resources), A-1
digital waveform graph control, 2-23, 2-40
documentation
conventions used in the manual, x
how to use manual set, ix
NI resources, A-1
drivers (NI resources), A-1
K
knob
.NET control, 2-28
.NET Web Forms control, 2-45
Visual C++ control, 3-21
KnowledgeBase, A-1
L
LED array control, 2-33
LED control, 2-30, 2-48
legend control, 2-27, 2-44
E
examples (NI resources), A-1
M
Measurement & Automation Explorer
(MAX), 4-2
Measurement Studio
developing with, 4-1
home page, 4-3
Menu, 4-1
overview, 1-1
package comparison chart, 1-7
Preferences, 4-4
resources, 1-9
meter control, 2-28, 2-45
Microsoft Excel Interface Visual C++ class
library, 3-16
Microsoft Word Interface Visual C++ class
library, 3-16
G
gauge control, 2-27, 2-44
graph control
3D, 3-2
ActiveX, 3-20
complex, 2-25, 2-42
digital waveform, 2-23, 2-40
scatter, 2-20, 2-38
waveform, 2-20, 2-38
H
help
NI Measurement Studio Help, 1-9
technical support, A-1
how to use manual set, ix
N
National Instruments support and
services, A-1
.NET class libraries
Analysis, 2-2
I
installation
optional, 1-3
requirements, 1-2
Measurement Studio User Manual
I-2
ni.com
Index
Common, 2-13
NI-488.2, 2-16
NI-DAQmx, 2-16
NI-SCOPE, 2-17
NI-VISA, 2-17
overview, 2-1
User Interface, 2-18, 2-37
deployment requirements, 1-3
Network Variable
.NET class library, 2-14
NI DAQ Assistant, 4-6
NI Developer Zone, 4-4
NI Discussion Forums, 4-3
NI Instrument Driver Network, 4-3
NI Spy, 4-2
NI support and services, A-1
NI-488.2
.NET class library, 2-16
Visual C++ class library, 3-17
NI-DAQmx
creating a DAQ application, 4-6
.NET class library, 2-16
Visual C++ class library, 3-17
NI-Reports Visual C++ class library, 3-18
NI-SCOPE
.NET class library, 2-17
NI-VISA
.NET class library, 2-17
Visual C++ class library, 3-18
numeric controls, 2-27, 2-44
numeric edit
.NET control, 2-29, 2-47
Visual C++ control, 3-22
P
O
U
overview
Measurement Studio, 1-1
.NET class libraries, 2-1
Visual C++ class libraries, 3-1
User Interface
.NET class library, 2-18, 2-37
AutoRefresh, 2-49
complex graph, 2-25, 2-42
digital waveform graph, 2-23, 2-40
© National Instruments Corporation
Parameter Assistant, 4-11
programming examples (NI resources), A-1
project conversion wizard, 4-2
project templates, 4-4
property editor control, 2-32
R
requirements
distribution, 1-3
installation, 1-2
S
scatter graph control, 2-20, 2-38
selecting a Measurement Studio parameter
value, 4-11
slide control
.NET, 2-29, 2-46
Visual C++, 3-23
software (NI resources), A-1
support, technical, A-1
switch array control, 2-33
switch control, 2-30, 2-48
T
tank control, 2-29, 2-46
technical support, A-1
thermometer control, 2-29, 2-46
training and certification (NI resources), A-1
troubleshooting (NI resources), A-1
I-3
Measurement Studio User Manual
Index
Microsoft Word Interface, 3-16
NI-488.2, 3-17
NI-DAQmx, 3-17
NI-Reports, 3-18
NI-VISA, 3-18
overview, 3-1
User Interface, 3-19
Utility, 3-24
gauge, 2-27, 2-44
knob, 2-27, 2-44
LED, 2-30, 2-48
legend, 2-27, 2-44
meter, 2-27, 2-44
numeric edit, 2-29, 2-47
property editor, 2-32
scatter graph, 2-20, 2-38
slide, 2-29, 2-46
switch, 2-30, 2-48
tank, 2-29, 2-46
thermometer, 2-29, 2-46
waveform graph, 2-20, 2-38
Visual C++ class library, 3-19
button, 3-19
graph, 3-20
knob, 3-21
numeric edit, 3-22
slide, 3-23
Utility Visual C++ class library
CNiFile (table), 3-24
CNiSound (table), 3-24
CNiSystem (table), 3-24
CNiSystemTrayIcon (table), 3-24
CNiTempFile (table), 3-25
CNiTimer (table), 3-25
W
walkthrough
Creating a Measurement Studio
Application with Webs Forms
Controls and Analysis in Visual
Studio 2005, 5-11
Creating a Measurement Studio
Application with Webs Forms Controls
and Network Variable in Visual
Studio 2005, 5-31
Creating a Measurement Studio
Application with Windows Forms
Controls and Analysis, 5-2
Creating a Measurement Studio
Application with Windows Forms
Controls and Network Variable, 5-22
Creating a Measurement Studio
Instrument I/O Application, 5-52
Creating a Measurement Studio
NI-DAQmx Application, 5-42
waveform graph control, 2-20, 2-38
Web Forms user interface controls, 2-37
Web resources, A-1
Windows Forms array controls, 2-33
LED array control, 2-33
switch array control, 2-33
Windows Forms user interface controls, 2-18
V
Variable Manager, 4-3
Visual C++ class libraries
3D graph, 3-2
Analysis, 3-3
Common, 3-15
deployment requirements, 1-3
Microsoft Excel Interface, 3-16
Measurement Studio User Manual
I-4
ni.com