1
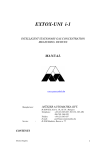
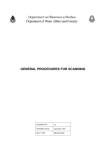
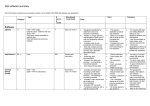
Chapter 8. Aggregator
Figure 8.1: Aggregation of GPS data into hexagonal zones for a density map.
8.3
Aggregating OD Data
Sometimes, one is interested in aggregated movements, e.g. the number of trips from one region into
another one. Create a new layer of type OD Aggregation Analysis to perform such aggregations. The configuration of the aggregation is very similar to the one of the point data aggregation, except that you might
have to specify a second pair of x/y coordinates for the aggregation to work.
When visualizing the results, this layer differentiates between incoming and outgoing data per zone.
In the case of trips, this relates to trips ending or trips starting in a specific zone. When quering a zone
with the corresponding query zone, the incoming/outgoing values always relate to the selected zone. In
the example shown in Fig. 8.2, trips are aggregation, leading from one zone to another zone. Only incoming
relations are visualized, “incoming” relative to the selected zone (the one with the yellow border). The colors
of the visible zones represent the amount of trips that originate in those zones and that are “incoming” at
the selected zone.
30