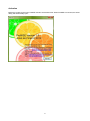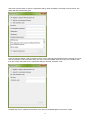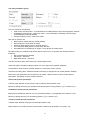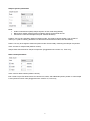
1
ProMISE user manual Probabilistic model for immiscible separations and extractions (ProMISE) developed by Joost de Folter, is freely available for non-commercial purposes (academic e-mail address required for free registration). The model can be downloaded here: http://theliquidphase.org/index.php?title=Modeling System requirements Minimum requirements Operating system: Windows XP / Vista / 7 Recommended CPU: Multi core (e.g. dual core) RAM: 2 GB (or more) Internet connection Installation If the model was downloaded, it is packaged as a compressed zip file. Unzip the entire contents of the zip file into a folder Execute the installation wizard ‘setup.exe’, and follow its instructions This software requires .NET framework version 3.5 which will automatically be downloaded by the installation wizard (this needs to be done only once) 1 Activation Before the model can be used, ProMISE needs to be activated first. When ProMISE is executed, the about dialog will automatically open. 2 Select the Activate button to open the registration dialog. When ProMISE is executed for the first time, this dialog will also automatically open. Enter the required details, read the software terms of use, and select the Register button. Normally an e-mail with the activation code will be sent within 24 hours. Execute ProMISE again, and copy the activation code from this e-mail, and paste it in the registration dialog in the field ‘Activation code’. ProMISE will close to validate the activation code. Execute ProMISE again to access the model. 3 Using ProMISE Model Setup From the main menu, select File -> New to open a new model in the setup view. The window has various tabs, accessible by direct mouse selection. Selecting the Chromatogram or Time mode views will run the model. Model execution can be aborted by returning to the setup or preview tab. Various instances of the model can be started concurrently. The model setup view contains the input parameters for the model which are shown in a number of parameter groups. The input controls contain tool tips which are displayed by hovering the mouse over a particular control. The model window title shows a summary of the main input parameters currently selected. 4 The main parameters group First, the model can be selected: CCD model: discrete model – recommended for modelling discrete type chromatography methods Probabilistic model (‘Prob’): continuous model – recommended for modelling continuous type chromatography methods (default) Transport model (‘Trans’): continuous model Next the run mode is set: Normal phase: Upper phase is mobile (default) Reverse phase: Lower phase is mobile Dual flow: Both phases move in opposite direction Co-current flow: Both phases move in same direction Intermittent flow: Intermittently run Upper / Lower phase as mobile phase EE / BEE mode (only enabled in advanced options mode; use in conjunction with limited number of iterations): None: Normal elution (default) EE: Elution – Extrusion BEE: Back Elution – Extrusion X Scale: Sets the initial X–axis scale for the chromatogram view. Advanced options: Enables modifying options for more expert users (default: disabled). Limit iterations: limits number of model iterations to x times the column volume. Automatic smoothing filter: enables automatic smoothing for appropriate run modes (default: enabled). Most of the input parameters are the same for all models. However there are some model specific parameters, depending on which model is selected. CCD model specific parameters Transfer steps: Number of CCD system cells or (transfer) steps (default: 100). Efficiency: Mixing efficiency (only enabled in advanced options mode) (default: 1): [0 < efficiency ≤ 1] Probabilistic model specific parameters Mixing speed: Rotational speed in CCC (or equivalent) (default: 1). [Suggested units: rotations / min] Efficiency: Mixing efficiency (or equivalent) (default: 1): [0 < efficiency ≤ 1] Transport model specific parameters Transfer steps: Number of transport model steps (default: 100). Mass transfer: the overall volumetric mass transfer coefficient (k0a) (default: 0.01) [units: 1/s] 5 The phase volume ratio parameters Column volume: active volume of the chromatography column. [Suggested units: ml] Upper phase and lower phase ratio can be set (automatically updated), and in the case of a single mobile phase, this is automatically indicated. The corresponding volumes are also displayed. Phase flow parameters The phase flow can be set here, depending on which phase(s) is/are mobile. [Suggested units: ml / min] Sample component parameters Definition K: Sets the definition for the K-values: Upper/Lower means K = CU / CL (default) Lower/Upper means K = CL / CU Sample components can be set by either entering a Label, or a K-value; remaining columns will be filled in automatically. A component can be removed by clearing its Label. The columns are defined as follows: Label: Custom text, displayed in chromatogram at peak position (set by default when entering Kvalue) K: K-value of sample component. Note that setting K-value will only set label once. Subsequently changing K-value will not update label. M: Mass of sample component (can be left 1) Con: Concentration: this is automatically calculated Elute: Sample component has to elute. Can only be changed in advanced options mode (default: enabled) 6 Sample injection parameters Mode: Instant: instantaneous (ideal) sample injection in first model step (default) Batch: More realistic sample injection enabling specific sample feed amount Continuous: continuous sample feed (note: set limit iterations) Position: Can only be changed in advanced options mode. The relative column position; from 0 (start of column) to 1 (end of column). (Default 0.5 for dual flow and intermittent modes, and otherwise 0). Phase: Can only be changed in advanced options mode. Phase initially containing the sample components. Units: set units for sample feed (default: volume). Sample feed: feed amount for sample components. [Suggested units: Volume: ml, Time: min] Dead volume parameters Units: units for dead volumes (default: volume). Inlet / Outlet / Inject: Set dead volume for column inlet, outlet, and additional injection position in case sample is not injected at column inlet. [Suggested units: Volume: ml, Time: min] 7 Intermittent switching parameters These parameters are only enabled in the intermittent run mode. Mode: units for switch amounts (default: time). Can also be set to ‘Component’, where a component can be selected that is allowed to elute (switching before other components elute). Upper / Lower: switch amount for upper phase and lower phase flow. [Suggested units: Volume: ml, Time: min] Start phase: The first phase used in the intermittent switch (default: upper phase). Max iterations: The number of intermittent switches (for both phases) (default: 10). Final elution: Can only be changed in advanced options mode. Enables final elution after intermittent switches have completed (default: enabled). Partial transfer parameters These parameters are only enabled when using the CCD model. This mode enables partial transfers of the cell content, as opposed to a normal transfer where the entire cell content is transferred between cells. Partial transfer mode: Enable partial transfer mode (default: disabled). Upper / Lower: The transfer factor for each respective phase; set to a value less than 1 (default: 1) 8 Preview mode This is an interactive view showing preview results of selected input parameters. Preview results are updated real time as the input parameters are modified. The top of the screen shows springed jog wheel controls, enabling real time adjusting of a selected number of input parameters. The definition of these parameters is identical to that in the setup view described in the previous section. In the centre of the screen a preview chromatogram view is displayed. The X-axis units are as selected in the setup screen. The Y-axis units are component concentration with units used for input parameters. At the bottom of the screen, a table containing numerical results is shown. Table columns: Label: Custom text, displayed in chromatogram at peak position K: K-value of sample component M: Mass of sample component Con: Concentration U/L: Eluted in Upper or Lower phase (a ‘-‘ symbol indicates component not eluted) Ret: Retention / elution time or peak position Sigma: The peak σ value (relates to peak width) Width: Peak width Height: Peak height or maximum concentration Plates: Number of theoretical plates Res: Resolution between previous and current peak in table (only calculated if peaks elute in same phase) 9 Chromatogram view Selecting the Chromatogram tab will run the model. Model execution can be aborted by returning to the setup or preview tab. Model results are graphically displayed, showing the eluted upper phase content in this case. The X-axis units are as selected. The Y-axis units are component concentration with units used for input parameters. For the probabilistic model an additional unit / density graph is displayed at the top of the screen. The chromatogram view is highly customisable, using the menu options (see the Menu section). Peak information can be displayed by selecting Peaks -> Peak Info from the main menu. 10 Peak information The peak information window shows key properties of each component / peak. A table at the top shows key results for each sample component. Mu and Max refer to different methods for obtaining the peak position (or retention time / volume). Table columns: Label: Custom text, displayed in chromatogram at peak position K: K-value of sample component M: Mass of sample component Con: Concentration U/L: Eluted in Upper or Lower phase (a ‘-‘ symbol indicates component not eluted) Mu: Retention / elution time or peak position (mathematical average) Max: Retention / elution time or peak position (position at maximum concentration) Sigma: The peak σ value (relates to peak width) Width: Peak width Height: Peak height or maximum concentration Plates: Number of theoretical plates Pur: Purity of eluted component (cut off at concentration = 0.1%) Rec: Recovery of eluted component (cut off at concentration = 0.1%) mUp: Component mass present in Upper phase mLp: Component mass present in Lower phase mTot: Total component mass Filter: Sigma (σ) value of Gaussian filtering applied to component peak At the centre of the screen, the resolution between two peaks can be calculated by selecting two different components. At the bottom a report is displayed of selected input parameters. 11 Time mode chromatogram view Selecting the Time mode tab will show the time mode chromatogram view. This is an interactive view, allowing appreciating the chromatography process as the components travel through the column and separate. Using the scrollbar at the bottom of the screen, any point in the chromatography process between injection and elution can be viewed. 12 Options dialog The options dialog is accessed from the main menu: Tools -> Options. Various global setting can be set here and are stored. Use caution changing these. Use the Defaults button to restore default values. General Time stores: number of time store point for time mode chromatogram view (default: 100) Export DPI: DPI setting for image export (default: 100) Test show max errors: experimental setting for testing mode (default: disabled) Probabilistic model Probabilistic units: number of probabilistic units used (default: 10000) Density bins: base amount histographical time stores for probabilistic mode (default: 200) Transport model CFL constant: stability condition constant (default: 0.1) Full mass transfer: use full mass transfer even for eluted component (default: disabled) 13 Menu File o o o o o o o o View o o o o New Open Save As Export data Export image Print Preview Print Exit : Open a new model window : Open existing input parameters : Save input parameters : Export data in (text based) .CSV format (for spreadsheet applications) : Export chromatogram image : Open Print preview dialog to print chromatogram and report : Open Print dialog to print chromatogram and report : Exit application closing all model windows Display phase : How sample concentrations in upper / lower phase are displayed Upper/Lower Time : upper / lower phase on same scale Upper/Lower : upper / lower phase separately All : upper / lower phase combined Upper : only upper phase Lower : only lower phase Display peaks Peaks : component peaks separately Peaks & Sum : component peaks + sum of all component peaks Sum : sum of all component peaks Show totals (int) : show accumulated totals (Intermittent mode only) Units (prob) : show probabilistic units (probabilistic model only) X Scale Auto : automatically scale with window size Zoom in : zoom in Zoom out : zoom out Reset zoom : reset zoom back to automatic scale Steps : set units to steps Volume : set units to volume Time : set units to time Norm : normalised to system volume ReS : Reciprocal Symmetry Plots (K-value) scale Sync scales : synchronise phase scales Y Scale Auto : automatic scale according to maximum concentration Normalised : each component peak normalised Absolute : absolute concentration scale with maximum 1 Logarithmic : use logarithmic scale Peaks o Peak info Tools o Options Window o [windows] Help o Check for updates o Feedback o Stats o About : open peak information window : open options dialog : select individual currently opened model windows : check if a newer version of the software exists : provide feedback : show model time statistics : open about dialog 14