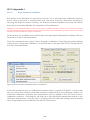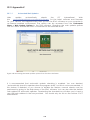
1
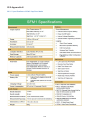
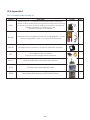
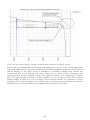
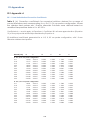
22 Appendices 22.1Appendix A 22.1.1 Heat Ratio Method Correction Coefficients Table 2. (A) Correction coefficients for numerical solutions derived for a range of wound diameters and corresponding to a –0.6, 0, 0.6 cm probe configuration, where the stainless steel probes are 1.3mmin diameter. Solutions were derived based on modelled temperature data at t = 60–100 s. Coefficients b, c and d apply to Equation 6. Coefficient B is a linear approximation (Equation 13) of the polynomial relationship described by Equation 6. (B) Additional coefficients generated for a –0.5, 0, 0.5 cm probe configuration, with 1.3-mm diameter stainless steel probes. Wound (cm) b c d r² B r² 0.0002 0.0002 0.0002 0.0003 0.0003 0.0004 0.0004 0.0005 0.0006 0.0008 0.0010 1.0000 1.0000 1.0000 1.0000 1.0000 1.0000 1.0000 1.0000 1.0000 1.0000 1.0000 1.7023 1.7585 1.8265 1.8905 1.9572 2.0267 2.0991 2.1482 2.2817 2.4467 2.5985 0.9993 0.9992 0.9991 0.9990 0.9989 0.9988 0.9987 0.9987 0.9985 0.9984 0.9983 0.0002 0.0002 0.0002 0.0003 0.0003 0.0004 0.0004 0.0005 0.0006 0.0008 0.0010 1.0000 1.0000 1.0000 1.0000 1.0000 1.0000 1.0000 1.0000 1.0000 1.0000 1.0000 1.7283 1.7853 1.8568 1.9216 1.9891 2.0594 2.1326 2.1825 2.3176 2.4813 2.6383 0.9993 0.9992 0.9991 0.9990 0.9989 0.9988 0.9987 0.9987 0.9985 0.9983 0.9982 A. -0.6, 0, 0.6-cm probe configuration 0.17 0.18 0.19 0.20 0.21 0.22 0.23 0.24 0.26 0.28 0.30 1.6565 1.7077 1.7701 1.8292 1.8909 1.9554 2.0226 2.0685 2.1932 2.3448 2.4908 -0.0014 -0.0014 -0.0017 -0.0019 -0.0022 -0.0025 -0.0029 -0.0031 -0.0038 -0.0047 -0.0057 B. -0.5, 0, 0.5-cm probe configuration 0.17 0.18 0.19 0.20 0.21 0.22 0.23 0.24 0.26 0.28 0.30 1.6821 1.7304 1.7961 1.8558 1.9181 1.9831 2.0509 2.0973 2.2231 2.3760 2.5232 -0.0015 -0.0013 -0.0016 -0.0018 -0.0021 -0.0024 -0.0028 -0.0030 -0.0037 -0.0046 -0.0055 156 22.2Appendix B 22.2.1 Specifications of SFM1 Sap Flow Meter 157 22.3Appendix C 22.3.1 Warranty The standard terms & Conditions of the ICT warranty are that the SFM1 Sap Flow Meter is guaranteed to be free of faulty parts and workmanship for a period of 12 months from the receipt of purchase. The warranty covers back to base repair for faulty parts and labour. The customer is required to pay the cost of shipping to ICT International or an authorised ICT distributor for repair. ICT International will then pay the return shipping costs to the customer upon repair. SFM1 Sap Flow Meters regularly operate continuously for 2+ years in the field without maintenance and repair. However, as mentioned heater filaments (as is the case of incandescent light bulbs) have a finite and unpredictable life-span. In this sense, heaters are considered consumables that may require periodic replacement. On the whole, temperature probes and cables are long lasting if they are well cared for, however no sensor needles (measurement needles or heaters) are immune to the rigours of installation and removal from woody tissue. Accordingly, users are reminded that a degree of attrition is to be expected, and with this in mind, SFM1 Sap Flow Meters are designed so that individual needles can be replaced. The complete SFM1 instrument can be returned to ICT International or a local authorised ICT distributor for repair at a small labour charge plus parts. In specific terms, ICT International does not guarantee the following: • Incorrect use or inability to use any supplied equipment. • Mechanical damage of equipment. • Heater filament failure (burnout) due to prolonged (> 3 seconds) heating or due to end of natural lifespan beyond the 3 month guarantee period. • Corrosion or failure of thermocouples within probes or wires within cables due to repeated mechanical stress/natural wear and tear. • Accuracy of data. • Correct analysis, interpretation or extrapolation of data. • Accidental loss of data. • Any personal injury or damage to plants, field sites, electronic equipment or any other equipment associated with the use of the SFM1 Sap Flow Meters. 158 22.4Appendix D 22.4.1 Equipment Checklist 22.4.1.1 Recommended Instrumentation x x x x x x x x x x x x x x x SFM1 – Sap Flow Meter SFM-SK1 – Installation Kit SFT1 – Sap Flow Tool Software MCC1 – Wireless Radio Modem MCC2G – Remote Data Access Hub for Data to Web Access via GSM SP22 – 22 W Solar Panel SPPM – Solar Panel Post Mount SFM-TB – Test Block Dremel Cordless drill Bark Depth Gauge Diameter Tape graduated in both diameter & circumference Coring Tool Methyl Orange Indicator ------------------------------SFM-IK2 - Heat Ratio Sensor Installation Kit 2 includes: Dremel Drill SFM-IK3 - Heat Ratio Sensor Installation Kit 3 includes: stem corer, bark depth gauge, diameter tape, methyl orange, 22.4.1.2 Ancillary items recommended for sap flow installations: x x x x x x x x x x Leatherman Multi-tool Knife for removing thick bark (if necessary) Tool kit ( includes: Small Flat blade & Phillips head screwdrivers and fine-tipped pliers) Forceps (Tweezers) Wire Strippers Silicon grease to aid probe insertion into sapwood Plastic cable ties for anchoring cables to stems/roots Tree ID Tags Electrical and gaffer tape for a variety of uses Self-Amalgamating Heat Shrink 159 22.5Appendix E 22.5.1 SFM-SK1 Installation Kit Object Overview Small Drill Guide Small Drill guide with only 5 mm spacing option With 4 Mounting pins each 8 mm long Dimensions: 50 mm x 30 mm x 12 mm Image Qty 1 Drill bits Precision 1.3 mm diameter x 75 mm long drill bits Tolerance +/-0.05 mm 10 Micro SD Card Shuttle The SD Card Reader allows the transfer of data from the SFM1 to a PC, for rapid data transfer of large files. 1 160 22.6Appendix F 22.6.1 Example SFM1 Packing List Object Overview SFM1 Sap Flow Meter - Configured for Heat Ratio Method principle Consists of three probes 35 mm long with 2 measurement points at 7.5 and 22.5mm from probe tip; IP68 rated enclosure; standalone logging capability to 2GB MicroSD Card; Windows software; User Manual 1 SFM-SK1 Heat Ratio Sensor Installation Kit includes: Small drill guide, 1.3 mm x 75 mm long Drill bits, pack of 10, Micro SD Card Shuttle 1 SFM-TB Heat Ratio Sensor test block. Functional verification standard. 1 SFT1 An Installation disc containing Copy Protection dongle and User Manual. Image Qty 1 1 MCC1 Wireless USB Radio communication device. SP22 22 Watt solar panel with 4m cable 1 SPPM Solar Panel Post Mount suits SP22 Solar Panels 1 161 22.7Appendix G 22.7.1 Glossary The definitions of these selected terms have been taken from the Penguin Dictionary of Botany 1984.Unless otherwise denoted * Bark – All the tissues, collectively, lying outside the vascular cambium in the stem and roots of plants showing secondary growth, i.e., the primary and secondary phloem the cortex, and the periderm. The term is also used in a more restricted sense to mean the tissue arising to the outside of the phellogen, i.e., the phellem, when this is exposed by sloughing off of the epidermis. The bark of different trees can be very distinctive and its characteristics are used to aid identification. In some species the same phellogen is active each year and a thick layer consisting solely of phellem is formed (e.g. oak, beech), but in most species a new phellogen arises annually in the cortex below: the bark thus consists of both phellem and dead cortex and is termed rhytidome. As the thickness of the bark increases the outer layers may either become fissured (e.g. elm) or be shed as scales (e.g. plane) or rings (e.g. birch). Cambium – A lateral meristem found in vascular plants that exhibit secondary growth. It gives rise to secondary tissues mostly by periclinical divisions of initial. There are two cambia, the vascular cambium and the phellogen (cork cambium) * Corrected sap velocity (Vs) – Only a portion of xylem tissue (the xylem lumen) contains moving sap. Heat pulse probes effectively measure a weighted average of the velocities of moving sap and “stationary” wood (Marshall 1958). Sap velocity can be determined on an areal basis by measuring the fractions of sap and wood in xylem and accounting for their differing densities and specific heat capacities. * Heat pulse velocity (Vh) – The velocity at which a known heat input to a plant stem moves a fixed distance between the heat source and two temperature sensors located downstream and upstream from the heat source. * Hydraulic lift – The transfer of water or acropetal (positive) sap flow from great depth in the root zone for redistribution to the shallow lateral surface root system for the supply of water under drought conditions. This has the added benefit of fertilisation of fertigation by remobilisation of minerals and nutrients to the plant. * Hydraulic redistribution – The movement and transfer of water from regions of high water potential to low water potential such as, but not limited to, the transfer of water by roots from moist regions of the soil to a dry region of the soil profile within the plants root zone. * Nocturnal Sap Flow – The acropetal mass flow of solutes within the conducting xylem of a plant after sunset. This movement of water is driven by atmospheric conditions of low Vapour pressure deficit. The term can be used to describe actual night time transpiration where water is lost to the atmosphere though open stomates or hydraulic refilling of the vessels and tracheids of the xylem which may have become dehydrated during the sunlight hours of the day as the xylem supplied transpiration demand from internal storage. 162 Phloem – (bast) A vascular tissue whose principal function is to translocation of sugars and other nutrients. The phloem is composed mainly of sieve tubes, sclerenchyma cells, and parenchyma cells including; companion cells. It occurs in association with and usually external to the xylem. * Reverse flow – The movement of water or basipetal (negative) sap flow within the tree from the leaves to the roots. Sap – The liquid, consisting of mineral salts and sugar dissolved in water that is found in xylem and phloem vessels. * Sap flow – The volumetric measurement of acropetal (positive) mass solute flow within a plant stem. It is derived by multiplying the corrected sap velocity (Vs) by the cross sectional area of the conducting xylem or sapwood of the plant. Sapwood – (alburnum) The outer functional part of the secondary xylem cylinder as compared to the central non-functional heartwood. Transpiration – The loss of water by evaporation from a plant surface. Over 90% escapes through open stomata, while about 5% is lost directly from the epidermal cells. It has been shown that although the combined area of stomatal pores is on average only 1-2% of the total leaf area, the amount of transpiration they allow is 90% of the transpiration that occurs from a water surface the same area as the leaf. Transpiration rates are greatest when leaf cells are fully turgid and when the external relative humidity is low. Water forms a film around the mesophyll cells and evaporates into the sub-stomatal chamber from where it diffuses into the air. The degree of opening of the stomata (stomatal resistance) is of prime importance in governing the rate of water loss. The width of the boundary layer at the leaf surface is also important. In dry conditions, transpiration can cause wilting and so the plant may develop features such as waxy cuticles to minimise the problem. Xylem – (wood) Vascular tissue whose principal function is the upward translocation of water and solutes. It is composed mainly of vessels, tracheids, fibre-tracheids, libriform fibres, and parenchyma cells. It should be noted, however, that all these cell types may not be present in any one wood sample. Wood anatomy is often very important taxonomically, the presence or absence of the various cell types and their distribution within the xylem being important diagnostic characters. The xylem occurs in association with, and usually internal to, the phloem. 22.7.2 Acronyms CHPM - Compensation Heat Pulse Method CSIRO - Commonwealth Scientific and Industrial Research Organisation DBHOB – Diameter at Breast Height Over Bark HPV - Heat Pulse Velocity HRM - Heat Ratio Method ICRAF - The International Centre for Research in Agroforestry UWA - The University of Western Australia 163 22.8Appendix H 22.8.1 Algebraic Terms Vh = Heat pulse velocity Vc = Corrected heat pulse velocity Vs = Corrected sap velocity t0 = Time to thermal equilibrium of the downstream and upstream probes after release of the heat pulse t = Measurement time x1 = Denotes distance between heater and the downstream temperature needle x2 = Denotes distance between heater and the upstream temperature needle x = The distance (cm) between the heater and either temperature needle v1 = The increase in temperature (from initial temperature) at equidistance downstream, x cm from the heater v2 = The increase in temperature (from initial temperature) at equidistance upstream, x cm from the heater a, b, c & d = Correction co-efficient’s for the effect of wounding k = Thermal diffusivity K = Thermal conductivity Kgw = Thermal conductivity of green (fresh) wood Ks = Thermal conductivity of water (5.984 x 10⁻¹ J m-1 s-1 oC-1 @ 20 oC) pb = Basic density of wood p = Density of green (fresh) wood (kg m-3) ps = Density of water = density of sap = 1 Fv = Void fraction of wood c = Specific heat capacity of green (fresh) wood cw = Specific heat capacity of the wood matrix (1200 J kg-1 oC-1 @ 20 oC) cs = Specific heat capacity of the sap = Specific heat capacity of the water (4182 J kg-1 oC-1 @ 20 oC) mc = Water content of sapwood wf = Fresh weight of the sapwood sample (kg) wd = Oven-dried weight of the sapwood sample (kg) Ǒ= Pi (3.142) C = Circumference of a circle d = Diameter of a circle 164 22.9Appendix I General structural anatomy of a tree Figure 125. Generalised structure of a tree stem showing orientation of major tissues: outer bark, inner bark (i.e. phloem), cambium, sapwood (i.e. xylem) and heartwood (Kramer & Kozlowski, 1979). 165 22.10 Appendix J 22.10.1 Show Thermistor Calibration This feature is not intended for use by the end user. It is a manufacturers calibration function that is used at the time of manufacture and may some times be used when repairing or servicing the Sap Flow Meter. However, the feature is made available to the end user should they wish to manually calibrate the thermistors of the instrument. WARNING 21 this calibration function must only be used if a suitable calibration reference and isothermal calibration chamber is available. Failure to meet this criteria will result in an erroneous calibration being stored in the instrument that will cause the Sap Flow Meter to measure inaccurately. For this reason it is a hidden menu option that must manually be Displayed or Hidden. This can be done from the Commands Menu. From the commands menu select “Show Thermistor Calibration” Selecting this option displays a new section “Thermistor Calibration” on the SFM tab on the right side of the GUI (this area of the GUI is normally blank). Figure 126 Show Thermistor Calibration function in the SFM tab In the test example shown, no calibration is present and so it reports CAL EMPTY. If sensors are all at a known and carefully controlled reference temperature in an isothermal media in an isothermal calibration chamber, this temperature can be added in the Cal Temp field for calibration purposes. Choosing Set will reset all of the individual temperature sensors to the reference temperature. From this point, choosing clear will undo the setting, whilst choosing save will generate a new calibration for the SFM1 instrument. 166 22.10.2 Hide Thermistor Calibration The command menu item will now toggle to read “Hide Thermistor Calibration”. Selecting this menu option will stop displaying the calibration and remove it from showing on the SFM Tab. Figure 127 Hide Thermistor Calibration function in the SFM tab 167 22.11Appendix K 22.11.1 Automated Web Updates Web update automatically checks the ICT International Web site www.ictinternational.com/support/software/ for the latest software and firmware for your device. This happens each time you run the SFM1 software on your computer in an internet enabled environment. The option can be accessed from the Commands Menu > Web Update Options in the SFM software. Changing the web update options can be done whether the SFM1 is connected to the software or not. Figure 128 Accessing the Web Update options from the SFM1 Software It is recommended that automatic update checking is enabled. You can deselect “automatically check for updates when the program starts”, but this is not recommended. If this feature is disabled, or you choose to disable the feature, manual checks must be performed by going to the Help Menu of the SFM1 software. You can also alter the default web address for automatic updates. Deselecting the checked box will allow you to input a new URL/web address in the box provided. You should only do this on the advice of ICT International. 168 Figure 129 The Default Web Update Options settings 22.11.2 Manual Web Updates Web Updates can be manually checked whether the SFM1 is connected to the software or not. Figure 130 Manual check for Web updates when the SFM1 is not connected to the software 169 If the SFM1 is not connected to the software it will only be possible for the software version to be checked for possible updates, as the software has no physical way of checking the firmware version of the instrument when it is not physically connected. Figure 131 SFM Software feedback when performing a web update when the SFM1 is not connected to the software When the SFM1 is connected a check for both software and firmware is automatically performed upon opening the software and connecting to the instrument. If there are no updates to perform a simple user feedback message is displayed on screen to advise the user that no updates are available for both software and firmware. If an update is available the user is prompted to accept or decline the update. Figure 132 SFM Software feedback upon performing a web update when the SFM1 is connected to the software 170 22.12Appendix L 22.12.1 Extension Cable Specs As the SFM1 is powered from its internal battery with a non-polarised charging circuit no special power cables are required. A simple 2-core “Figure-8 cable” or “Lamp Cord” of following specifications is ideal: Size: 2 x 24/0.20 Voltage Rating: 300V AC Current Rating: 7.5 Amps Dimensions: 2.6 x 5.1mm Conductor Area: 0.75mm2 Conductor Gauge: 18AWG Temperature Rating: 90°C Roll Size: 30m 22.13Appendix M 22.13.1 SD Card Re-Initialisation 22.13.1.1 Procedure check: x x Initialise SD Card Check SD Card Communication / Initialisation o If ok, check whether the file system is of correct format If ok, check serial number to see if a valid CSV file can be created x If ok, set SD Card status to SD OK x If fail, set SD Card status to FILENAME ERROR If fail, set SD Card status to WRONG FORMAT o If fail, set SD Card status to SD ERROR 171 22.14Appendix N 22.14.1 SFM1 Test Block The HRM Sap Flow Meter Test Block is a functional verification standard for use with the HRM Sap Flow Meter. It is designed using a thermal compound of known thermodynamic properties and encased in a housing of known dimensions. The needle spacing’s are asymmetrically arranged (which is a divergence from the Heat Ratio principle) to induce an artificial Heat Pulse Velocity. Each block is designed to induce an artificial velocity of approximately 18 cm hr-1 or a mid-range value of expected sap velocities as measured by the HRM in many species. Depending upon the temperature conditions under which the block is used the heat dissipation from the block will be higher or lower which will ultimately impact the measured heat ratio causing a small divergence from the expected 18 cm hr-1 value. The Test Block is not intended to be used as a calibration device rather as a known standard for operational verification of the Sap Flow Meter. This can be done in the lab as a pre deployment check before taking the equipment to the field and installation. This will ensure correct functioning of the two measurement needles and the heater providing confidence in the operation of the equipment and subsequent results obtained, which will aid in data interpretation. (a) (b) Photo 54: (a) SFM1 Sap Flow Meter needles inserted into the Test Block, (b) SFM1 Test Block with label Error Codes: If the Sap Flow Meter or the needles have a problem one of the following error codes will typically be generated: - 19.19 – No heater current was detected, therefore no heat pulse could be fired. - 20.20 – Sap Velocity (Vs) was not calculated because the temperature rise of one of the thermistors was below the cut-off threshold. - 21.21 - Sap velocity (Vs) could not be calculated because the temperature rise of one of the thermistors was negative. - 22.22 Calculated Sap velocity (Vs) is less than the maximum practical physiological limit of reverse sap flow. Values that are significantly different from the expected verification range of 18 cm hr-1 and are not flagged with an error code will indicate that an error exists and you should consult your Sap Flow Meter manual and commence diagnostics check and trouble shooting. If no obvious answer can be determined for the disparity please contact ICT international or your local distributor. Photo 55: SFM1 and Test Block 172 22.15Appendix O 22.15.1 SFM1 External Battery Operation Test (without Solar Panel) Aim To test and determine the longevity of field deployment of the SFM1 Sap Flow Meter using a small 12 V DC, 7 Ah Lead Acid rechargeable battery, as the sole source of external power supply to maintain the SFM1 internal 4 V, 1 Amp Lithium Polymer battery. NOTE 92 When the SFM1 is connected to an external supply the instrument is powered directly from this power source bypassing the internal battery, except for the heat pulse. The measurement Heat Pulse is always supplied directly from the internal battery this is to ensure continuity of supply from a regulated stable power source for the very high, instantaneous current required by the heat pulse. The internal 4 V lithium battery of the SFM1 is trickle charged at a very low rate by the external power supply to maintain its full charge (Figure 133). Figure 133 Low rate of trickle charging internal battery As the internal battery has the capacity to sustain the SFM1 for up to 23 hours (Figure 4. note the period between 4:10PM 1/11/12 to 3:15PM 2/11/12 where external charging ceases) there is the ability to either remove a discharged external battery and swap it with a fully charged battery, or remove the discharged battery leaving the instrument to operate independently from the internal battery whilst the external battery is recharged and replaced. Methods The SFM1 measurement mode was set to a temporal logging interval of 10 minutes, with a Pulse Energy setting of 20 Joules for each heat pulse. The data reporting option was set to Needle Temperature Mode with a sampling frequency of three (3) samples per second and 900 measurements after the heat pulse for each measurement. This results in a total measurement time of 5 minutes and 32 seconds for each measurement of sap flow. The actual Logging Options used in the trial are displayed directly (Figure 134) from the SFM1 configuration window. Figure 134 SFM1 Logging Options used in battery test NOTE 93 In every 10 minute period the SFM1 instrument is only idle for 4 minutes and 28 seconds. This was chosen deliberately to increase the power burden on the 7 Ah battery whilst using the minimum recommended configuration for the SFM1, being a 10 minute sampling interval at 20 Joule heat pulses. 173 To ensure a thorough test a new 7.0 Ah Lead Acid rechargeable battery was purchased and placed on charge for the recommended 12 hour period prior to use. This was done to ensure the battery was at full capacity prior to commencing the test. The battery was removed from charge and independently measured with a voltmeter to verify the starting voltage. The starting voltage immediately measured after removal from charge was 13.67 V. This voltage steadily decreased until it stabilised at approx. 13 V as measured with the voltmeter prior to connection to the SFM1. This value of approx. 13 V was confirmed by the SFM1 immediately upon connection to the instruments internal power circuit. The voltage of the external 7 Ah battery was measured continuously using the internal voltmeter function of the SFM1 Sap Flow Meter. The data was analysed using the SFT Sap Flow Tool software. The results of the test are displayed below. Photo 56: Century PS Series Model 1270 Sealed Lead Acid Battery (12V 7 Ah) used in Trial Results The Blue line (as referenced in the legend displayed on the 1st Y-Axis on the left hand side of the graph Figure 135) is the continuously measured external battery voltage of the 12 V 7 Ah Lead Acid rechargeable battery. Note prior to commencing the external battery test the SFM1 was connected to a 12 V DC mains powered plug pack supplying a relatively constant 13.8 V supply. The external mains power supply was disconnected at (10:50AM 24/10/12) shown by a sudden drop in voltage to zero. The external Lead Acid battery is connected and the first measurement taken at 11:20AM 24/11/12). Note the lower supply voltage delivered by the 12 V 7 AH battery (approx. 13 V) compared to the mains powered 12 V DC Plug pack supplying 13.8V. The external battery voltage displays a general negative trend as power is supplied to the SFM1. A slight diurnal temperature effect (ambient temperature not specifically monitored although a 25°C diurnal temperature range is common at the site the test was conducted) indicated by minimum battery voltage measured at approx. 5:30AM each morning and a maximum voltage measured at approx. 11:30AM – 12:00PM each day. This correlates (anecdotally) with the maximum and minimum temperatures measured. This fluctuation is most probably due to the ambient heating of the battery resulting in a higher voltage yield or output from the battery as the internal cells are heated. Over the first 5 ½ days (between 11:20AM 24/11/12 to 4:00PM 29/11/12) the voltage dropped by 1 Volt, from 13 V (fully Charged) to 12 V. The subsequent two days (between 4:00PM 29/11/12 to 4:00PM 31/11/12) the battery dropped by a subsequent 0.5 V to 11.5 V. The battery then drops a subsequent 0.5V in only 16 hours. At this point the battery begins a terminal decrease to zero Volts over an 11 hour period (between 9:00AM 1/11/12 to 8:00PM 1/11/12) which coincides with a rapid decline in the SFM1 internal battery as it can no longer recharge from the external supply. 174 Figure 135 SFM1 Internal battery voltage overlaid against external 7 Ah battery voltage The red line (as referenced in the legend and displayed on the 2nd Y-Axis on the right hand side of the graph Figure 135) is the continuously measured battery voltage of the 4 V internal Lithium battery of the SFM1. Note it maintains a constant voltage from before the commencement of the battery test when connected to mains power, throughout the external power supply disruption when the external battery was connected (11:20AM 24/11/12) right through in excess of 8 days (4:00PM 1/11/12). At this point the SFM1 internal battery begins to drop as it can no longer source sufficient power for operation or trickle charging of the internal battery. All functions are now being performed from the internal battery which is no longer able to be charged by the external 7 Ah battery. 175 Conclusions Based on the results of this test it would appear the SFM1 can be used for independent operation in the field for up to a period of 9 days 4 hours and 10 minutes using a single (fully charged) 12 V DC 7 Ah Lead Acid Rechargeable battery. At which point the instruments internal battery reaches the minimum voltage threshold and measurements are suspended. As this test takes the external battery to failure (fully discharged) it is advised to reduce the expected longevity for field deployment to 7 days to allow a safety margin to prevent the external battery from being fully discharged and possible interruption of measurements through automated suspension of datalogging. Further testing will be conducted to evaluate the effect of constant deep discharge on the performance of the Lead Acid batteries as it is noted they are not specifically designed for such heavy workloads. Deep Cycle Marine batteries are however, designed to withstand such heavy workloads and occasional, to regular deep discharge without immediate impact on the serviceable life of the battery. Where possible ICT recommends using large capacity 100 Ah rated (or greater) Deep Cycle Marine grade batteries for charging the SFM1 Sap Flow Meter in field applications, either with solar charging and especially when solar charging is not available. 176 22.16Appendix P 22.16.1 Signal Strength Test Procedure Begin by changing the MCC1 Mode. Press and hold down the Mode button on the MCC1. Connect the USB cable to power the MCC1. Continue to hold down the Mode button until both Red LED’s light up then release the Mode button. The LED’s will flash alternately. The MCC1 is no in configuration mode. Run the MCC Device Configuration software. Scan Ports then select the MCC from the Available Ports drop down menu Click Change Ports to connect to the MCC1 Figure 136 Selecting the Com Port in the MCC Device Configuration software Figure 137 Select Signal Strength Test from the Mode of Operation dropdown menu 177 Figure 138 Confirm open search or specific search by choosing Any Device or Paired Device. An open search for any device is good when doing verification testing of signal strength for all instruments deployed in a field experiment. Figure 139 Enter the Instrument address into the Paired Device field and click verify address to lock it to a single instrument. This is ideal for conducting a signal strength survey prior to deployment. Figure 140 Click Apply Settings the changes are saved to Non-Volatile RAM. Then click Exit Configuration Mode and the screen is greyed out and the Red LED’s on the MCC1 cease flashing. The MCC1 has now been configured for Signal Strength testing. 178 22.16.2 Configure HyperTerminal for RSSI Test Utility Interface Setup board rate and Click ESC to bring up the operation menu. Figure 141 HyperTerminal MCC RSSI Test Utility Properties dialogue boxes 22.16.3 RSSI Test Utility Tx: number of transmitted packets Rx: number of received packets. For each transmitted packet, a packet should be received back. rRSSI: remote signal strength on the instrument lRRSI: local signal strength on the MCC Double click the MCC RSSI Test Utility icon to launch the HyperTerminal display. Press ESC to initiate communications and display the Test utility Menu. Figure 142 MCC RSSI Test Utility Menu 179 22.16.4 Option 1 Select Device The MCC can be paired with a specific instrument at the time of configuration using the MCC Configuration software. Alternatively, the MCC can be configured to work with a specific instrument by pressing 1 on the key board to allow the serial number to be entered manually in Hex Format. Once entered pressed ENTER on the keyboard to save the serial number. Figure 143 Manually setting the serial number of an instrument to RAM in the MCC1 22.16.5 Locating the instrument Serial Number This serial number of the instrument can be found when connecting to the instrument wither via USB or MCC RF Modem or by toggling between overall serial number SMM1C70Q and the Instrument Serial number within the Instrument Information section of the SFM software. Figure 144 after selecting a test either Continuous or Burst Test the MCC establishes the connection to the instrument with the message “Please wait._” then the signal strength variables are displayed on screen. 180 Figure 145 RSSI values < 20 show extremely strong signal strength Figure 146 RSSI values of >80 show very poor signal strength 181 22.17Appendix Q 22.17.1 Methyl Orange MSDS 182 183 184