1
Date:
April 24, 1987
To:
Richard J. Coffey
Director of management Systems
Carrie Fosselman, Acting Director
Child and Adolescent Psychiatric Hospital School Program
From:
David Schmitz
Jim Smith
Industrial Engineering Department
Subject:
Final Report on the Management Information System
INTRODUCTION
At the beginning of the Winter term of 1987, the Psychiatric Hospital
School Program requested assistance on the design and implementation of
a Management Information System. In response to the request, Jim Smith
and David Schmitz were assigned the project of designing and
implementing the database necessary for the Management Information
System. This final report focuses on the design and description of this
MIS as well as the benefits associated with the implementation of such a
system.
JMARY
After discarding the previously used software, Excel, we purchased a new,
more efficient database software package, Reflex. Reflex has two major
advantages: memory space and user-friendliness. The result is a more
efficient database that will be easy for data entry and report generation.
However, Reflex is not capable of the graphics design necessary for
charting the students’ devereux behavioral factors. This has been
corrted with the use of the MacDraw package. With this software,
cha. have been created so that the students’ behavioral scores may be
properly anayzed.
To simplify use of this database, we designed a user manual that not only
explains data entry for the benefit of the secretaries, but will also include
specifics about the database that will benefit the Acting Director.
The database will consist of four seperate files. There will be one for
demographic information, one for the devereux scores, one for the DSM Ill
scores, and one for the Woodcock-Johnson scores.
Upon implementation of this Management Information System, the
potential impact we expect to see is a decrease in the length of
stay for the student patients as well as certain economical advantages.
DISCUSSION OF SOFTWARE
Advantages of Reflex over Excel
This software package is user-friendly, allowing for easy use by your
evaluators, teachers and secretaries. Your staff can do complex queries
and update information without a working knowledge of computers. Reflex
is also equipped with an assistance (“help”) disk that can answer questions
about the database. Thus, your staff will have no problems generating
reports about the needs of your student population.
Graphics Software for Devereux Scores
Though Reflex is quite an efficient database package, it is not graphics
based. Since the students’ devereux behavioral scores are required to be
charted, we resorted to other software packages. The MacDraw package
allows for easy design.
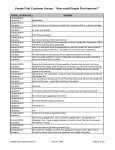
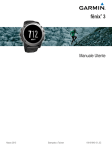
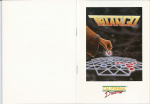
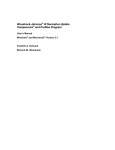
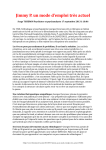
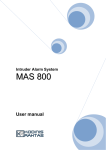
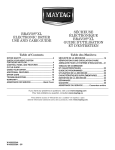
We have designed two templates (one for adolescents and one for
elementary students) that contains the range and means of scores for the
emotionally impaired, the range and mean of scores for normal groups, and
allows the student or group of students to be charted with respect to
these means and ranges. The template also provides space for the number
of students sampled, the number of students that need suicide precautions,
the number of students that need 1 :1 supervision, and the number of
students that have modified school schedules. The two charts are
essentially the same but different behavioral factors are analyzed on each
one. The adolescent behavioral profile measures defiant/resistive
factors, poor emotional control, inability to delay, hyperactivity, bizarre
action, schizoid withdrawal, and self-blame. The elementary deviance
C
profile measures negative/agressive factors, inattention, irrelevant
thinking, failure/anxiety, need for direction in work, social withdrawal,
confusion, achievement compared to peers, and impatience. Both these
graphs will be saved on the same 5 1/4 inch disk seperate from the disks
with the data collection of the adolescent and elementary students.
Reports
To analyze the above data we have designed a report that will calculate
the mean, standard deviation, and range of the behavioral factors in a
desired sample. For example, if a query on DRU patients with 1:1 required
supervision is desired, the evaluator need only perform a query, then use
our prefabricated report to process the information. As mentioned above,
these behavioral factors will be compared to emotionally impaired and
normal populations. With a sufficient data collection, the psychiatric
school will be able to see trends and correlations and will be able to hire
their staff according to the individual or groups’ needs that are most
commonS This will not only reduce staffing in unneeded areas, but it will
also bring attention to the curriculum materials that are most needed.
Reflex User Manual
We have completed a user manual that will facilitate the use of this
Reflex software package. The manual will be in two parts as described
below:
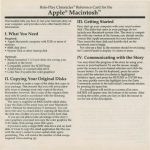
(1) The first part will contain step by step information for the
secretaries on data entry. It will start at the point of turning on the Apple
Macintosh and will then continue to explain how to access the database
files. It will finish by explaining how to enter data pertaining to a
particular patient.
(2) The second part of the user manual will contain specific
information regarding the five aspects of the database. It will explain to
the user how to go from database overview to form layout, which allows
one to physically design the form for data entry. It will then explain how
to enter data. It will also explain how to reach the report design screen so
that the user can physically design the report to his/her desires. This is
where information on generating means, standard deviations, and ranges
from the data collection will be given to the user. Lastly, it will show
how to actually display the reports so that the necessary information can
be utilized. Also included will be an appendix that gives all the shortcuts
to the menu applications.
This manual used in conjuction with the help disk will hopefully make
usage of this database a simple task.
DISCUSSION OF DATABAS
The data collection has been divided into two seperate databases one for
the elementary students and one for the adolescent students. To provide
ample disk space for the data collection, the two databases have been
saved on seperate 5 1/4 inch disks. These databases will contain the
same records with the exception of the devereux scores since the
adolescent and elementary devereux tests measure different behavioral
factors.
-
Each database contains four files as described below:
1) The “patient” file contains demographic information and information
such as suicide precautions, modified school schedule, and 1:1 supervision
provided by the public schools prior to admission in the psychiatric school.
2) The “devereux” file is a behavioral profile that contains all the
devereux scores rather than just the specific behavioral factors that are
charted as mentioned above. This file contains six records that vary
according to admission. The devereux test is given at preadmission,
admission, discharge, post-discharge, transfer admission, and transfer
discharge. Scores are collected for each of these time periods.
3) The “DSM Ill” file contains DSM Ill scores. This file subdivides the
scores into the three DSM III axes. Each axis is based on up to five
psychological factors. Thus we have allowed five fields of information
storage.
4) The “other tests” file contains WISC-R l.Q. scores, WoodcockJohnson psychoeducational ttery scores, and an achievement-aptitude
profile.
It should be noted that this database is designed to resemble the devereux,
DSM Ill, and Woodcock-Johnson/WISC-R forms used by the public schools.
This will allow for easy data entry without confusing the evaluator or
secretary.
C
The databases are structured so that the “DSM III” and “other tests” files
are a one to one link with the “patient” file. However, since the “devereux”
file contains up to six records, it has a “time of test” key field that
enables it to have a one to many link with the “patient” file.
DISCUSS1OLN OF BENEFITS
The benefits of this Management Information System are:
(1) Profiles of patients who improve significantly on pre-test,
post-test assessments can be analyzed for key factors in their treatment,
and this information can be used to improve service delivery to patients
who have a similar profile. A proper analysis will allow the School
Program to recognize students with certain profiles and to begin proper
treatment without wasting time. This has the potential impact of
decreasing length of stay. Also, staff inservices can be targeted toward
commonly found treatment needs of patients, resulting in increased
effectiveness in service delivery. This has the potential impact of
decreasing length of stay.
(2) Curriculum materials can be ordered using averages from the
achievement test data as a trend indicator. This will result in a
considerable commodity savings.
CONCLUSION
Our assistance with the design and implementation of the Management
Information System will greatly improve the effectiveness of the Hospital
School Treatment Program. With the use of Reflex, the Hospital School
staff will have no problems entering data and generating reports by its
implementation date on the first of May.
Sincerely,
David Schmitz
Jim Smith
Industrial Engineers
__________
________
BEHAVIORAL DEVIANCE PROFILE
KEY TO PROFiLE INTERPRETATION
PATIENT/GROUP SAMPLED
NUMBER IN GROUP
DATE OF SAMPLING
BEHAV1OR FACTOR
±1SD: RangeandMeanforE.L
I I I RangeandMeanforNormal
L..LJ Rangeand Mean forSamplo
SCORE
POOR EMOTIONAL CONTROL
STANDARD SCORE UNITS
0
1
2
-1
III
DEFIANT RESISTIVE
ADOLESCENT
-
L
46
lit I
6
L
8
1
4f
t
li
18
2
I I i I i I i
20 22 24
!;;.;.
II III
69
INABILITY TO DELAY
I
1111!
6
9
HYPERACTIVITY EXPANSIVE
11111111
34) 33 31
1p4)34
24
7
BIZARRE SPEECH AND COGNITION
BIZARRE ACTION
39 42
2i
30
33
13
4
11111
15 20 25 30 35
14
6
18
20
22
24
....__
__
II
I r$1<*i1<I$tt4s*
4
ff14
SCHIZOID Wfll-IDRAWAL
i I i I i
16 18 20
/
It
6
ANXIOUS SELF-BLAME
ADDITIONAL FACTORS
Suicide Precautions
leed for Modified School Schedule
Need for 1:1 Supervision
14
16
1820 222426 2830
Iaa {SL
NUMBER IN SAMPLE WITH ThESE NEEDS
BEHAVIORAL DEVIANCE PROFILE
ELEMENTARY
KEY TO PROFILE INTERPRETATION.
PATIENT/GROUP SAMPLED
± 1 SD: Range and mean for E.I.
L.i..J Range and mean for Normal
‘
i i:Range and mean for Sample
MBER IN GROUP
DATE OF SAMPLING
BEHAVIOR FACTOR
-
L.
SCORE
. -
STANDARD SCORE UNITS
-1
1
-2
2
3
.1
ii
12
10
iii
6 18
14
N EGATIVE/AGRESSIVE
I
I lit
i
4
2 2224
INATTENTION
-
-
I I I
6 18 0
I
IRRELEVANT THINKINGITALK
II
4
Iii
I
20 22
FAILURE ANXIETY
-
iii
8 20
NEED FOR DIRECT)ON IN WORK
I
!
4’
SOCIALLY WiTHDRAWN
4
III
18
CONFUSION
2
COMPARED TO PEERS
III
4
6.
22
IMPATIENCE
ADDITIONAL FACTORS
cide precautions
Need for modified school schedule
Need for 1:1 supervision
(
I
18 20 22 24
MJIyfBER IN SAMPLE WITH THESE NEEDS
n
DATA ENTRY MANUAL
STUDENT INFORMATION SYSTEM
CHILD AND ADOLESCENT PSYCHIATRIC SCHOOL PROGRAM
THE UNIVERSITY OF MICHIGAN HOSPITAL
DESIGNED AND WRITTEN BY:
JAMES SMITH
DAVID SCHMITZ
APRIL 22, 1987
INTRODUCTION
This manual is designed to be used by those operating the new student information
system at the Child and Adolescent Psychiatric Hospital Program at the University of
Michigan. Although this manual will provide instruction on how to operate REFLEX as
applied to the school system, for a more in depth look at the software one must consu[t
the REFLEX manual. This users manual will give evaluators and data entry persons a
working knowledge of some of the aspects of REFLEX, but it will not cover more then
entering data and designing some simple reports.
GETTING STARTED
There are a number of things you will need before you start working on the student
information system. What you will need is as follows:
1) A Macintosh computer with at least 512K of internal memory.
2) A disc which contains the Macintosh operating system as well as the
REFLEX operating system.
3) One of the two data discs. Either the elementary data or adolescent
data, which ever database is desired.
4) A second disc drive or enough memory internally so that REFLEX can
be stored there.
5) A printer, if output is desired.
BEGIN
The first thing you need to do to access the system is to turn on the computer, which
is located on the back left of the machine. When this is completed put the disc
containing the Macintosh operating system and REFLEX software in the disc drive in
the front of the computers. Next, insert the data disc that is desired into the cond disc
drive. What occurs now is that every time you access the REFLEX datafile
the data
disc the computer will be able to find the application program on the disc in the internal
drive, If you tried to open a data file with only the data disc and did not have the
REFLEX system in the other drive you would not be able to access it.
Now that you have both disc in, both icons should appear at the right side of the
screen Click twice on the data disc to open it and display its contents On the disc you
will find two types of icons. One will look like a sheet of paper with three boxes on it,
those are report icons and contain specific report set ups. These reports will be
considered later. The second icon looks like a brief case and should have a name
below it. This is called a folder and might contain the word Folder” in the name.
We are first going to consider how to enter data into the database To do this, when
the data disc is open, go to the folder record and click twice on that icon to open it.
When you have done this another window will appear with four similar icons in it.
These icons will look like three filing cabinets connected by lines and they are the four
database files for the information system. Now, although the names are not the same
as headings on the old data collection forms they hopefully are similar. The four files
you see match with sections on the data collection forms as follows:
Disc Name
Data Form Name
Patient
Demographic
Devereux/Dev
Behavioral Data
OtherTests
Achievement and Cognitive Data
DSM_111/DSM_lll
Discharge Data
(Where two names appear under the Disc Name column, indicates that these files
have different names on the adolescent and elementary data discs. The first name is
how it appears on the elementary data disc and the second is the adolescent disc.)
This way if you are entering a certain section of the form just open that specific file. For
example, a student just comes in and you are going to enter his demographic
information, just go to the Patient icon and click on it twice.
When you decide which icon you need to open click on it twice. This will open up
the database file and you will be ready to input data. All the procedures so far are the
same to get into all four database files. From here however, they will differ so we will
cover them individually.
DATA ENTRY
rnogrphic
To get into this file you have already clicked on the Patient file icon. When this file
opens up you will see a screen that looks similar to the top half portion of the old data
collection form. The box underneath the last name will be black and it will have a
name in white if there are already persons in the database. If you wish to enter another
new record go up to DATABASE label at the top of the screen and while holding down
the button on the mouse, drag the pointer until NEW RECORD is darkened in and then
let the mouse go. You can also take the short cut by holding down the <control> key
and typing an E(For these shortcut commands see the Appendix). You will now have a
screen which contains the form again with the box under last name black but there will
be no information in the boxes. You are now ready to enter a new record.
Start entering the data by just typing the appropriate fields and then pressing
RETURN(The first letter you type under Last Name will cause a processing delay by
the computer, so you will have to wait a few seconds before you can type the second
letter: Don’t worry this delay will only occur once.). By pressing RETURN, REFLEX will
darken in the next box and expect you to enter the data for that field. You will notice
when you enter the first character in the new record an X will appear in the upper left
hand corner which means that the data is new and is not yet saved or present in the
database. The data you will enter will be very similar to the data you have entered on
the old collection forms. There are however some differences that you might wn into.
First of all, each darken box has been defined as some sort of field, either an integer
field, text field, date field or real number field. Although the type of field maybe
inconsequential to you, it might effect data entry. For example, date of birth has been
defined as a date field, that means anything not entered in the form of XX/XX/XX will
not be accepted. If you enter the data in the form as it appears on the old collection
forms or as the directions state, you should have no problem. But be advised when
you get an error message that the in put is not in the right form, it could be due to the
fact that it does not match the form that was pre-defined. To correct this problem is very
easy, so consult the manual. In addition, in the Appendix you will find the form in which
the fields should be entered.
Another difference in the new collection form are the addition of seven new fields,
or blanks to fill in. Six of the boxes are labeled with the names of the six Devereux
tests. These boxes will be important in the production of the template report and it will
also serve as a quick reminder as to what Devereux tests the students have taken
without having to access the Devereux database file. These six boxes should only be
filled in when Devereux scores have been entered.
C
The last box which is named PURGE will be used to delete records from the
database but still keep that students information on hand. If you put a V in this box, that
means when a report is designed to look at only those students currently in the
database it will look to those who do not have a V in this box. For example, Joey has
been out of the program for three years and you no longer want to consider his
information. Put a Y in Joey’s PURGE box and his information will no longer be
accessed in reports, but you will still have his information in the database. Sounds
confusing but it really isn’t.
The major difference in the computer screen form is the presence of a new section
which is labelled by DSM, WISCWJ and theDever. What these blocks are, are linked
records and they are very important but very hard to describe(Because they are
important they are encased with thicker box borders as you can see). Their purpose is
to join the database files of one individual. For example, John Doe has a demographic
file, a Devereux file, an other tests file and a DSM 111 file. But how does REFLEX
know that all these four distinct files belong to John Doe? The answer is the link.
You will notice if you try to fill in any of these links REFLEX will give you the error
that “This Link can only be filled in by REFLEX. When you enter the Linked record this
Unk will be updated.” So you cannot enter information here, REFLEX will eventually
do it for you. We will get back to discussing these links later when we have discussed
entering other database files. Just be content in the fact that you are not allowed to
enter data in these blanks.
When you have completed entering information go back and check that everything
is correct. If there are any mistakes go back and edit the proper field. To edit the fields
just click on the appropriate field. This will again turn the whole field black except for
the existing figures. By clicking again on the same field a cursor will appear which will
enable you to edit the field by either inserting or deleting information.
Now that the record is completed in its entire form and you want to enter the record
in the database drag the cursor up to the DATABASE heading again. Move the mouse
down until ENTER RECORD is darkened then let go of the mouse button. After a short
delay the X in the top left hand corner will disappear which means the record is in the
database.
You are now finished with entering a student into the datab.
.
If you would like to
enter another student go back and repeat this procedure by again going up to the
DATABASE heading and dragging the cursor down to NEW RECORD. If you are
completed with the session, go to the F1LE heading and QUIT the session. Lastly, if
you want to go to another datafile go to the FILE heading and drag the cursor down to
The Macintosh will then prompt you and ask you what file
OPEN DATABASE FILE
you want to open and you can direct it to the appropriate file. This is useful if a student
enters the program and also has his/her Pre-Admission Devereux. You can first type in
their demographic information and enter that in the database, then open up the
C’
Devereux datafile and enter their test scores there
Behavioral Data
Afthough named Behavioral Data on the old collection forms, the name of the
datafile for this section is some deviation of the word Devereux depending on which
data disc you use(Devereux for the elementary data and Dev for the adolescent data).
We named it this because the only information present in this datafile are the Devereux
scores. So, you will only be opening this datafile if you are entering Devereux scores.
Like the demographic datafile, there are number of ways to open the datafite. You
can either click twice on the Devereux icon when you first open the program or you can
click twice on the Devereux/Dev name under the WINDOW heading or you can go to
the FILE heading, drag down to OPEN DATABASE FILE
and chose the
DevereuxiDev file name.
When you have opened the file you will see an existing record if there is one
present in the database. To enter a new one go to the DATABASE heading and drag
down to NEW RECORD again and let the mouse button go. The Devereux screen will
again appear but there will be no record present. The first box on the screen will be
black and will be expecting data. You will notice that there are two boxes contained in
a bigger box, this is the linked field we talked about before. Only the first of the two
boxes will be dark and you will see that the heading above it is last name. In this box
you will enter the last name of the student whose Devereux scores you are entering.
When you enter the last name and press return the dark box will jump to the box under
the Time Period section. It does not prompt you for the second box, but this must be
filled in with the students first name. So, using the mouse click on the second box and
it “‘ill be darkened for you. Type the students last name and press return and REFLEX
again take you down to the Time Period box.
In the Time Period box enter the initials given for the specific Devereux test you are
entering. It does not make a difference as far as capital letters go. Entering an “a” is
the same as entering an “A”. This is the case for any information you enter in REFLEX,
but remember the form must be identical to those initials given. In other words, you
must enter “Pre-A” and not “PreA”. You can now go on and enter the raw scores from
the Devereux test. The layout of the headings are very similar to the old data collection
form as well as the actual Devereux test sheet, with some minor deletions. Be advised
although the layout is very similar there are some differences that Carrie Fosselman
wanted
Again, when you are finished entering data, check to make sure it is
correct, edit
where necessary and enter the record by going to the DATABASE heading and
dragging the cursor to ENTER RECORD. The X in the top left hand corner should
disappear. Again, you have the same exiting criteria that you had in the demographic
database.
There is one problem that may arise when you enter this Devereux record as may
be the case when you try to enter a record in the OtherTest database or the
DSM_.1 1 1/DSM_lll database. This problem occurs when you try to enter the data for a
student’s name that is not present in the Patient database. For example, if you try to
enter the Devereux tests scores for Mary Smith before you have entered Mary Smith’s
demographic information, REFLEX will give you the following error message. There is
no record in Database “Patient with this key. Shall we enter one for you?” You will
have to respond ENTER or CANCEL. If you are entering the record of a student who
you know already exists in the demographic database or you think is in there, press
CANCEL, because chances are likely that you misspelled the name. After pressing
CANCEL check the spelling and try to ENTER RECORD again. If you get the same
error message you will want to check the demographic database to see how the name
has been entered there. You can either get there by going to the WINDOW heading
and see if the Patient datafile is there. If it is drag the cursor down to it and release the
mouse and this will get you into the Patient datafile. If the word Patient is not present
in
the WINDOW heading section, then open the file by going to FILE heading and
dragging down to OPEN DATABASE FILE and choosing Patient. Either way you get
into the Patient database is fine. Once in there use the SEARCH heading to try and
find the name you are looking for. The SEARCH commands are pretty self
explanatory; FIRST will give you the first record in the database, LAST will give you the
last, NEXT and PRIOR are what you think they might be. The records are ordered
alphabetically by Last Name which is how we defined it. After you locate the record,
you can see the spelling of the name and go back and correct it in the Devereux
entry
screen. If you can’t find it, this student apparently does not exist in the database so you
will have to enter the demographic information in the database after entering the
Devereux information. In either case go back to the Devereux screen using the
WINDOW method. Change the spelling of the student so that it matches if that is the
case and ENTER RECORD. There should not be an error message. If the student
didn’t exist use the ENTER RECORD and when the message appears press ENTER,
this will enter the name in the demographic database and you will have to go back and
enter the other information later.
REMEMBERW!!!!!! The above problem can happen in either the Devereux/Dev,
DSM1 1 1/DSM HI or the OtherTests dataffles. Use the above procedure for any case
where this error message occurs.
Achievement and Cognitive Data
This datafile contains WISC-R l.Q. scores, the Woodcock-Johnson
Psychoeducational Battery scores and the Achievement-Aptitude Profile descnption.
So if you want to enter one or all three of the scores enter the OtherTests database.
Enter the name of the student as described in the Devereux description and enter the
rest of the information that you want. Be advised that the grade, age and standard
scores have to be entered in the proper form. All the grade scores should have
decimal points and all age scores must have
“-“
(dashes) in them while the standard
scores are just integers. Also, underneath the Achievement-Aptitude Profile boxes you
will find a key as to which initials should be entered.
Discharge Data
This datafile only contains the DSM Ill scores. This file follows the same procedure.
Open the file(DSM_1 11 for adolescents DSM III for the elementary patients) and type
the students name, last and first in the appropriate spaces. The next box is the only
box that really needs explaining. There is an explanation above it but I will reiterate it
here. If the student is at original discharge or discharge before transfer, enter a D in
the box. If the student is being discharged after beino transferred put a T in the box.
This will distinguish between the two different times
discharging information. Lastly,
one major change is the input of the Axis scores or description. On the old data
collection forms you were used to entering the number code for the discharge
diagnosis. You will no longer enter the code, but rather.you will enter the descriptive
text. (To see which text to use see the little green bock called Quick Reference to th
Diagnostic Criteria from DSMJII)
This concludes an introduction to data entry into the student information system.
Again, for a more in depth look at different aspects of data entry consult the manual.
Also there is a mode in data entry called form layout. In form layout you are allowed to
manipulate how the data entry screens will appear We did not explain this due to the
fact that we designed the screens to look similar to the old data collection forms. We
believe we did a good job in designing the screens so that you need not be bothered
with this aspect of REFLEX. If you would like to redesign the screens, which we hope
you won’t, you can consult the manual.
REPORT DESIGN
This manual will center on how to design very basic reports and how to manipulate
the template report. The template report is the one requested by Carrie Fosselman in
conjunction with the evaluators at the Child and Adolescent Psychiatric School
Program. Although, the basic reports will not be as informative as the template report,
they sometimes can be very interesting.
Basic Reporting
The only type of reports we will discuss are those reports that produce queries on
one datafile. This means that you can access information in one datafile by conditions
on certain fields in the same datafile. For example, you will be able to get name, sex
and grade at admission by saying that the person must have some sort of incoming
certification. You can do this because all of these fields are in one file, the Patient file.
You would not be able to get the Devereux scores of all students from Monroe, since
Devereux scores and School District at Admission are in different database files. You
can produce such a report but we will not cover it in this manual. For that type of report
either see REFLEX manual or the manual produced for Carried Fosselman.
To produce a basic report the first thing to do is decide which group you want to
pull out, or do the report on. Then decide which information you want in the report and
you are ready to begin.
To start the report open the database that you wish to do the report on by using any
of the methods discussed in the data entry section. Next, go to the FILE heading and
depress the mouse, slide the black cursor down until it is on NEW REPORT and let the
mouse go. The computer will send you a message as to which way you want to make
the report. The first choice will be “Table-style report on “<DATABASE THAT YOU
JUST OPENED>”. You want this form so press the OPTION 1 box. The next thing that
will appear on the screen will be a box asking you which fields you want in your report.
Since you have already decided, darken those fields one by one using the mouse and
press the INCLUDE button. The right hand block will show you the fields that will be in
the report. When you have included all of the fields press OK. The INCLUDE ALL
button enters all the fields in the database into the report while the CLEAR ALL button
clears those fields that you have entered in the report.
After you press the OK button another window will appear called the Query Build.
In this box you will specify which records you want to pull out. The first thing you do in
this section is to go to the field that you want to do the query on and darken it using the
mouse. When that is done choose the “operator to use” and enter the value it must find
by typing the value in the “Value to Find” box. You do not have to worry about putting
text in quotation marks, REFLEX knows how to recognize it. When you have entered
all three parameters press the enter button. This will enter your query how it appears
to REFLEX in the bottom box. If you are done, press OK, but if you want to enter
another condition press “AND” or “OR”, whichever is desired and repeat the process.
When you are finished building the query press “OK”.
The next box to appear will be a dialog box where the computer will ask you to
name the report and save it. This will be very similar to saving the name of any other
file using the Macintosh. After you save the name of the report, there will be a slight
delay and then the report will appear on the screen. Now, once you have the report
you can work on its design so that it will appear as you want it. To work on the design
of the report, go to the REPORT heading and drag down until you darken in DESIGN
and release the button on the mouse. The only difference between the DESIGN
screen and the DISPLAY screen, is that the DESIGN screen has the grid on it. If you
have any question as to which mode you are in, you can look at the bottom left hand
corner of the screen to see which screen is actually on the monitor. When you are in
the DESIGN screen you can design the report so that it looks just how you want it. The
design section follows the same rules used in the form layout mode in data entry. To
understand the exact commands consult the owners manual, we will not go into report
design here.
c
Template Report
The template report is a report already designed which will give the acuity scores
on any particular group you would like to pull out of the database. The Devereux
scores that are covered in this report were those felt to be most important to judguig the
level of acuity by members of the Child and Adolescent Psychiatric School Program.
fl
The report pulls a certain group from the database, whatever group stated in the query
of the report, and gives the Devereux scores for these students. The Devereux scores
which are extracted from the database depend on whether a student is in the
adolescent database or the elementary database. In addition to the Devereux scores,
the report calculates the average scores for the students in this group along with the
standard deviation and the range(maximum and minimum) of those present. The
report also gives totals on how many people are in the report, how many came in with
suicide precautions, a modified school schedule and those who need one on one
supervision.
Although the report is complex it is easy to understand once you have a knowledge
of REFLEX as a report generator. We will not get into the intracacies of the report in
this manual, but will give you what is needed to produce the template report that you
want. To do this, all one needs to know is which group you want to extract from the
database and where to type in this information.
The template report we have designed picks out individuals by some field in the
demographic information datafile(Patient datafile) and then gives the Devereux scores.
We believe this would be the most common report and therefore design the report
accordingly. Later, when the Psychiatric School Program will do more in depth
queries, we hope you will have the knowledge of REFLEX plus our report as an
example and can produce your own reports.
The first thing you have to do is think of a report that you will want to generate on
one or more fields in the demographic datafile. Next, to start the report click twice on
the “template” icon if you are just starting. If you are already in REFLEX, go to the FILE
heading and go down to OPEN REPORT and let go of the mouse. Macintosh will ask
you which report you want to open 2d tell it you want the “template” report. Either way
you do this you will enter the report
he design mode, so the grid should be present.
Make sure you are in the design mode by checking the bottom left hand corner of the
screen. If you are in display, go to design by the method mentioned in the basic report
section.
In the design mode you will see a group a headings which are similar to scores on
the Devereux tests. You will see many boxes below that which are empty. Farther
down the page on the left you will see headings such as “average”, “standard
deviation”, “maximum” and “minimum”. To the right of that you will see boxes which
contain numbers and still further down the page four more lines of text with numbers to
the right of them. The numbers that are present are remnants of the previous report. It
might be wise to become familiar with the screens set up so that you know what you
are seeing. The top section, labelled “INDIVIDUALS’ will give you the Devereux
scores at the top of the page for those individuals you extract in the report. The bottom
section, labelled “GROUP”, will give you summary statistics on the group for the same
Devereux categories.
Now to create the report on the group you want, in the design mode click on the left
of right hand margin for the heavy box in the top section that encases all the other
boxes. As you do this you will see two text fields appear at the top of the screen. The
first box on the left should contain the word “theQuery”. This is an address and is used
in computing the group statistics at the bottom. You need not bother with that, in fact
don’t change it or it will alter the results you receive in the bottom section.
Just to the right of that you will see another box which already contains some type
of query. It is here that you will enter your new query by altering the existing one. If
you want to create a new report but still keep the one that exists, don’t worry you can
still do that. What you must do is after you alter the existing report go to the FILE
heading, drag down to SAVE AS... and give the new report a different name. Back to
the report, this box will contain the query on the Patient file as you can see Patient is
the first word in the box. It is here that you will want to type in the conditions of the
query. Your query will appear in the following form:
Patient WHERE <condition 1> <AND/OR> <condition 2> <AND/OR>
As we said, enter the conditions as you see fit. If the condition is on a text field,
remember to offset the text by quotes. Text must be set off in this section while it did not
need to be in the Query Build section. One of the conditions in this section should be
on th ‘x new fields mentioned in the Patient data entry section, while the first
cond.
should be on one of the other fields in the Patient file. What this means is
that the first condition, or however many you want to put in there, pulls out the group
you want, whether it be all males, all from a certain area or all having a birthday greater
then a certain year. Then you have to have one condition as to which test you want to
pull out, whether it be the Pre-Admission, Admission, Discharge or any other Devereux
test scores. An example of the form a query would take is as follows:
EX.
What are the Pre-Admission Devereux scores for those male students
from Monroe?
Patient WHERE Sex=”m” AND SchoojDist=”Monroe” AND PreA=”Y”
After this group is pulled out their last names are put into the report
The report is not complete yet After you type in the condition, go to the left or nght
hand side of the thick box on the inside of the first one. This box contains all the fields
the outer box did except for the Last Name box. When you click the box on this margin,
new text will appear at the top of the screen again. The upper left hand box is again an
address and it contains the word “DEVER”. Remember, don’t alter this box. The nght
hand box will again be a query beginning with “theDever”or “theDevers” depending on
which database you are accessing. The reason you have to enter a query in this box is
to confirm which test scores you want to extract. The form that appears should look like
the following:
theDever WHERE TimePeriod
=
theDevers WHERE TimeofTest
“<Devereux test>” (For Adolescent)
=
“<Devereux test>” (For Elementary)
All you have to enter is the <Devereux tess section. Put the proper initials in this field
to pull out the appropriate tests. The tests that you pull out should match those tests
you have specified in the first section of the query.
When you have finished altenng these two blocks you are ready to see your report.
First, if you wanted to save the report you just altered to get your new report, remember
to save this under a new name using the SAVE AS under the FILE heading. Now,
there are two ways to access the report. Either go to the REPORT heading and drag
the cursor down to DISPLAY and let go, or drag the cursor to CALCULATE and let go.
Both methods will display the report.
Although this will only give you a fundamental understanding of the reporting
capabilities of our template report and the abilities of REFLEX, it should give you
enough knowledge to get you underway. Remember, the owners manual will give you
a much better insight into REFLEX’s reporting capabilities.
CONCLUSION
In conclusion, we would like to say that this is not an in depth look at REFLEX or at
the student information system that we designed. Rather, it is just a manual that will
familiarize you with some aspects of the system. As we stated several times in the
manual, for a better understanding consult the REFLEX owner’s manual. Lastly,
remember Macintosh software is always pretty easy once you have been exposed to it
a liWe, so play around on the tutorial disc and get a beuer understanding of its
capabilities. It really is quite simple!
0
Good Luck,
Jim Smith
David Schmitz
APPENDIX
DATA ENTRY
PATIENT FILE
A. Demographic
la, Enter last name in blackened entry box and hit return (From hereon use
the return key or cursor to move to the next box)
lb. Enterfirst name
2. Enter the hospital registration number in the form xxxxxxx-x
3. Enter the date of admission in the form xxlxx/xx
4. Enter the program with the initials DRU, Al, or DH
5. Enter the date of birth in the form xxlxxlxx
6. Enter the grade placement at admission with the decimal point
7. EntersexasMorF
8. Enter school district at admission
9. Enter the incoming certification with the initials as follows:
El Emotionally Impaired
LD Learning Disabled
EM! Educably Mentally Impaired
TM) Trainably Mentally Impaired
POHI Physically or Otherwise Health Impaired
Al Autistic
PPI Pre-Primary Impaired
Sp/Lg Speech and Language Impaired
EI&LD
EI& EM!
EI&TMI
El & LD & Sp/Lg
LD & Sp/Lg
NC No Certification
OT Other (also write out full name)
-
-
-
-
-
-
-
-
-
(
-
lO.-13. EnteiYorN
APPENDIX
DATA ENTRY (cont.)
DEVER EUX
B. Behavioral Data
i. Enter the student’s last name in the darkened box
ii.
the student’s first name by placing the cursor inside the first
name box and clicking the mouse button (the cursor need only be used for
the first name box, all other entry boxes may be accessed via the return
key)
14. Enter the initials of the test as follows:
PRE-A P re-Admission
A-Admission
D Discharge
PD Post-Discharge
TA Transfer Admission
TD Transfer Discharge
(if the student has more than one test, create a new record under the same
name upon completion of this record using the different test initials)
-
-
-
-
-
15. 29. Enter the raw scores for the behavioral factors as integers
-
C
APPENDIX
DATA ENTRY (cont.)
OTHER TESTS
C. Achievement and Cognitive Data
i. Enter the last name in the darkened box (or use the cursor to access the
box)
ii. Enter the first name by placing the cursor inside the first name box and
clicking the mouse button (from hereon use the return key to access the
data entry boxes)
30. 32. Enter the WISC -R 1.0. scores as integers
-
33. 59. Enter the grade scores as a real and standard scores as
integers and the age scores as integers with dashes
-
60. 63. Enter the achievement-aptitude profile initials as follows:
SD Severe Deficit
MD Moderate Deficit
LA Low Average
HA High Average
S Superior
VS Very Superior
-
-
-
-
-
-
-
APPENDIX
DATA ENTRY (cont)
DSM III
D. Discharge Data
i. Enter the student’s last name in the darkened box or use the cursor to
access the data entry box
ii. Enter the student’s first name by placing the cursor in the corresonding
data entry box and cHcking the mouse button (from hereon use the return
key to access the next data entry box)
iii. Enter D if the DSM Ill scores occur at discharge QLI if the scores
occur after being transferred (if the student should have both, then enter D
and finish the axes descriptions for 64. 77. and then create a new record
under the same patient name for axes descriptions 79, 92.)
-
-
64. 77. Enter the three axis descriptions (at discharge) as text
-
79. 92. Enter the three axis descriptions (after being discharged) as
text
-
APPENDIX
FIELD QUALIFICATION
The foNowing is a list of aN the fields in the Elementary Database. Next to each field is
the type of field required for data entry (the Adolescent Database is similar).
A. Patient File
1. LastName-text
2. First Name-text
3. Hospital Registration Number text
4. Date of Admission date
5. Program-text
6. Date of birth date
7. Sex text
8. School District At Admission text
9. Incoming Certification text
10. Problems in School text
11. Suicide Precautions text
12. Modified School Schedule text
13. 1:1 Supervision text
-
-
-
-
-
-
-
-
-
-
B. Devereux File
14. Time of Test-text
15. Work Organization integer
16. Creative Iniative/Involvement integer
17. Positive toward Teacher integer
18. Need for Direction in Work integer
19. Socially Withdrawn integer
20. Failure Anxiety integer
21. lnmpatience integer
22. Irrelevant thinking/Talking integer
23. Blaming integer
24. Negative/Agressive integer
25. Perserverance integer
26. Peer Cooperation integer
27. Confusion integer
28. Inattention integer
29. Achievement Compared to Peers integer
-
-
-
-
-
-
-
-
-
-
-
-
-
-
-
C. OtherTests File
30. Full Scale integer
31. Performance integer
32. Verbal integer
33. FSBCGrade number
34. FSBCAge-text
35. FSBCStandard integer
36. Oral Language Grade number
37. Oral Language Age text
-
-
-
-
-
-
-
AEE
FIELD QUALIFICATION (cont.)
0
38.
39,
40.
41.
42.
43.
44.
45,
46.
47.
48.
49.
50.
51.
52.
53.
54.
55.
56.
57.
58.
59.
60.
61.
62.
63.
Oral Language Standard integer
Broad Reasoning Grade number
Broad Reasoning Age text
Broad Reasoning Standard integer
Visual Perceptuaj Speed Grade number
Visual Perceptuaj Speed Age text
Visual Perceptuaj Speed Standard integer
Memory Grade number
Memory Age text
Memory Standard integer
Reading Cluster Score Grade number
Reading Cluster Score Age text
Reading Cluster Score Standard integer
Mathematics Cluster Score Grade number
Mathematics Cluster Score Age text
Mathematics Cluster Score Standard integer
Written Language Cluster Score Grade number
Written Language Cluster Score Age text
Written Language Cluster Score Standard integer
Knowledge Cluster Score Grade (lumber
Knowledge Cluster Score Age text
Knowledge Cluster Score Standard integer
Reading Achievemeflt..Aptjtude text
Mathematics AchievemefltAptitud text
Written Language Acheivemeflt..Aptjtud text
Knowledge Achievement.Aptjtuded text
-
-
-
-
-
-
-
-
-
-
-
-
-
-
-
-
-
-
-
-
-
-
D. DSM Ill File
64. Transfer Student or Not text
65. 77. (All Discharge Data) text
78. Research Number integer
79. 92. (All Discharge Data) text
-
-
-
-
-
-
APPENDIX
Shortcuts Using The Control Key
Using the control key (found immediately left of the space bar) and the designated
letter, the following functions can be performed without directly accessing the menu
DATABASE OVERVIEW
A. File Menu
1. Save Design S
2. Revert to Old Design
-
B.
1.
2.
3.
4.
5.
-
R
Edit Menu
Undo-Z
Cut-X
Copy-C
Paste-V
Duplicate D
-
C. Describe Menu
1. Key Field-K
D. Overview Menu
1. Show Linked Files G
-
DATA ENTRY/FORM LAYOUT
A. File Menu
1. Save Record/Form S
2. Revert to Old Record/Form- R
-
B. Edit Menu (same as above)
(
C.
1.
2.
3.
4.
5.
6.
Database
New Record-E
Delete Record T
Copy Record M
Enter Record W
New Link-H
Show Linked Record
D.
1.
2.
3.
4.
5.
6.
7.
Search/Layout
First Record-F
Last Record L
Next Record N
PriorRecord-P
Search On... 0
Find All A
Edit Record/Field Qualification
-
-
-
-
G
-
-
-
-
-
Q
AEENDIX
0
Shocuts Using the Control Key (COfltJ
A. File Menu
1. Save Report S
2. Revert to Ol Report R
REPORT DISPLAY/DESiGN
-
-
B. Edit Menu (same as above)
C.
1.
2.
3.
Report Menu
Calcujafe..C
Edit Formula -Q
Edit Name
-
C
GENERAL REPORTING MANUAL
STUDENT INFORMATION SYSTEM
CHILD AND ADOLESCENT PSYCHIATRIC SCHOOL PROGRAM
ThE UNiVERSITY OF MICHIGAN
JAMES SMITH
DAVID SCHMITZ
APRiL 22, 1987
LLRPDjJCTJQN
•
This is the second of two manuals written to operate the new Student lnfort’nation
System at the Child and Adolescent Psychiatric School Program designed by Jim
Smith and David Schmitz, The first manual gives a description of the system so that
data entry personnel and other less interested employees will now how to enter data
and construct basic reports. This manual will deal with only one topic and that will be
how to construct more complex reports from the system.
We have constructed a number of preliminary reports to illustrate all the possible
queries that could be produced from this database. We will show you the type of
reports you can generate by looking at these sample reports for examples.
DEFINITIONS
Before we get started, it is a necessity to understand the terms we will be using in
this report. The wording will be important and it’s imperitive that you know the
difference between what we refer to as a “database” and a “file”.
1) Database- When we refer to our database, we are refering to all four boxes
that compose the Student Information System. That means Patient, Devereux,
OtherTests, DSM_lll boxes and the links are what we refer to as the database.
2)
Datafile- A datafile is one file in the database. For example, the Patient box is
a datafile which is a quarter of the database. So in our system we have four datafiles.
3) Recor&Field- These are the seperate words in each datafile. For example,
Hospital Registration Number is a field in the Patient datafile.
4) Key Field- Is a field in a file that distinctly identifies an entity in that file. For
example a persons fingerprints would be a key field if you could input that, but since
we can’t, we think of their name as the key.
Link Field- These are the field in that appear in bold in the Database Overview
window. These are the fields that link files.
5)
6)
Repeating Collection- The repeating collection is a structure in the report
designing process. It is a very important construct when querying the database and
producing reports. In laymens terms, it operates similar to a loop in computer
programming. What we mean by that is that it is an iterative structure in that it pulls out
all records that meet a certain criteria stated in its definition until there are no such
records that exist.
Now that we know some definitions, we are ready to go over the reports. The best
way to actually cover reports is to see how they are built and what types of results they
get. To see how these reports wori we built examples of them and you can access
them using the example report and miscellaneous disc and follow along using the
manual below
REPORTS
Template Report -(Diagnosis Report)
The template report is by far the most complex report that we have designed. An
understanding of this report will facilitate understanding of all the others. The template
report operates under the assumption that you are doing a query on the Patient datafile
and through the links to the Devereux/Dev file you are retrieveing Devereux test
scores. In the report that we designed, we include one field from the Patient datafile
and then the eight or nine Devereux fields that are required depending on what
database you are using. Although this report is described in the data entry manual, we
will go into greater detail in this report.
The template report, as it was originally designed, pulls out all the students with
Pre-Admission Devereux tests, and calculates the average, standard deviation and
ranges for the different fields needed in the template which we designed. To
understand how it does that lets look at the report. Open the template Il report and go
to the DESiGN screen. You will see the design of the entire report on the screen.
There should be numbers in the boxes near the bottom of the screen, these are
leftovers from the previous report and need not be bothered with. You will see many
headings, but the important thing to notice are the empty boxes under the first batch of
headings. These are the boxes we are concerned with to pull out the information you
want.
The first box which encorporates all the others and has the thick right and left
margins is what we described before as a repeating collection. If you click on one of
the side margins, the outline of the box will da
n and some text will appear on the top
of the screen. On the left hand side appears the word “theQuery”. This is the label of
the box and will be used later when we have the summary statistics at the bottom of the
report. To the right of that you will see “Patient WHERE PreA
=
‘Y’”. This is the
definition of the box, which means that the information that appears in the repeating
collection must satisfy the definition. Therefore, the information will come from the
Patient datafile and must have a “y” in the PreA field.
Now although this box will retrieve the information, you must specify which
information is present in the report, If you click on the box underneath Last Name you
will see new text up top On the left is the address again, which is probably very similar
to the text on the right. By typing LastName to the right we are saying, “put the last
name from the Patient datafile in this box, but it must first meet the criteria of the
repeating collection first, since the name box is inside the repeating collection. The
three boxes underneath represent the response to the question to whether the student
needed suicide precautions, a modified school schedule or one on one supervision.
We did not label these due to the fact that they are not needed in the report and are
only present so that we can count the number of students with positive responses to
these questions. Again these boxes follow the same rules as the Last Name box did.
Hopefully you can see that because that was the easy part. Now we get into the
difficult stuff. Now go and click on the inside repeating collection margin. The left
margin of this box should be just underneath and to the left of the first heading past
Last Name. When you click on the mouse and darken in this box you will again see
the two text boxes up top. The address box will have the name “Dever” and again can
be ignored til later. The box to the right will have the text “theDever WHERE
TimePeriod
=
“Pre-A””.(’theDever’ will appear in the adolescent report while
‘the Devers’ will be the elementary report wording) This says that now that you are only
looking for those students with PreA
=
‘y’, follow the link called ‘theDever’, which is the
link to the Devereux file, to that file. When your there only look at those Devereux tests
where TimePeriod
=
“pre-A”. This condition is required because a student may have
more then one Devereux test and you need to know which scores to retrieve.
Lastly, if you click on the boxes inside the inner repeating collection you will notice
that they have labels which match the field you want to retrieve. This means you have
now retrieved the student you want from the Patient file, you have retrieved his/her
name, you also went throught the link and retrieved their Devereux scores and now
you are putting the fields from the Devereux datafile into the report. Complicated,?
sure it is but it could be worse, couldn’t it.
That takes care of the upper portion of the report. You could get a report just on the
top section and it would give you all the information on the individuals. The lower
L
section of the report gives summary statistics on the information you have in the first
section. One way to think of it, is that you accessed the database to get the information
in the top, Now you will access the top information to get the results in the lower half of
the report. In otherwords you are doing a report on a report. This was the reason that
all those boxes had addresses, that way you can access them now by their address.
To show you how we get these figures in the lower boxes go to the box under
Defiant if your in the adolescent report, or under Neg/Aggressive in the elementary
report. accross from average. Click on the box and again you will see the two blocks
on the top of the page. The one on the left will contain some letter/number text, that is
again the address. This time however, we will not have to access that box later so we
have not given it a descriptive name. To the right you will see the text “AVERAGE
(Defiant FROM Dever FROM theQuery’. First of all AVERAGE is a REFLEX function
which computes the average of those values contained in the parenthesis. The values
contained in the parenthesis are those records with the Defiant address from the
repeating collection whose address is DEVER contained in another repeating
collection whose address is named theQuery. That means that REFLEX will average
all the numbers in the report under the heading of defiant. It does this for fields accross
from average and you can see this if you click on all those boxes. They will have the
identical text in the block except for the first word in the parenthesis section will be the
address of the field you want to average.
The standard deviation, maximum and minimum are also identicaL They contain
the exact parenthesis text as the box above it but with a different function before it. For
standard deviation you will have the word “STDEV” preceding it. For the maximum it
will be “MAX” and for the minimum it will be “MIN”.
Underneath this section you will find four lines of text which calculate how many
people you have in certain categories. This is done using the “COUNT” function of
REFLEX. To get the total number of people in the report you count the number of last
names. In the other three cases, you count up the number of persons in the report that
have “y” in the appropriate boxes. To get these three numbers is why we had to
include the three labeless fields in the top section of the report.
Now that we have explained the report we will go about explaining how to get the
report you want. To get your report you only have to alter two blocks. Go back to the
outside repeating collection and click on it so that it is darkened in again. The right
hand box is the important block to alter. This block is were you enter the information on
the students you want in the report. You will leave the word “Patient WHERE” and then
you can add the conditions you want. Some examples of conditions you might want
are:
IncomeCert
DateofBirth
=
>
“ei” (To see those students who come in emotionally impaired)
5/1/68 (Students who are older then a certain age)
You can put a combination of conditions together simply by joining them with an “AND”
clause.
IMPORTANT thing to remember later on when you start to use the PURGE field
The purge field was put in so that you could keep the information of a student in the
database but not access it in the report. When you began to use this field and put a “y”
in it when you no longer want to consider the student in the report, remember to always
include that condition in this block. The condition will have the following form:
ANDPurgec”Y”
The only other change that needs to be done is on the inside repeating collection.
Go to the inside repeating collection and click on it. The only text that needs to be
changed depends on the test that you want to retrieve and that only affects the
information that is in the quotation marks. As it exist now, “Pre-A”, the Pre-Admission
Devereux scores are the ones that will be retrieved. You can change that to which
ever test you want, whether it be “A”(Admission), “D”(Discharge), “PD”(Post Discharge),
“TA”(Transfer Admission) or “TD(Transfer Discharge).
When these two blocks have been changed you can run the report again and get
the results you want. If you ever run the report and want to retrieve only one students
test scores, don’t be surprised if you get error messages in some of the boxes in the
bottom half of the report. Some of the function boxes are only defined when you have
more then one data set. For example, if you pull out John Doe’s pre-admission
Devereux scores and try to compute a standard deviation you will find that it is
undefined.
That completes the explaination of the template report and it gives you enough
knowledge to handle any report which involves doing a query on one file and
retrieveing informaton from another file which has a key. To do a report in which you
will access DSM_III scores ba
in Demographic information would follow the same
form, since the DSM III file has a key field. An example of that type of report is present
on the sample report disc under the name Diagnosis. Open that report to see how it
operates and you will notice that it follows the same operation as the template record.
Other Test
Another report is doing a query on a field and then accessing another file without a
key field. An example of that type of report is doing a query on the Patient file and then
retrieveing information from the OtherTest datafile, since this file has no key. To see an
example of this lets look at the report Other_Test on the sample report disc. Open this
report and go to the design screen. On the design screen you will see only five boxes.
Four of the boxes will be contained in a large repeating collection box. Click on the
repeating collection margin and you will see in the block above Patient WHERE sex
=
“m”. This means that the only information that will go in this repeating collection are
those male students in the database. Now if you click on the box underneath Last
Name you will see how this box will contain the last name of the persons in the report.
The box under Full Scale, when darkened will show the following definition at the top
of the screen: “WISCWJ’s FuliScale”. What this means is one it has found a student it
looks at its link to the OtherTest datafile, which is WISCWJ and follows that link to the
OtherTest file. Once there it can retrieve the information for the Full Scale score, the
Performance score and the verbal score. This report was easier then the template
score in the fact that once we followed the link to the datafile, we did not have to specify
which file we wanted. The Devereux file may have six different files for each student,
the DSM_lll may have two, but the OtherTest only has one so once you follow the link
you don’t have to specify anything further.
sat Report
So far the emphasis of these reports has been on doing queries in the Patient
datafile and then accessing information in one of the three linked files. Another way in
which you can do a report is to do a query on one of the three datafiles and then go the
other way and access the Patient datafile second. The sat report is an example of how
you can do this. The sat report says find all the Devereux test where the Defiant field is
greater then eight and then follows the link and goes and gets the name of the student
and his or her sex.
Open the sat report and go to the design screen. You will see a large repeating
collection and containing a smaller box and another repeating collection. Click on the
outside repeating collection and you will see it is defined as “Dev WHERE Defiant
>
8”.
This means you look for the test that have a defiant score greater then eight. The small
box inside the repeating collection then writes out the defiant score. The inner
repeating collection is described by “thePupil” which is the name of the link that
connects the Dev datafile with the Patient datafile. Due to the fact that Last and First
Name are the keys in the Patient datafite they are also the fields present in the link. So
by just accessing the link in this case we get the name of the student with this test
score. Since we have already accessed the Patient datafile using thePupil” we only
have to label the box with “sex to get the sex of the student. We are already in the
Pateint dataflie when we are in the inside repeating collection.
This concludes are discussion on reporting. Remember this is far from an
exhausitve list of the reports we can design, but please be advised that to really get an
understanding of the reporting capabilities you must read the REFLEX manual.
LONG TERM PROBLEMS
There are a couple of problems which will eventually arise that the operators of this
system must deal with. The problems are; 1 )how to purge the system, 2) memory
constraints and 3)expanding the database.
The problem of purging the system, I think we handled quite well with the
installation of the Purge field. Using the Purge field you can keep the records in the
database but not have to access them when reporting. Eventually, however you might
C.
want to remove them. There is a process that you can export data, but we where very
unsure on how that operated in the system. Someday, the operators might want to find
out how to erase records from the database but still keep them on file.
The memory problem should not occur for some time. There is enough room on a
single sided disc for more records then the School Program will probably deal with for
several years. There are alternatives if you ever do run in to problems. Either you can
expand the Macintosh computer so that it can read double sided discs, which will
double the amount of memory space you can have. Another alternative would be to
buy hard discs and increase the internal memory of the computer and keep some of
the data there. However, I do not think you will run into any memory problem for quite
some time.
Lastly, we designed the database for the information which is now collec,
y the
School Program. If you ever find that you will have to add fields or other information to
the datafiles don’t be afraid to do so. It is very easy to add fields, as the manual will
show you and you can probably do many interesting queries on new fields you can
add.
CQNCLUSIQN
We hope you find this manual somewhat helpful in the production of reports
. We
realize it is not extensive, but you will have to become familiar with REFLE
X before you
use it. so the best we could do is give you a brief introduction. Good Luck
in your
report building.
Sincerely,
Jim Smith
David Schmitz
(Designors)
U