1
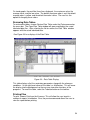
(waveforms) of up to three calculated parameters simultaneously. These
waveforms are displayed in easy to distinguish colors. The color of a particular
waveform will match the color of its corresponding Y-axis at the left of the plot
window. The zero axis for each waveform within the plot window will also be
indicated by a color coordinated dotted line matching the color of the
corresponding waveform.
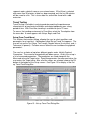
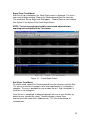
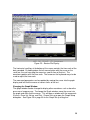
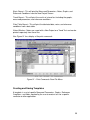
Right clicking the mouse in the graph area will display a menu with the
commands Set Up and Print. Choose Print to access the real-time graph and
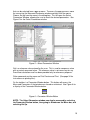
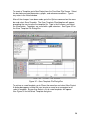
printing options. Choose Set Up to access the Graph Set Up Dialog window.
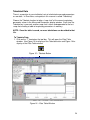
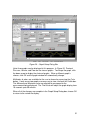
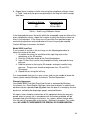
This window allows the user to set up graphs for display along with a time scale
and choice of color of the waveform. See Figure 9 for a display of the Graph Set
Up Dialog window.
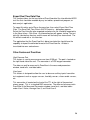
Figure 9 – Graph Set Up Dialog window
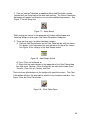
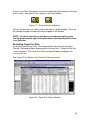
The Graph button on the tool bar is used to access the graphs if that window was
closed or minimized. See Figure 10 for a display of the Graph button.
Figure 10 – Graph Button
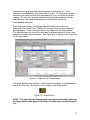
NOTE: The Graph Set Up Dialog window can also be accessed by selecting
the Graph button, then going to Window on the Menu bar and selecting Set
Up.
17