1
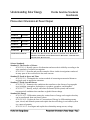
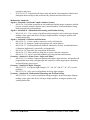
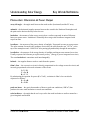
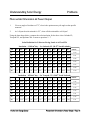
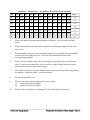
Understanding Solar Energy
Teacher Page
Photovoltaic Orientation & Power Output
Student Objective
The student:
•
will be able to predict how a
photovoltic module’s tilt angle in
relation to the sun will affect its
power output
•
will be able to predict how the solar
azimuth will affect the power output
of a photovoltaic module
•
will be able to explain how the angle
of solar incidence is used to calculate
the optimum array tilt angle
•
will be able to determine the best
angle for a fixed panel to maximize
its power for various times during
the average year
•
will be able to determine how to face
a photovoltaic array to maximize its
output to match the utilities’ peak
load time
•
will use voltage, current and power
data to provide explanations.
Key Words:
array tilt angle
azimuth
insolation
irradiance
irradiation
latitude
Ohm’s Law
peak sun hours
solar incidence
Time:
1 - 2 class periods
Materials:
•
laboratory manual
•
key word list
•
photovoltaic module
•
insolation meter (solar meter)
•
multipurpose meter
•
(2) wires with alligator clips
•
protractor
•
ruler
•
rod or other long thin object
•
graph paper
•
compass
•
heavy paper or cardstock
Florida Solar Energy Center
Photovoltaic Orientation & Power Output / Page 1
Procedure
1.
Engage: Lead a discussion on the questions and results from the PV Power Output and
I-V Curve exploration and answer any questions that the students have from the problem
set. Most of the general PV questions that the students have would make good
independent (internet) research. Extra credit could be given to students who research a
class question and report the answer.
2.
Points that may be brought up in discussion that will be covered more thoroughly during
this investigation, and thus could be given a “you will find out today” response:
•
modules were very sensitive to what direction they were pointing in relation to the
sun, thus causing differences in the data collected
•
time of day would affect the data collected
•
student readings were lower than manufacturer’s specifications. Some reasons for
this will be discovered today.
3.
Compare and contrast the new terms to be introduced in this exploration: solar noon,
short circuit current, open circuit voltage, maximum power point, and any other terms you
feel are confusing to your students.
4.
Students should work in teams of 3 - 5 per team. Pass out materials.
5.
Explore: Students should follow written procedures and complete the activities in the
Laboratory Manual.
6.
The problem set is optional. It synthesizes and evaluates student knowledge.
Related Reading
•
Photovoltaics: Design and Installation Manual by Solar Energy International (New
Society Publishers, 2004)
Solar Energy International (SEI) is a non-profit that trains adults and youth in renewable
energy and environmental building technologies. This manual is well-suited for those
who have some electrical experience, and students in high school tech prep-level courses.
The book contains an overview of photovoltaic electricity and a detailed description of
PV system components, including PV modules, batteries, controllers and inverters. It also
includes chapters on sizing photovoltaic systems, analyzing sites and installing PV
systems.
Internet Sites:
http://www.fsec.ucf.edu/en/consumer/solar_electricity/basics/index.htm
Florida Solar Energy Center’s photovoltaic fundamentals page explains the basics of
photovoltaic cells including their manufacture, the components of systems, as well as the
pros and cons of photovoltaic power.
http://www.mathconnect.com/ENGINEERING-Formula.htm
Common electrical formulas and conversions
http://solar.anu.edu.au/level_1/Sun/PVPanel/PVPanel.html
Centre for Sustainable Energy Systems (CSES) interactive page calculates the power
output of an array based on a variety of parameters including location, date and time, and
array tilt angle.
Florida Solar Energy Center
Photovoltaic Orientation & Power Output / Page 2
http://rredc.nrel.gov/solar/old_data/nsrdb/
National Solar Radiation Database contains 30 years (1961-1990) of solar radiation and
supplementary meteorological data from 237 NWS sites, plus a user manual to help in
reading the tabular information.
http://wrdc-mgo.nrel.gov/
World Radiation Data Centre. Worldwide solar radiation site.
http://www.wattsun.com/resources.html
Array Technologies’ Wattsun website contains cost and power output comparisons of
fixed and tracking arrays.
http://www.wattsun.com/resources/calculators/photovoltaic_tilt.html
Array Technologies’ interactive page calculates array tilt angles based on latitude.
Florida Solar Energy Center
Photovoltaic Orientation & Power Output / Page 3
Understanding Solar Energy
Answer Key
Photovoltaic Orientation & Power Output
Answers - Laboratory Exercises
1.
2.
3.
Varies depending on class time. However, there should be consistency between groups.
The data will vary depending on the irradiance level during class time. However, the
average power outputs should be fairly consistent between groups.
The graphs will vary from class to class, however a typical example is below. Graphs
should be labeled with units and titled correctly. The independent or x- axis is tilt angle,
dependent or y-axis is power (watts) and graph intervals should be equally spaced. The
title of the graph should include the irradiance level when the readings were taken.
4.
Answers will vary, but students should indicate that the angle of incidence of the PV
system has a direct relationship to the output of voltage, current, and power.
5 - 8. Students should conclude that the maximum power, voltage and current output is
obtained when the face of the panel is perpendicular (90 o) to the angle of solar incidence.
Formulas should reflect this:
= 90 or
= 180 - (90 + )
8.
Answers will vary, but should include the concept of the changing sun’s path depending
on the time of day, latitude of the location and the season of the year; therefore constantly
changing the optimum array tilt angle.
9.
Varies depending on class time, but should be consistent between groups.
10.
15o per hour (360o / 24 hours or 180o / 12 hours)
11.
The data will vary depending on irradiance level during class. However, the average
power outputs should be fairly consistent between groups and students should recognize a
pattern of decreasing power as time changes equally before and after solar noon.
12.
Students should indicate that the simulated azimuth angle has a direct relationship to the
power output of the module.
13.
The graphs will vary from class to class, however a typical example is below. Graphs
Florida Solar Energy Center
Photovoltaic Orientation & Power Output / Page 4
should be labeled and titled correctly. The x- axis (independent variable) is simulated
time, y-axis (dependent variable) is power, and graph intervals should be even. The title
of the graph should include the irradiance level, and the word ‘simulated’ should appear
in the title.
14.
15.
16.
17.
18.
19.
20.
21
22.
23.
24.
25
Solar Noon
Answers may vary, but should include the range of times around solar noon (i.e. 10:00 2:00 or 9:00 - 3:00)
Students should indicate the range of times that represent the upper 50% of their graph.
10:00 - 2:00 or 9:30 - 2:30 is typical.
Answers will vary, but students should understand that maximum power is produced
when the angle of incidence of sunlight to the face of the module is 90 o.
Students should indicate that the array will be positioned to face in a more westerly
direction. Some students may realize that to position the array for a 5:00 peak load would
require positioning the array 65o to the west of solar noon.
Students should realize that as the sun gets closer to the horizon the amount of
atmosphere it needs to travel through increases. The increased atmosphere decreases the
amount of power because it diffuses more of the sunlight.
More energy
Answers may vary, but students should understand that an increase in cost would be
associated with including a tracker in the system, and that the tracker would also require
energy to operate, thus affecting the net power output.
4.69 kWh/m2
6.27 kWh/m2; May; 0o tilt angle
December, 40o
Approximately the same. Answers will vary, but students should realize that the table
data is an average of the particular years, therefore mitigating circumstances like unusual
weather could contribute to a slight difference from year to year.
Florida Solar Energy Center
Photovoltaic Orientation & Power Output / Page 5
Answers - Problem Set
1.
2.
3.
4.
5.
6.
7.
8.
9.
10.
15
-67o
Orlando 4.69; Tonopah 5.82; Spokane 3.86
Orlando – 4.95, 25o
Tonopah – 6.55, 30o and 35o
Spokane – 4.40, 35o
Orlando – May, 6.27, 0o
Tonopah – June, 8.80, 0o
Spokane – July, 7.44, 0o
Orlando – December, 40o
Tonopah – January, 50o
Spokane – December, 60o
No, no, no
Answers will vary, but students should realize that the weather in each city directly
affects the solar insolation received.
(a)
When a PV array is tilted at a lower angle than latitude, the energy production will
typically peak during the summer months.
(a)
PV arrays tilted at angles higher than latitude will generally have higher energy
production during winter months.
East orientated PV arrays will produce more energy in the morning hours, and west
orientated PV arrays will produce more energy in the afternoon hours. Students may also
state that west-facing arrays may be beneficial for producing more energy during utilites’
peak load hours.
Florida Solar Energy Center
Photovoltaic Orientation & Power Output / Page 6
Understanding Solar Energy
Florida Sunshine Standards
Benchmarks
Photovoltaic Orientation & Power Output
1
2
3
4
5
X
X
6
7
8
9
1
0
1
1
1
2
1
3
1
4
1
5
1
6
1
7
1
8
1
9
Nature of Science
Standard 1
SC.912.N.1.
Earth and Space
Standard 5
SC.912.E.5.
Standard 7
SC.912.E.7
X
X
X
Physical Science
Standard 10
SC.912.P.10.
Mathematics Standards
X
X
X
X
MA.912.A.1.4, MA.912.A.10.1, MA.912.A.2.1, MA.912.A.2.2, MA912.A.2.7,
MA912.A.2.8, MA.912.A.2.12, MA.912.A.2.13, MA.912.G.1.1, MA.912.G.5.3,
MA.912.G.5.4, MA.912.G.8.2
Science Standards
Standard 1: The Practice of Science
•
SC.912.N.1.4 - Identify sources of information and assess their reliability according to the
strict standards of scientific investigation.
•
SC.912.N.1.5 - Describe and provide examples of how similar investigations conducted
in many parts of the world result in the same outcome.
Standard 5: Earth in Space and Time
•
SC.912.E.5.11 - Distinguish the various methods of measuring astronomical distances
and apply each in appropriate situations.
Standard 7: Earth System Patterns
•
SC.912.E.7.4 - Summarize the conditions that contribute to the climate of a geographic
area, including: atmosphere, hydrosphere, cryosphere, geosphere, and biosphere.
•
SC.912.E.7.7 - Identify, analyze, and relate the internal (Earth system) and external
(astronomical) conditions that contribute to global climate change.
Standard 10: Energy
•
SC.912.P.10.1 - Differentiate among the various forms of energy and recognize that they
can be transformed from one form to others.
•
SC.912.P.10.2 - Explore the Law of Conservation of Energy by differentiating among
open, closed, and isolated systems and explain that the total energy in an isolated system
is a conserved quantity.
•
SC.912.P.10.15 - Investigate and explain the relationship among current, voltage,
Florida Solar Energy Center
Photovoltaic Orientation & Power Output / Page 7
2
0
•
resistance, and power.
SC.912.P.10.19 - Explain that all objects emit and absorb electromagnetic radiation and
distinguish between objects that are black body radiators and those that are not.
Mathematics Standards
Algebra - Standard 1: Real and Complex Number Systems
•
MA.912.A.1.4 Perform operations on real numbers(including integer exponents, radicals,
percent, scientific notation, absolute value, rational numbers, irrational numbers) using
multi-step and real-world problems.
Algebra - Standard 10 : Mathematical Reasoning and Problem Solving
•
MA.912.A.10.1 - Use a variety of problem-solving strategies, such as drawing a diagram,
making a chart, guess-and check, solving a simpler problem, writing an equation, and
working backwards.
Algebra - Standard 2: Relations and Functions
•
MA.912.A.2.1 - Create a graph to represent a real-world situation.
•
MA.912.A.2.2- Interpret a graph representing a real-world situation.
•
MA.912.A.2.7 - Perform operations( addition, subtraction, division, and multiplication)
of functions algebraically, numerically, and graphically.
•
MA.912.A.2.8- Determine the composition of functions.
•
MA.912.A.2.12- Solve problems using direct, inverse, and joint variations.
•
MA.912.A.1.13 - Solve real-world problems involving relations and functions.
Geometry - Standard 1: Points, Lines, Angles, and Planes
•
MA.912.G.1.1 Construct congruent segments and angles, angle bisectors, and parallel and
perpendicular lines using a straight edge and compass or a drawing program, explaining
and justifying the process used.
Geometry - Standard 5: Right Triangles
•
MA.912.G.5.3 - Use special right triangles ( 30o - 60o- 90o- and 45 -o 45o- 90o ) to solve
problems.
•
MA.912.G.5.4 - Solve real-world problems involving right triangles.
Geometry - Standard 8 : Mathematical Reasoning and Problem Solving
•
MA.912.G.8.2 - Use a variety of problem-solving strategies, such as drawing a diagram,
making a chart, guess-and check, solving a simpler problem, writing an equation, and
working backwards.
Florida Solar Energy Center
Photovoltaic Orientation & Power Output / Page 8
Understanding Solar Energy
Key Words/Definitions
Photovoltaic Orientation & Power Output
array tilt angle - the angle made between the earth surface (horizontal) and the PV array
azimuth - the horizontal angular measure between due south in the Northern Hemisphere and
the point on the horizon directly below the sun
insolation - the amount of solar energy received on a surface expressed in units of kilowatthours per square meter. Insolation is essentially the average solar irradiance integrated with
respect to time.
irradiance - the measure of the power density of sunlight. Expressed in watts per square meter.
The solar constant for earth is the irradiance received by the earth from the sun, 1367 m 2, at the
top of the atmosphere and 1000 W/m2 after passing perpendicularly through the atmosphere.
irradiation - the measure of the energy density of sunlight reaching an area summed over time.
Usually expressed in kilowatts per square meter per day. (Energy is power integrated over time)
The term insolation is sometimes used interchangeably.
latitude - the angular distance north or south from the equator
Ohm’s Law - the current in a circuit is directly proportional to the voltage across the circuit, and
inversely proportional to the total resistance of the circuit
I=V/R
V=IxR
R=V/I
By substituting the equation for power (P = V x I), variations in Ohm’s law can also be
expressed as follows:
P = I2 x R
P = V2/R
peak sun hours - the equivalent number of hours at peak sun conditions (1kW/m 2) that
produces the same total insolation as actual sun conditions
solar incidence - the angle that the sun’s rays strike the earth in relation to surface normal at a
given longitude and latitude
Florida Solar Energy Center
Photovoltaic Orientation & Power Output / Page 9
Understanding Solar Energy
Laboratory Manual
Photovoltaic Orientation & Power Output
You might have inferred from Activity 1, that the direction a photovoltaic module is facing in
respect to the position of the sun affects its power output. In this activity you are going to
investigate some of the orientation factors that affect the electrical output of the PV device.
Solar Irradiance
Use an insolation meter to measure the amount of solar irradiance (kW/m 2). Make sure you face
the meter directly at the sun. Record below the highest reading that you obtain and complete the
information below.
Date
Time
Latitude
Daylight Savings Time?
Irradiance reading
yes
no
W/m2
Solar Incidence
1.
Calculate the solar incidence. To do this, take a long slender object (such as a rod or
pencil) and with one end touching the ground, point the other end towards the sun.
When you are pointing directly at the sun, the pointer will not cast any shadow. Use a
protractor to measure the angle between the rod and the ground and record it below.
Angle of solar incidence _______________
Array Tilt Angle
2.
Does a module’s angle in relation to the Sun have an affect on its output power? Use
your protractor to set the array tilt angle (the angle that the module is tilting up from the
ground) for each of the angles listed in the data chart below. Measure and record the
voltage and current for each of the array tilt angles listed in the data table. Repeat the
test three times to verify your angle measurements. Calculate the averages of the current
and voltage readings for each angle. Calculate the power output.
(Remember: P = V x I).
Note: Irradiation readings should be as constant as possible throughout the whole
investigation. If the weather is not perfectly clear, have one team member watch the
readings on the isolation meter and advise if there is a significant change (+/- 50 kW/m 2)
due to cloud cover. During the test, readings should be taken quickly to minimize the
effect of a change in irradiance level.
Florida Solar Energy Center
Photovoltaic Orientation & Power Output / Page 10
Module
Tilt
Angle
Voltage
Trial
1
Trial
2
Trial
3
Current
Average
Trial
1
Trial
2
Trial
3
Average
Power
Output
0o
10o
20o
30o
40o
50o
60o
70o
80o
90o
Irradiance
Application and Analysis
3.
Graph (on a separate sheet) the change of power output as a function of the changing tilt
angle. Your title should include the average irradiance level and your axis should be
labeled properly. (Note: Your independent variable–what you manipulated–goes on the
x-axis)
4.
What is the affect of the tilt angle on the PV system’s voltage and current?
5.
At what tilt angle did the module produce the most power?
6.
What is the relationship between the angle that produced the most power and the angle
of incidence? (Hint: Think geometrically! Draw a diagram if necessary)
Florida Solar Energy Center
Photovoltaic Orientation & Power Output / Page 11
7.
Write a formula below that you could use to determine the optimum array tilt angle
given a specific angle of solar incidence. Use for the array tilt angle and for the
sun’s angle of incidence.
8.
Explain how this optimum tilt angle is related to the time of day, season and latitude of
the location.
Solar Azimuth
9.
Azaimuth is the horizontal measurement of the compass angle that the sun is away from
due south* (solar noon) as it appears to travel across the sky during the day. To
determine this angle, draw a straight line about 8 inches long on a sheet of paper. With a
compass, orient the paper so that the line is running from north to south, and anchor the
paper securely with tape. Place a long rod (or a pencil) with one end on the north/south
line, positioning it straight up vertically (90o). Using a protractor, measure the angle
between your north/south line and the shadow that the rod is casting. This is the current
azimuth angle of the sun. Azimuth angles when the sun is on the east side of solar noon
are considered positive angles; towards the west side have negative angles. Record the
azimuth angle and other information below.
Date
Time
Latitude
Daylight Savings Time?
yes
no
Azimuth angle
* Note: In the southern hemisphere, due north used for solar noon.
10.
In one hour approximately how many degrees azimuth will the sun appear to travel?
(Hint: think geometrically)
11.
How does the change in the azimuth angle during the day affect the power output of your
PV module? One way to determine this would be to take measurements throughout the
day as the sun changed its angle in relation to your panel; but another way, and easier to
do during class time, is to roughly simulate the same effect by rotating the module in
relation to the sun.
•
Use your north/south lined paper from the exercise above and a protractor to set
your module at the azimuth angles in the data table below. The two diagrams
below show an easy way to make sure that your module is at the correct azimuth
angle.
Florida Solar Energy Center
Photovoltaic Orientation & Power Output / Page 12
•
Set your panel at the optimal tilt angle from the previous activity, and keep this
measurement constant throughout this investigation. An easy way to do this is
to make an angle ‘template’ by folding and taping a strip of heavy paper into a
triangle in which the face of the isosceles triangle is the correct angle. (Hint:
Hold the panel at the optimal tilt angle and fold and tape the paper to match it).
This template can then be used to ‘set’ each tilt angle during the investigation.
•
Measure and record the voltage and the amperage for each of the simulated
azimuth angles in the data table below. Use the current azimuth angle as a
simulated ‘solar noon’ then plus (east side) or minus (west side) the given angles.
•
Repeat the test three times to justify your measure and calculate the average
current and voltage readings for each angle. Use these average values to
calculate the power output as you did previously.
Note: Irradiation readings should be as constant as possible throughout this investigation.
If the weather is not perfectly clear, have one team member watch the readings on the
isolation meter and advise if there is a significant change (+/- 50 kW/m 2). All readings
should be taken quickly to minimize the effect of a change in irradiance level.
Simulated
Azimuth
Angles
S
i
m
u
l
a
t
e
d
a.m.
Voltage
Trial
1
Trial
2
Trial
3
Amperage
Average
Trial
1
Trial
2
Trail
3
Average
Power
Output
+90o
+75o
+60o
+45o
+30o
+15o
Azimuth
(simulated
solar noon)
Florida Solar Energy Center
Photovoltaic Orientation & Power Output / Page 13
S
i
m
u
l
a
t
e
d
p.m.
-15o
-30o
-45o
-60o
-75o
-90o
Irradiance
Application and Analysis
12.
Is there a pattern between the simulated azimuth angles and power calculations?
13.
On a separate sheet, graph the change of power output (dependant variable) as a function
of the changing solar azimuth. Include the average irradiance level and indicate that this is
a azimuth ‘simulation’in your title. Label the x-axis with the time that the angle values
represent. (Hint: use your answer from question 10 to help you.)
14.
Which direction should a fixed solar panel face so that it produces the most energy in this
area?
15.
Based on your simulation data, during what time(s) of the day would you expect to see the
greatest power output from your module?
16.
Based on your simulation data, between what hours of the day would you expect to see a
power output of at least 50% of the module’s potential?
17.
Explain the changes in the total energy being produced by the solar module.
18.
Some photovoltaic devices are positioned to produce their maximum power output during
the utilities’ peak load times. Assume that the peak load time for the electric utility in
your area is 4:00 - 6:00 pm, and you want to maximize the power output of your array for
this time range. Predict the direction that you would request installation of your array.
Florida Solar Energy Center
Photovoltaic Orientation & Power Output / Page 14
19.
What factor did our simulation fail to take into account for times of day when the sun is
lower on the horizon? (Hint: consider the affects of the atmosphere) How would you
expect this to affect the power outputs that you observed?
20.
Would you expect more or less energy to be available if the panel were able to ‘track’ the
sun’s path throughout the day?
21.
What are some of the factors that would have to be taken into account when making a
decision on whether to use a fixed or a tracking panel? Compare both energy output and
economic factors.
Seasonal Changes
As you are probably aware, the sun’s path through the sky varies with the seasons. The diagram
below illustrates the seasonal paths of the sun at 28 o north latitude.
Sun paths for 28o N. latitude
As you can see, the solar incidence changes with the seasons at this latitude by as much as 45 o,
which would therefore impact the optimal array tilt angle. Additionally, when the sun is lower on
the horizon (lower angle of incidence) either because of the season or time of day, the solar
Florida Solar Energy Center
Photovoltaic Orientation & Power Output / Page 15
radiation must travel through more of the atmosphere before it strikes the earth. The increased
amount of atmosphere that must be passed through decreases the amount of solar irradiance
because more of the solar energy is reflected, absorbed, refracted and scattered before it reaches
the ground.
Insolation Data
Many sites and labs have been collecting irradiance data since the 1960s. Data tables are
available and used in photovoltaic system design and installation. The raw irradiation data
collected is used to calculate insolation, or Peak Sun Hours, which is the number of hours at
1kW/m2 that the actual total sun conditions equal. Therefore, with this standard it is possible to
compare the amount of sunlight between locations anywhere on the planet, or design an efficient
photovoltaic system for a location without having to personally collect extensive insolation
measurements. Below is data collected from Orlando, FL (latitude 28.55)
Insolation – kWh/m2-day for Orlando, FL
Tilt
Jan
Feb
Mar
Apr
Ma
Jun
July
Aug
Sept
Oct
Nov
Dec
Annual
0o
3.14
3.92
4.99
5.99
6.27
5.78
5.68
5.28
4.72
4.11
3.46
2.92
4.69
15o
3.75
4.43
5.30
6.05
6.10
5.54
5.49
5.24
4.89
4.53
4.06
3.56
4.91
20o
3.92
4.56
5.36
6.01
5.99
5.41
5.37
5.18
4.90
4.63
4.23
3.74
4.94
25o
4.07
4.67
5.39
5.95
5.85
5.26
5.23
5.10
4.89
4.70
4.37
3.90
4.95
30o
4.19
4.75
5.39
5.85
5.67
5.07
5.06
4.99
4.86
4.75
4.49
4.04
4.93
35o
4.29
4.80
5.36
5.72
5.47
4.87
4.87
4.85
4.79
4.77
4.58
4.15
4.88
40o
4.37
4.82
5.31
5.56
5.24
4.63
4.66
4.69
4.71
4.76
4.64
4.24
4.80
Florida Solar Energy Center
Photovoltaic Orientation & Power Output / Page 16
22.
Using the information above, what is the annual horizontal solar insolation (in kWh/m 2day) for Orlando, FL?
23.
Determine the maximum annual insolation that was recorded in Orlando. What month and
what tilt angle was this value recorded at?
24.
Determine the worst month of the year for collecting solar insolation in Orlando. For that
particular month, what tilt angle should be used to collect the maximum amount of solar
energy?
25.
Would you expect the insolation data collected for this year to be exactly the same,
approximately the same, or completely different than the data in the table above? Why?
Summary
When installing or positioning a solar module, it is critical to consider many factors related to the
system’s location, the sun’s position and the sun’s path through the sky. Because of the Earth’s
daily rotation on its axis and the Earth’s revolution around the sun, the solar radiation striking the
surface of a solar module continuously changes. The intensity of solar irradiance and the angle at
which this radiation hits the PV panel determines the amount of electricity it generates. To
optimize the annual energy output, most installations are mounted at 90% of local latitude. For
applications that are designed for a winter peak load the best array tilt angle is latitude plus 15o,
and for a summer peak load the best array tilt angle is latitude minus 15o.
Florida Solar Energy Center
Photovoltaic Orientation & Power Output / Page 17
Understanding Solar Energy
Problems
Photovoltaic Orientation & Power Output
1.
Given an angle of incidence of 75o, what is the optimum array tilt angle at that specific
moment?
2.
At 1:00 pm the solar azimuth is -22o, what will the azimuth be at 4:00 pm?
Using the data sheets below, compare the solar insolation for the three cities: Orlando FL,
Tonopah NV, and Spokane WA. to answer questions 3 - 7.
Solar Radiation for Collectors Facing South At A Fixed Tilt
Insolation – kWh/m2-day – for Orlando, FL (28.55o North Latitude)
Tilt
Jan
Feb
Mar
Apr
Ma
Jun
July
Aug
Sept
Oct
Nov
Dec
Annual
0o
3.14
3.92
4.99
5.99
6.27
5.78
5.68
5.28
4.72
4.11
3.46
2.92
4.69
15o
3.75
4.43
5.30
6.05
6.10
5.54
5.49
5.24
4.89
4.53
4.06
3.56
4.91
20o
3.92
4.56
5.36
6.01
5.99
5.41
5.37
5.18
4.90
4.63
4.23
3.74
4.94
25o
4.07
4.67
5.39
5.95
5.85
5.26
5.23
5.10
4.89
4.70
4.37
3.90
4.95
30o
4.19
4.75
5.39
5.85
5.67
5.07
5.06
4.99
4.86
4.75
4.49
4.04
4.93
35o
4.29
4.80
5.36
5.72
5.47
4.87
4.87
4.85
4.79
4.77
4.58
4.15
4.88
40o
4.37
4.82
5.31
5.56
5.24
4.63
4.66
4.69
4.71
4.76
4.64
4.24
4.80
Insolation – kWh/m2-day – for Tonopah, NV (38.07o North Latitude)
Tilt
Jan
Feb
Mar
Apr
Ma
Jun
July
Aug
Sept
Oct
Nov
Dec
Annual
0o
2.90
4.02
5.61
7.10
8.13
8.80
8.53
7.69
6.44
4.80
3.25
3.61
5.82
25o
4.40
5.38
6.56
7.45
7.91
8.28
8.15
7.81
7.21
6.12
4.75
4.17
6.52
30o
4.63
5.57
6.65
7.41
7.73
8.04
7.94
7.71
7.25
6.29
4.97
4.41
6.55
35o
4.83
5.72
6.69
7.31
7.52
7.76
7.69
7.57
7.24
6.42
5.16
4.63
6.55
40o
5.00
5.84
6.70
7.18
7.27
7.44
7.40
7.38
7.19
6.50
5.31
4.81
6.51
45o
5.14
5.92
6.67
7.01
6.98
7.08
7.07
7.16
7.10
6.55
5.44
4.96
6.43
50o
5.24
5.96
6.60
6.80
6.65
6.70
6.71
6.89
6.97
6.56
5.52
5.08
6.31
Florida Solar Energy Center
Photovoltaic Orientation & Power Output / Page 18
Insolation – kWh/m2-day – for Spokane, WA (47.63o North Latitude)
Tilt
Jan
Feb
Mar
Apr
Ma
Jun
July
Aug
Sept
Oct
Nov
Dec
Annual
0o
0.99
1.91
3.28
4.72
6.05
6.57
7.44
6.13
4.53
2.65
1.25
0.81
3.86
35o
1.84
2.93
4.13
5.10
5.91
6.14
7.12
6.41
5.45
3.84
2.18
1.63
4.40
40o
1.92
3.01
4.16
5.04
5.76
5.95
6.92
6.31
5.46
3.93
2.27
1.71
4.38
45o
1.99
3.08
4.17
4.97
5.59
5.73
6.69
6.18
5.44
3.99
2.34
1.78
4.34
50o
2.05
3.13
4.16
4.86
5.39
5.49
6.42
6.01
5.39
4.03
2.40
1.84
4.27
55o
2.09
3.15
4.12
4.73
5.17
5.22
6.13
5.81
5.31
4.05
2.44
1.89
4.18
60o
2.12
3.16
4.06
4.58
4.92
4.93
5.80
5.59
5.20
4.04
2.46
1.92
4.07
3.
What is the annual horizontal solar insolation (in kWh/m2 - day) for each of the three
cities?
4.
What is the maximum annual insolation and the corresponding tilt angle for each of the
three cities?
5.
For what month of the year can the maximum amount of average daily solar insolation be
collected for each of the three cities? What are these amounts and what are the
corresponding tilt angles?
6.
What is the worst month of the year for collecting solar insolation for each of the three
cities? For the worst month of the year for each city, what tilt angles should be used to
collect the maximum amount of solar energy?
7.
Of the three cities above, does the southern-most city receive the most solar energy during
the summer? during the winter? on an annual basis?
8.
Why do you think this is so?
9.
What are the consequences of tilting a PV array at angles
(a)
lower than the local latitude?
(b)
higher than the local latitude?
10.
What are the consequences of orienting a PV array off-azimuth (solar noon)?
Florida Solar Energy Center
Photovoltaic Orientation & Power Output / Page 19