1
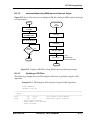
On-Chip Emulation Module
Examples of Using the OnCE
the JTAG TAP into the corresponding state. Section 12 Joint Test Action Group Port on
page 12-1 contains a detailed description of the JTAG protocol.
11.12.1
Checking Whether the Chip Has Entered Debug Mode
There are two methods to verify that the chip has entered debug mode:
• Every time the chip enters debug mode, a pulse is generated on the DE signal. A
pulse is also generated every time the chip acknowledges the execution of an
instruction while in debug mode. An external command controller can connect
the DE line to an interrupt signal in order to sense the acknowledgment.
• An external command controller can poll the JTAG instruction shift register for
the status bits OS[1:0]. When the chip is in debug mode, these bits are set to the
value 11.
Note:
11.12.2
In the following paragraphs, ACK denotes the operation performed by the
command controller to check whether debug mode has been entered (either by
sensing DE or by polling JTAG instruction shift register).
Polling the JTAG Instruction Shift Register
To poll the core status bits in the JTAG instruction shift register, perform the following
steps:
1. Select shift-IR. When you pass through capture-IR, it loads the core status bits into
the instruction shift register.
2. Shift in ENABLE_ONCE. While the new instruction is being shifted in, the
captured status information is shifted-out. Pass through update-IR.
3. Return to run-test/idle.
The external command controller can analyze the information shifted out and detect
whether the chip has entered debug mode.
11.12.3
Saving Pipeline Information
Debugging is accomplished by means of DSP56300 core instructions supplied from the
external command controller. Therefore, the current state of the DSP56300 core pipeline
11-24
DSP56307 User’s Manual
MOTOROLA