1
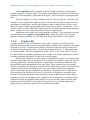
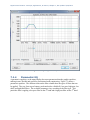
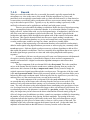
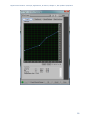
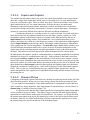
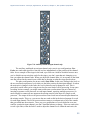
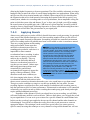
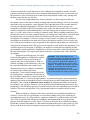
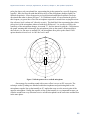
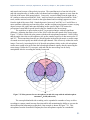
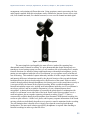
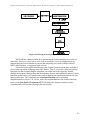
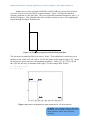
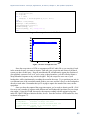
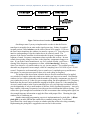
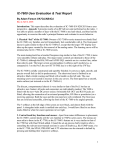
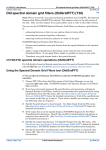
Digital Sound & Music: Concepts, Applications, & Science, Chapter 7, last updated 7/29/2013 Another way to create and apply an IIR filter in MATLAB is by means of the function yulewalk. Let's try a low-pass filter as a simple example. Figure 7.43 shows the idealized frequency response of a low-pass filter. The x-axis represents normalized frequencies, and f_c is the cutoff frequency. This particular filter allows frequencies that are up to ¼ the sampling rate to pass through, but filters out all the rest. Figure 7.43 Frequency response of an ideal low-pass filter The first step in creating this filter is to store its "shape." This information is stored in a pair of parallel vectors, which we'll call f and m. For the four points on the graph in Figure 7.44, f stores the frequencies, and m stores the corresponding magnitudes. That is, and , as illustrated in the figure. For the example filter we have f = [0 0.25 0.25 1]; m = [1 1 0 0]; Figure 7.44 Points corresponding to input parameters in yulewalk function Aside: The yulewalk function in MATLAB is named for the Yule-Walker equations, a set of linear equations used in auto-regression modeling. 62