1
SPM9613 Users Manual
Power Acoustics, Inc. .
PMB302, 12472 Lake Underhill Rd Orlando, FL 32828
Phone: (407) 381-1439, Fax (407) 382-5465
Page
Table of Contents
2
Page Number
1.0 License Agreement
3
2.0 Installation
4
3.0 Technical Parameters
5
3.1
Basis
5
3.2
SPM9613 Features and Extensions
5
3.3
System Requirements
6
3.4
Coordinate System
6
3.5
Basic Equations
7
3.6
Source Definition
7
3.7
Source Directivity
9
3.8
Divergence
10
3.9
Atmospheric Absorption
10
3.10
Ground Effects
11
3.11
Screening
13
3.12
Miscellaneous Attenuation
15
3.13
Reflections
16
3.14
Meteorological Correction (Cmeteo)
17
4.0 Operation Parameters and Guidelines
4.1
Maximum Number of Sources, Barriers etc.
18
4.2
Control Panel
18
4.3
Sound Source Definition Form
22
4.4
Barrier Definition Form
23
4.5
Industrial Sites and Foliage Form
24
4.6
Contour Data Definition Form
25
4.7
User Defined Observer Points Definition Form
26
4.8
Results Form
27
4.9
Example of Project (Samples)
28
5.0 Support Policy and Upgrades
29
6.0 Software Protection Keys (HASP Keys)
29
7.0 Replacement Policy
29
SPM9613 Users Manual
Power Acoustics, Inc.
Page
3
1.0 Commercial User License Agreement
STOP !!!!!! DO NOT OPEN OR INSTALL THIS SOFTWARE
UNTIL YOU HAVE READ THIS LICENSING AGREEMENT
Important. This Agreement sets forth the terms and conditions that enable you to license this Software
from POWER ACOUSTICS, INC. Do not open the envelope containing the CD or diskettes or install the
Software until you have carefully read the following Agreement. Opening or installing the Software
indicates that you have read and understand this Agreement and accept its terms and conditions. If you
do not agree with this Agreement, promptly mail the Software and accompanying items to the place of
purchase within 30 days of purchase for a full refund (less shipping and handling).
License and Restrictions. You are granted a personal, non-exclusive license to use one copy of the
enclosed Software on a single computer and a single terminal. You may make one backup copy of the
Software for your own use. You may not legally make unlimited copies, give copies to another person, or
duplicate the Software by any other means, including electronic transmission. The Software is, in its
entirety, protected by copyright laws. You may not reverse engineer, disassemble, decompile, or
otherwise reduce the Software to any humanly-perceivable form which could reveal algorithms used to
create this Software. Such algorithms contain trade secrets that are the exclusive property of POWER
ACOUSTICS, INC. You may not modify, adapt, translate, or create derivative works based upon the
Software or any part thereof. You may not distribute, sublicense, rent, assign, loan, resell for profit, or
network the Software or related materials.
Limited Warranty. If the CD, diskettes or hardware key (if applicable) are defective, then return the
defective portion to POWER ACOUSTICS, INC. at the address listed within 30 days of purchase, and a
replacement will be mailed to you.
Disclaimer of Warranties. The limitations provided below are the fundamental elements of the licensing
arrangement between you and POWER ACOUSTICS, INC. POWER ACOUSTICS, INC. could not
provide this product economically without such limitations. Except as noted by the Limited Warranty, this
Software is provided "as-is." POWER ACOUSTICS, INC. and/or any of it’s suppliers disclaim all other
warranties, implied or express, regarding the Software, and related materials, including fitness for a
particular purpose or quality. User’s of this Software agree they have the appropriate background in the
field of acoustics and noise control as well as detailed knowledge of the subject matter from which this
Software is based. The user assumes all liability for any use or misuse of this Software.
In any case, the entire liability of POWER ACOUSTICS, INC. for any reason shall be limited to the
amount paid by the customer for the Software purchased from POWER ACOUSTICS, INC. or it’s
authorized suppliers. POWER ACOUSTICS, INC. does not warrant that the Software is free from bugs,
errors, or other program limitations. POWER ACOUSTICS, INC. and its distributors, or suppliers are not
liable for any indirect, incidental, or consequential damages resulting from the use of this Software,
whether based on negligence, breach of contract, breach of warranty, product liability or otherwise, even
if POWER ACOUSTICS, INC. or any of POWER ACOUSTICS, INC.’s representatives or supplier’s have
been advised of the possibility of such damages. POWER ACOUSTICS, INC.'s total liability to you for
actual damages, resulting from any cause whatsoever, will be limited to the amount paid by you for
this Software.
Miscellaneous. This Agreement sets forth POWER ACOUSTICS, INC.'s entire liability and your
exclusive remedy with respect to the Software. You acknowledge that this Agreement is a complete
statement of the agreement between you and POWER ACOUSTICS, INC., and that there are no other
prior representations, promises, or descriptions regarding the Software. Any changes to this Agreement
must be in writing from POWER ACOUSTICS, INC. This Agreement does not limit any rights that
POWER ACOUSTICS, INC. may have under trade secret, copyright, patent or other laws. The employees
and distributors of POWER ACOUSTICS, INC.’s software are not authorized to make modifications to
this Agreement, or to make any additional representations, commitments, or warranties binding on
POWER ACOUSTICS, INC. Accordingly, such additional statements are not binding on POWER
ACOUSTICS, INC. and should not be relied upon. If any provision of this Agreement is invalid or
unenforceable under applicable law, then it is, to that extent, deemed omitted and the remaining
provisions will continue in full force and effect.
SPM9613 Users Manual
Power Acoustics, Inc.
Page
4
2.0 Installation
Installation of SPM9613 is a simple but multi-step process.
1. The SPM9613 software must first be installed on your computer. This is accomplished by inserting
the CDROM into your CD drive and executing the installation software setup.exe. You can either
execute setup.exe though the Windows “Run” mode or by double clicking on the setup.exe file
through your Windows file managing software. It is suggested that the user allow setup.exe to install
SPM9613 in the default directory. Installing to the default directory is necessary to allow the samples
files to work correctly.
Instructions below are applicable to the Commercial Version only. These are NOT
applicable or necessary for successful installation of the Internet DEMO Version.)
1. The drivers for the hardware key must now be installed. Enter the HASPDrvr directory (file folder)
on the CDROM. Find the setup.exe file and execute it by double clicking on it.
2. After successful installation of the drivers. Power down your computer and all equipment attached to
it.
3. Disconnect the printer or other parallel port devices from your computer and attached the HASP
hardware key to your parallel port. Note: The HASP key unlocks the software so that all of
SPM9613’s available features can be used.
4. Reconnect your hardware (printer or other parallel port devices) to the open end of the HASP key.
5. Restart your computer.
SPM9613 is now ready to run.
The SPM9613 demo or commercial versions can be started through the icon in your program manager
or by going to SPM9613.exe and double clicking on it. SPM9613.exe can be found on your hard drive in
C:\SPM9613\SPM9613.exe if you let the setup program install SPM9613 in the default directory.
SPM9613 Users Manual
Power Acoustics, Inc.
Page
5
3.0 Technical Parameters
3.1 Basis
SPM9613 is based on ISO standards 9613 Parts 1 (1993) and 2 (1996). Extensions have been added to
make the program user friendly. Because the standard does not address the details of some issues,
interpretation and judgment have been used. All interpretations used are explained in the user’s manual.
User’s are encouraged to purchase and read the above standards to fully understand the various limitations
of the standards.
ISO 9613-1:1993(E) specifically addresses atmospheric attenuation while ISO 9613-2:1996(E) specifies
an engineering method for calculating environmental noise from a variety of noise sources by prescribing
methods to determine the various attenuation effects observed during outdoor sound propagation. ISO
9613-2 assumes the user wishes to evaluate outdoor noise propagation during meteorological conditions
favorable to sound propagation (downwind propagation with velocities between 1 and 5 m/s when
measured 3 to 11 m above the ground). The standard does not provide a means for evaluating sound
emission under non-favorable conditions but does provide guidance for estimating long term average
sounds levels over a long period of time (a year for example) due to a variety of environmental conditions.
Specifically, ISO 9613-2 provides methods to allow users to address:
Geometrical Divergence of point sources
Atmospheric Absorption - ISO 9613-1
Ground Attenuation (or reinforcement) from soft or hard ground
Attenuation from Screens/Barriers
Miscellaneous Attenuation from industrial sites and foliage
Reflections
Directivity of sources
3.2 SPM9613 Features and Extensions
SPM9613 features and extensions include:
•
•
•
•
•
•
•
•
•
•
•
•
•
Automatic breakdown of large 3 dimensional or line sources into multiple point sources
User ability to limit ground attenuation effects
Octave band center Frequency range from 16 Hz to 8000 Hz
Computation of C-weighted sound levels
Automatic sorting, highest to lowest of spectra on A or C-weighting
Contour plotting of A or C weighted sound levels
Plan views of equipment, barriers, foliage or industrial sites, and observers
Source Sound Power Level Spectrum plots and directivity plots (both vertical and horizontal)
3-D Ground Elevation plots
Ground Hardness contours
Sound Source waterfall plots at each observer location
Multiple screens/barriers
First reflections based on image sources
SPM9613 Users Manual
Power Acoustics, Inc.
Page
6
3.3 System Requirements
The minimum system requirements are:
80486DX or Pentium computer running Windows 3.1, 95, 98 or NT, Microsoft compatible mouse.
8 Megs of RAM (the more RAM, the faster the calculations will be)
20 Megs of hard disk space
CDROM Drive (standard media distribution) , 1.44 Meg Floppy disks are availabe at an extra charge.
Video resolution: 800x600 (with small font video mode) or 1024x768 (with large font video mode).
While SPM9613 can support other graphics modes, they will likely be unacceptable to most users.
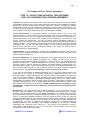
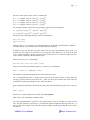
3.4 Coordinate System
The coordinate system is define as follows:
Values of x and y correspond to locations in the horizontal plane. The positive y axis rotates clockwise
into positive x axis. Positive z is above the horizontal plane.
For maximum flexibility, the source
directivity
angles
are
handled
independently of the coordinate system
shown and are tied to the source
coordinates.
See source directivity for further
information.
3.5 Basic Equations
The basic equation used in ISO 9613-2 to define the downwind sound at a receiver is:
Lp(downwind) = Lwpoint + D - A
where
Lwpoint is the point source sound power level, in dB re 1 picowatt
D
is the directivity indices, in dB
A
is the attenuation of various effects defined by:
A
= Adiv + Aatm + Aground + Ascreen + Amisc
Adiv
Aatm
Aground
Ascreen
Amisc
is the attenuation due to geometrical divergence
is the attenuation due to atmospheric absorption
is the attenuation due to the ground effect
is the attenuation due to screening
is the attenuation due to miscellaneous effects (propagation through industrial sites or foliage)
SPM9613 Users Manual
Power Acoustics, Inc.
Page
7
The following defines the details of how each of the above terms are handled in SPM9613.
3.6 Sound Source Definition
ISO 9613-2 requires that all sound sources must be defined as point sources. For large sound sources that
are closer to the receiver than “twice the diameter of the relevant area of sources”, or when the source is
partially blocked by a barrier, the standard says the source must be broken down into several points.
SPM9613 can, at the users discretion, allow the large three dimensional source or line source to be
automatically broken down into 6 or 54 individual point sources. The user can then quickly define the
source without the tedious task and associated interpretation difficulty of results from many points
representing a small portion of the same physical source. Barriers, reflectors and all propagation path
information is treated independently for each of the sub sources.
NOTE: It should be noted that while the 6 or 54 point distributed sources improve the source
representations relative to a single point source, 6 or 54 points may still not be adequate to define receiver
positions close to the source. The user must verify that meeting the minimum distance requirement of the
ISO9613 standard is achieved.
If the minimum distance requirement is not, the user should further
break down sources into smaller sub sources until the minimum distance requirement is satisfied.
The sound sources are defined as follows:
The user selects whether he wants a point source, line source and three dimensional (box) source.
If the user selects a point source or a 3-D source, he will be allowed to enter values corresponding to the
four corners {(x1,y1), (x2,y2), (x3,y3), (x4, y4)} of the physical source and the upper and lower surface
elevations {(Zupper, Zlower)} Note: The corner points must be entered in a clockwise rotation, starting
at (x1,y1) to assure the directivity is treated correctly.
If the point source is selected, a single point will represent the total source and be located at the average
value of points (x1,y1), (x2,y2), (x3,y3), (x4, y4) and the average of the upper and lower elevations. All of
the sound power level will be concentrated at this point.
If the 3-D source is selected, the user has the option of determining which sides, or if all of the 6 sides
should be included in the source representation.
The distribution of points for surface sources is determined as follows:
SPM9613 Users Manual
Power Acoustics, Inc.
Page
8
The areas of each of the vertical “walls” is calculated by:
S(1>2) = i(1>2)(Zupper - Zlower) * [(x2-x1)2 + (y2-y1)2]1/2
S(2>3) = i(2>3)(Zupper - Zlower) * [(x3-x2)2 + (y3-y2)2]1/2
S(3>4) = i(3>4)(Zupper - Zlower) * [(x4-x3)2 + (y4-y3)2]1/2
S(4>1) = i(4>1)(Zupper - Zlower) * [(x1-x4)2 + (y1-y4)2]1/2
For the upper and lower surfaces, the average length of opposite sides is calculated by:
L1 = ½{[(x2-x1)2 + (y2-y1)2]1/2 + [(x4-x3)2 + (y4-y3)2]1/2}
L2 = ½{[(x3-x2)2 + (y3-y2)2]1/2 + [(x1-x4)2 + (y1-y4)2]1/2}
The areas of each of the upper and lower surfaces is calculated by:
S(lower) = i(lower) L1 L2
S(upper) = i(upper) L1 L2
where the values of “i” are either 0 or 1 indicating whether or not the side is included in the calculation.
0 indicates the side is not included, while 1 indicates the side is included.
It should be clear from the above procedure that not all 3-D source representations will be valid. For
example, the source plan view cannot have any crossing lines (lines making an “X” shape in the plan
view). Shapes should have “nearly” 90 degree corners (in the plan view) to assure the upper and lower
surface areas are estimated with reasonable accuracy.
The total 3-D Area S(total) is calculated by:
S(total) =S(1>2) +S(2>3) +S(3>4) +S(4>1) +S(lower) +S(upper)
The power level of the side defined by points x1,y1 and x2,y2 is calculated by:
Lw(1>2) = Lw(total source) + 10Log10(S(1>2) / S(total))
This equation is repeated substituting the area term for the other 5 sides.
For a 6 point distributed source, a single point is placed at the average elevation of each surface and
average xy position of the line in the plan view. If the user elects not to include some of the sides, the
total number of points representing the source will be less than 6.
As an example, the sound power defined at the center point on the side defined by points x1,y1 and x2,y2
is;
Lwpoint = Lw(1>2)
Where Lwpoint is term sound power level term in the basic equation.
Each of the 6 sides is handled in a similar fashion.
For a 54 point approximation, a grid of 9 evenly spaced points (3 rows of 3 columns) are placed on each
side. The grid of points are spaced at 1/6, 1/2 and 5/6 the length or height from the edge of the side. If
the user elects not to include some of the sides, the total number of points representing the source will be
less than 54.
SPM9613 Users Manual
Power Acoustics, Inc.
Page
9
As an example, the sound power defined at each of the nine (9) points on the side defined by points x1,y1
and x2,y2 is;
Lwpoint = Lw(1>2) + 10Log10(1/9)
If the user selects a line source, he will be allowed to enter values corresponding to the line defined by
{(x1,y1), (x2,y2)}, and elevation Zlower.
Either 6 or 54 points (depending on the run time selection) will be evenly spaced along the line. Two of
the points will include the (x1,y1) and (x2,y2) positions. The sound power level of each point on the line
will be:
Lwpoint = Lw(total source) + 10Log10(1/6)
or
Lwpoint = Lw(total source) + 10Log10(1/54)
3.7 Source Directivity
The directivity indices, D, is a frequency and direction dependent term. It is handled by allowing the user
to input indices, in decibels, at 10 degree increments to be added to the sound power level.
The source directivity is tied to the coordinates defining the 3-dimensional shape of the source. Because
the directivity is tied to the source coordinates, the directivity information can only be input for point and
3-dimensional sources. If the user selects a point source or a 3-D source, he will be allowed to enter
values corresponding to the four corners {(x1,y1), (x2,y2), (x3,y3), (x4, y4)} of the physical source and
the upper and lower surface elevations {(Zupper, Zlower)} Note: The corner points must be entered in a
clockwise rotation, starting at (x1,y1) to assure the directivity is treated correctly. See figure on
directivity in the horizontal plane below.
The points defining the line sources are assumed to be omnidirectional. If the line source cannot be
properly represented by a series of omnidirectional points, the user must define individual point sources to
represent the line.
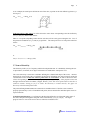
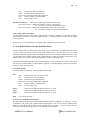
In the horizontal direction, 0° is referenced as the direction defined by an origin point in the center of
the source that passes through the mid point of the side defined by {(x1,y1), (x2,y2)}. The angles
progress from 0° to 360° as the receiver moves clockwise around the source.
SPM9613 Users Manual
Power Acoustics, Inc.
Page 10
In the vertical direction, 0° is referenced as the direction defined by an origin point in the center of the
source that passes through the mid point of the top side of the source. The angles progress from 0° to
180° as the receiver moves toward the ground. At 90°, the receiver is at the same elevation as the center
point of the source.
3.8 Divergence
The Divergence term Adiv is calculated as follows:
Adiv
= 20Log10 ( d ) + 11, dB
where d is the source to observer distance, in meters.
3.9 Atmospheric Absorption
The atmospheric absorption term, Aatm , is highly dependent on distance, relative humidity and
temperature and weakly dependent on pressure. Aatm is calculated using the procedures defined in ISO
9613-1 and will not be discussed in detail here.
The following table illustrates of the level of attenuation, observed at a distance of 1000 meters, 20° C
and 70% humidity.
16
0
31.5
0
63
0.1
Octave Band Center Frequency, Hertz
125
250
500
1000
0.3
1.1
2.8
5.0
SPM9613 Users Manual
2000
9.0
4000
22.9
8000
76.6
Power Acoustics, Inc.
Page 11
The above coefficients (or coefficients as calculated by ISO 9613-1) are multiplied by the actual distance
then divided by 1000 meters to obtain atmospheric attenuation at other distances.
While ISO 9613-1 suggests limiting the individual octave band’s atmospheric attenuation to 15 dB, the
current ISO 9613-2 document does not suggest this limitation. The 15 dB limit is NOT used in
SPM9613.
The following table illustrates of the level of atmospheric attenuation, observed at a distance of 500
meters, 20° C and 70% humidity.
16
0
31.5
0
63
0
Octave Band Center Frequency, Hertz
125
250
500
1000
0.1
0.5
1.4
2.5
2000
4.5
4000
11.5
8000
38.3
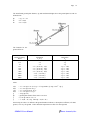
3.10 Ground Effects
The ground effect assumes there is a source, middle and receiver component which are frequency
dependent. The main parameters are the heights above the ground plane for the source, hs, and the
receiver height, hr, a number defining the ground hardness (quasi-absorption coefficient) {Gs, Gm or Gr}
and the ground plane distance dp.
The ISO 9613 standard assumes that the ground has a more-or-less constant slope between the source and
the observer. When the slope between the source and observer is other than zero, the coordinate system
must be transformed to define the projected distance and “apparent height” above the ground plane.
The determination of the transformed projected ground plane distance, dp, and the source and observer
heights above the ground plane are defined as follows:
Three terms along the ground plane are defined:
x'g
x's
x'o
= [(xs - xo)2 + (ys - yo)2 + (zgs - zgo)2]1/2
= h's · sin(θ)
= h'o · sin(θ)
where
xs, ys
zgs
xo, yo
zgo
h's
h'o
the source x and y coordinates
is the ground elevation at the source
the observer x an y coordinates
is the ground elevation at the observer
is the vertical source height above the ground
is the vertical observer height above the ground
sin(θ)
= (zgo - zgs) / x'g
SPM9613 Users Manual
Power Acoustics, Inc.
Page 12
The transformed ground plane distance, dp, and transformed heights above the ground plane hs & hr are
defined below:
dp
hs
ho
= x'g - x's + x'o
= h's · cos(θ)
= h'o · cos(θ)
The formulas for the
ground effect are:
Octave Band
Center Frequency,
Hertz
16
31.5
63
125
250
500
1000
2000
4000
8000
Source or Receiver
Attenuation
As or Ar
-1.5
-1.5
-1.5
-1.5 + {Gs or Gr} · a'(h)
-1.5 + {Gs or Gr} · b'(h)
-1.5 + {Gs or Gr} · c'(h)
-1.5 + {Gs or Gr} · d'(h)
-1.5(1 - {Gs or Gr})
-1.5(1 - {Gs or Gr})
-1.5(1 - {Gs or Gr})
Mid Ground
Attenuation
Am
-3q
-3q
-3q
-3q · (1 - Gm)
-3q · (1 - Gm)
-3q · (1 - Gm)
-3q · (1 - Gm)
-3q · (1 - Gm)
-3q · (1 - Gm)
-3q · (1 - Gm)
where
a'(h)
b'(h)
c'(h)
d'(h)
p'
dp
q
q
= 1.5 + 3.0 exp(-0.12 · (h-5)²) p' + 5.7exp(-0.09h²) [1-exp(-2.8·10-6 · dp² )]
= 1.5 + 8.6 exp(-0.09 · h²) p'
= 1.5 + 14.0 exp(-0.46 · h²) p'
= 1.5 + 5.0 exp(-0.9 · h²) p'
= 1-exp(-dp /50 )
= ground plane distance from source to receiver
= 0, for dp ≤30( hr + hs ) or
= 1 - 30( hr + hs ) / dp, when dp > 30( hr + hs )
Generically, the value G is defined as the ground hardness indicator, or absorption coefficient, 0 for hard
ground, 1 for very soft ground. Values should be input between 0 and 1 for mixed ground.
SPM9613 Users Manual
Power Acoustics, Inc.
Page 13
Specifically,
Gs
Gm
Gr
is the ground hardness at the source
is the ground hardness at the middle ground
is the ground hardness at the receiver
Aground
= As + Am + Ar
When contour points are selected, Gm is determined by finding the mid point between the source and
receiver. The ground value corresponding to the grid point closest to this mid point is the value used in
the calculation.
When user defined observers (individually defined observers) are selected, the mid ground hardness is
input.
ISO 9613-2 provides no guidance on limiting the attenuation of the ground effect. However, “Noise and
Vibration Control Engineering”, by Beranek and Ver, shows the “Practical Limit” to be about 20 dB
relative to hard ground, and a “Conservative Limit” of 10 dB relative to hard ground. SPM9613 allows
the user to select either the practical or conservative limit.
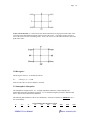
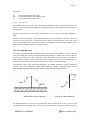
3.11 Screening (Barriers)
Screening is calculated for single or multiple screens. The screens are first checked to see if they intersect
the line connecting the source to receiver paths in the horizontal plane. If the screen is found to intersect
this line, the elevation of the direct path at the screen intersection is calculated based on straight line
(line of sight) propagation. If the screen blocks the line of sight, the observer is in the “shadow zone”, if
the observer can be seen when viewed from the source, the observer is in the bright zone.
Meteorological effects, from downwind propagation, are handled within the screening attenuation
equation. The screen’s attenuation is NOT further reduced by assuming a 5000 meter radius “curved
path” propagation which would presumably double account for the Meteorological effects.
Elevation View of Screen (Barrier)
Plan View of Screen (Barrier)
The horizontal dimension of the screen, perpendicular to the line connecting the source to receiver, must
be greater than one wavelength of the center frequency of interest to be considered a screen as well as the
SPM9613 Users Manual
Power Acoustics, Inc.
Page 14
barrier’s height must be greater than ½ wavelength. The ½ wavelength height limit is necessary to
eliminate attenuation of sources in the “bright zone” from short screens.
ISO 9613-2 warns that for large distances and high barriers, the insertion loss calculated has not been
sufficiently confirmed by measurements.
Single screens include multiple paths for sound propagation. The following propagation paths are
considered; around each of the vertical sides (unless overridden in the barrier definition) and over the top
of the barrier. The path attenuation is summed and the final attenuation determined. The maximum
attenuation allowed by a single screen is 20 dB.
Whether or not propagation around a side can occur is a user input. This is useful when defining multiple
connecting barriers.
Multiple screens assume the attenuation around the barrier is adequate and estimate only the path over
the top of the barrier. All combinations of screens existing between the source and observer are computed
first singularly, then in pairs. When computed in pairs, the barrier combination providing the largest
attenuation is used in the screening attenuation term. To be considered a double screen, the line of sight
must be broken by the second screen of the pair when the observer is viewed from the top of the screen
closest to the source. If the distance between the first screen and second screen is less than one wave
length of the center frequency of interest, the maximum attenuation of that octave band is set to 20 dB. If
the distance between the first screen and second screen is greater than or equal to one wave length, the
maximum attenuation allowed by the double screen is 25 dB.
If one screen is significantly taller than all other screens, all other barriers may be in bright zone when
viewed from the top of the tallest barrier. In this case, the attenuation of the single screen may be used as
the largest attenuation. However, because the single screen is limited to a maximum of 20 dB, SPM9613
will then look for any other pair of screens between the source and receiver that would provide higher
attenuation, up to the maximum double screen limit of 25 dB.
The screening attenuation (Dz ) is calculated with the following equations:
Dz = 10 log10 (3 + (20 / λ) C3 z Kmet ) , in dB
where
λ
z
C3
e'
is the wavelength of the sound
is the difference between the direct and refracted path lengths
= (1 + (5λ/e')²) / ( 1/3 + (5λ/e')²) for multiple screens, or = 1 for single screens
is the distance between the screens in the direction of the source and receiver, accounting for the
distance component parallel with the screen.
Kmet
is the correction factor for meteorological influences, defined as
Kmet
or
Kmet
= exp (-(1/2000) ((dss ⋅ dsr ⋅ d ) / 2z ) 1/2 ) ) for z > 0
dss
dsr
d'ss
d'sr
= 1 for other values of z or lateral diffraction
perpendicular distance from source to plane of screen.
perpendicular distance from plane of screen to receiver.
distance from source to screen in the direction of the source and receiver, accounting for the
distance component parallel with the screen.
distance screen to receiver in the direction of the source and receiver, accounting for the distance
component parallel with the screen.
SPM9613 Users Manual
Power Acoustics, Inc.
Page 15
d
distance source to receiver
z
= d'ss + d'sr + e' - d
The value of z is given a negative value if the observer is in the bright zone of the screen.
In simplistic terms, the Screen Attenuation is defined as the larger of either the Screen Attenuation alone
or the Ground Attenuation. Mathematically, the screening term, Ascreen, is defined as follows:
For top edge attenuation due to the screen:
Ascreen = Dz - Aground
If Ascreen < 0, Ascreen is set equal to 0.
For side edge attenuation due to the screen:
Ascreen = Dz
The Aground term will then cancel when it is added in the basic attenuation equation.
3.12 Miscellaneous Attenuation
For the purposes of this document, miscellaneous attenuation is defined as the attenuation from industrial
sites and foliage. The foliage and industrial site areas are defined with four points, corners {(x1,y1),
(x2,y2), (x3,y3), (x4, y4)}, similar to those used to define the sound sources. The four lines made by
connecting points {(x1,y1), (x2,y2)}, {(x2,y2), (x3,y3)}, {(x3,y3), (x4, y4)}, and {(x4,y4), (x1,y1)}are
first checked to see if any of them intersect the line connecting the source to receiver paths in the
horizontal plane. If the industrial site or foliage area is found to intersect the source to receiver line, the
elevation of the direct path at the area is calculated by taking small steps through the industrial site or
foliage area in the horizontal plane, determining the x, and y coordinates, then calculating the elevation of
the sound ray at that point based on a curved path propagation with a radius equal to 5000 meters. If the
height of the foliage or industrial site is less than that of the curved path elevation no attenuation is
provided. If the height of the foliage or industrial site is greater than that of the curved path elevation, the
distance in the x-y plane through the area is calculated and summed with that from the previous steps
through the area.
The resulting total distance through all of the industrial site areas is defined as di, while the total distance
through all the foliage is defined as df.
The attenuation of the foliage, Af, is defined by multiplying the distance, df, by the following coefficients:
Octave Band Center Frequency, Hertz
31.5
63
125
250
500
1000
2000
16
0
0
0.02
0.03
0.04
0.05
0.06
0.08
If df is > 200 meters, it is limited to 200 meters for the purpose of calculating Af.
4000
0.09
8000
0.12
The attenuation of the industrial sites, Ai, is defined by multiplying the distance, di, by the following
coefficients:
Octave Band Center Frequency, Hertz
16
31.5
63
125
250
500
1000
2000
4000
8000
0
0
0
0.015
0.025
0.025
0.02
0.02
0.015
0.015
Ai is limited to a maximum of 10 dB.
Amisc
= Ai + Af
SPM9613 Users Manual
Power Acoustics, Inc.
Page 16
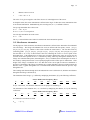
3.13 Reflections
Reflections from vertical surfaces are handled automatically as image sources when they are selected in
the set-up of barriers and in the project runtime file. Only first reflections from any surface are
considered.
The first reflection limitation of SPM9613 was done for the following reasons:
1.
2.
3.
Improved calculation speed. If multiple reflections are to be calculated, it must be accomplished by
incrementing search rays within a grid system. This can cause time concerns since the search rays
need to be quite fine to converge at the receiver.
Most outdoor noise sources are not in highly reflective environments. Usually, if the source or
receiver is located near a building, enclosure or wall, it’s reflection from that surface is the main
concern. These are modeled adequately with the first reflections.
After each reflection, energy is lost and the distance between reflections becomes larger, significantly
reducing the secondary reflections strength.
NOTE: Other important image sources from secondary reflections must be handled independently as
separate noise sources. These must be manually entered by the user. Your failure to include important
secondary reflections as separate manually entered noise sources can result in underestimating the
sound levels.
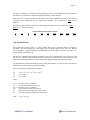
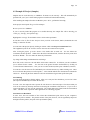
Cylindrical objects are not part of the model nor are reflections from horizontal surfaces. Horizontal
surface reflections can, however, be implemented manually as separate sources defined by the user.
Examples of the reflections considered (and not considered) are shown below:
The reflection is calculated by:
Lwpointimage =Lwpoint + 10Log10(ρ)
where
ρ
is the reflection coefficient = (1 - absorption coeff)
SPM9613 Users Manual
Power Acoustics, Inc.
Page 17
The obstacle is considered large enough to be a reflector when octave band center frequency fc is greater
than the relation shown below:
fc > {2c/(lmincos(β))2}{(ds,o do,r)/(ds,o + do,r)}
where
c
β
ds,o
do,r
lmin
is the speed of sound, in meters per second
is the angle of incidence
is the distance from the source to the obstacle
is the distance from the obstacle to receiver
is the minimum length of the reflecting surface
The calculation follows the following logic. An image source is created from the real source. The point
of intersection with the reflector and the line connecting the image source to observer is found. The sound
is propagated from the real source to the point of intersection on the reflector, accounting for barriers and
other miscellaneous noise attenuation along the way. The sound is then propagated from the point of
reflection to the receiver, again looking for barriers and other miscellaneous noise attenuation. All
attenuation effects follow that of the reflected source to observer path. The directivity used is that in the
direction of the intersection point with the obstacle.
3.14 Meteorological Correction (Cmeteo)
The Meteorological Correction (Cmeteo) is handled by a “calculator” to allow the user to estimate the
long term average A-weighted noise level (LAT(LT)). While not built in to the SPM9613 program as a
feature to be calculated automatically for all observers, it can easily be handled with the calculator
provided in the menu bar in the main project form. The value of Cmeteo can then be applied to the time
averaged downwind A-weighted sound level.
The values of Cmeteo are calculated as follows:
Cmeteo = 0,
for dp ≤10(hs + hr)
Cmeteo = Co(1-10(hs + hr)/dp),
for dp >10(hs + hr)
where hs, and dp are based on the coordinates of the dominant source at the particular observer location.
hs, hr and dp are defined in the Ground Effects section of this document.
The value of Co is based on the percentage of time over a period of several months or a year the sound
may propagate favorably in the direction of an observer. Co can be estimated from the local
meteorological data. If the conditions for sound propagation are found to be favorable 50% of the time, a
value of 3 (dB) would be used for Co. If the conditions are found to be favorable 33% of the time, a value
of 4.8 (dB) would be used. For more information, reference ISO 9613-2
SPM9613 Users Manual
Power Acoustics, Inc.
Page 18
4.0 Operational Parameters and Guidelines
The pages that follow define the operational parameters of SPM9613.
4.1 Maximum Number Of Sources, Barriers Etc.
Sources - 200
Barriers - 200
Industrial Sites And Foliage - 200
Observers (Per Run) - 48
Contour Observers (Per Run) - 121
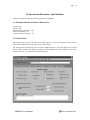
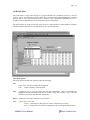
4.2 Control Panel
The control panel is set up to allow the user to define a project. The user can add noise sources, barriers
and reflectors, industrial sites and foliage effects, and observers.
The control panel is broken down into “File Tabs” and Menu Options. The menu options are located on
the top of the screen like other Windows programs, and file tabs allow the user to quickly see the sources,
barriers, observers, etc. that he has included in the project.
SPM9613 Users Manual
Power Acoustics, Inc.
Page 19
4.2.1 Menu Options
The menu options and sub-menu options perform the following:
File/Project
New
Open
Save
SaveAs
Exit
- Starts a new project file or clears the existing project screen.
- Opens a project you have previously saved.
- Saves the project you are working on.
- Saves the project as a different name.
- Terminates the program.
Create
Noise Sources - Enters the Source input form to create new noise sources.
Barriers - Enters the Barrier/Reflector input form to create new barriers or reflectors.
Industrial Sites and Foliage - Enters the Industrial Site/Foliage form to create input data.
Run
Calculate - Begins the calculation (number crunching).
Review Previous Calculation - Reviews the output of your last calculation.
Terminate Program - Terminates the program.
Define Observers
Contour - Enters the input form to create a contour plot information, ranges, elevations, ground
hardness, etc.
User Defined Points - Enters the input form to create individual observer points (x,y,z) etc.
Cmeteo Provides the user with a calculator to estimate long term environmental effects.
View
View will allow the user to see plan views of the following:
Sources and Barriers and Reflectors
Observers, Sources and Barriers and Reflectors, Foliage and Industrial Sites
Contour Points, Sources and Barriers and Reflectors, Foliage and Industrial Sites
The plan view will be representative of files (sources, barriers, etc.) selected in the project as well
as the Runtime Options selected. If barriers and reflectors are shutoff in the Runtime Options,
they will not show up in the plan view representation regardless of whether files are included in
the Barriers and Reflectors Tab. This is also true with the Industrial Sites and Foliage Runtime
Option.
About
Provides information about the company
Help
Provides information on:
Runtime Options
Sound Sources
Barriers and Reflectors
Observers
Industrial Sites and Foliage
SPM9613 Users Manual
Power Acoustics, Inc.
Page 20
4.2.2 File Tabs
The available project File Tabs are as follows:
Runtime Options
Sound Sources
Barriers and Reflectors
Industrial Sites and Foliage
Observers
By selecting a File Tab you will be able to see what options have been selected (Runtime Options Tab) or
what files (source files, barriers, etc.) have been included in the project.
Runtime Options Tab
The Runtime Options include:
Line/3-D Source Options, Observer Type, Barrier and Reflector Options, Ground Effect Limits, Industrial
Sites or Foliage Options, Temperature and Relative Humidity, Sorting Options and Project Description
text.
Line/3-D Source Options - allows the user to select the level of source resolution if the source has been
defined as a line or three dimensional source. The user can select 6 or 54 point representations. For
quicker but less accurate calculations, the 6 point representation should be selected.
Observer Type - determines if a contour calculation will be run from a contour file or individual specific
point observers from a user defined file.
Barrier and Reflection Options - allows the user to turn barrier effects and reflector effects on or off. This
option will override the inclusion of barrier or reflector files.
Ground Effect Limits - sets the limits on the amount of attenuation allowed by the Ground Effect. Limits
are relative to “Hard Ground”.
Industrial Sites and Foliage - allows the user to turn on or off the industrial sites and foliage attenuation
effects. This option will override whether or not industrial site or foliage files have been included in the
project.
Temperature and Relative Humidity - allows the user to set the temperature (in degrees C) and relative
humidity (in percent). This options will effect the calculation of atmospheric absorption and various other
wavelength related phenomena.
Sorting Options - allows the user to sort/rank the source strength output by A-weighted or C-weighted
levels. This option also determines whether an A-weighted or C-weighted contour plot will be displayed
(if the contour option has been selected.)
Project Description - allows the user to add a text description of the project.
Sound Sources Tab
Barriers and Reflectors Tab
Industrial Sites and Foliage Tab
SPM9613 Users Manual
Power Acoustics, Inc.
Page 21
The above Project Tabs have three functions:
1.
2.
3.
Allow the user to view what files are included in the project.
Allow the user to add files previously defined with other projects or other SPM9613 user sessions.
Allow the user to remove files from the project.
A list box will show all of the files currently defined in the project you’ve opened. If the user double
clicks on the file shown in the list, it will open the file and allow the data to be viewed or modified.
A control button, “Add User Defined … To Project” allows the user to place additional files into the
project without creating them through the “Create Menu”. The files may be from previously defined
projects or previous SPM9613 user sessions where the files have not been assigned to a project. The user
can then reuse files he has previously created. A dialog box is displayed that prompts the user to select
the file to be added.
A control button, “Remove … From Project” allows the user to remove a file from the current project.
This can be accomplished by highlighting the file with the mouse, then clicking on the “Remove Button”.
NOTE: While the file will be removed from the project it WILL NOT BE DELETED. It can later be
added back to the project with the Add Button if necessary.
Observers Tab
The above Observer Tabs have two functions:
1.
2.
Allows the user to view what files are included in the project.
Allow the user to add files previously defined with other projects or other SPM9613 user sessions.
A list box will show the contour file or observer file currently defined in the project you’ve opened. If the
user double clicks on the file shown in the list, it will open the file and allow the data to be viewed or
modified.
A control button, “Add User Defined Contour File or Observer File To Project” allows the user to add or
replace the file contour or observer file into the project without creating them through the “Create Menu”.
The files may be from previously defined projects or previous SPM9613 user sessions where the files have
not been assigned to a project. The user can then reuse files he has previously created. A dialog box is
displayed that prompts the user to select the file to be added.
It should be noted that only one contour and one observer file is allowed. If the user asks to add a new file
he will be prompted to replace the existing project file. Replacing the existing project file will remove the
file from the current project but it WILL NOT BE DELETED. It can be added back later by selecting the
“Add User Defined Contour File or Observer File To Project” Control Button.
Whether the Contour file or the Observer file is used in the calculation is determined in the Runtime
Options Tab.
SPM9613 Users Manual
Power Acoustics, Inc.
Page 22
4.3 Sound Source Definition Form
The sound source entry form is set up to allow the user to define a sound source. He can enter this form
by either clicking on the “Create” menu item on the Control Panel or by double clicking on a valid file
shown in the appropriate List Box in the Project Tabs.
The form is broken down into data entry and Menu Options. The menu options are located on the top of
the screen in a similar fashion to other Windows programs. The Menu Options generally provide other
means to view or enter more data.
4.3.1 Menu Options
The menu options and sub-menu options perform the following:
File
New
- Starts a new file or clears the existing screen.
Open - Opens a file you have previously saved.
Save
- Saves the file you are working on.
SaveAs - Saves the file as a different name.
Printer Font - Sets the font data will be printed in.
Print
- Prints a summary of the data input.
Close - Exits the entry form.
Directivity - Selects the form for directivity data entry
In xy Plane - in the xy plane.
Z axis - about the z-axis.
Data are input in 10 degree increments from 0 to 350 degrees, in the xy plane and 0 to 180 degrees about
the z axis. A Directivity sub-menu allows the directivity data to be viewed. Angle references can be
found in the Technical Section.
Sides
- Selects the side of a three dimensional source to be included in the representation of the 3
dimensional source. Six sides can exist on a 3-D sound source (four sides and upper/lower
surfaces). A check mark next to the side will indicate the side is not included. This is useful
when modeling stretches of connecting ducting or single planar surfaces.
Ground - Selects the form for ground elevation and ground hardness data entry.
Help
- Provides on-line help.
View
- Provides a plan view and elevation “bar”.
4.3.2 Sound Source Data Entry
The data indicated on the Sound Source Definition Form are mandatory. It includes: Sound Power Level
information, source coordinates, a source description, and the type of source (line, 3-D, or point).
Other information, such as directivity, side or ground information are not mandatory and will take on
default values. The directivity defaults to omni-directional. The side information defaults to all sides
included. The Ground Elevation and Ground Hardness defaults to an elevation of zero and hard ground
(0).
The x, y and z information is required for four corners for both point sources and 3-D sources. Although
a point source is not 3-dimensional, this information is necessary for “plan view” viewing purposes and
SPM9613 Users Manual
Power Acoustics, Inc.
Page 23
for directivity reference points. If line sources are selected, only the {x1,y1}, {x2,y2} and {zlower} points
will allow data input. Line sources are assumed to be omni-directional. See the Technical Section for
source definition information.
Each of the four corner points must be entered in a clockwise direction for the directivity information to be
handled correctly. x2,y2 must follow x1,y1 as viewed in the plan view as rotating clockwise around the
source. Similarly, x3,y3 must follow x2,y2 as viewed in the plan view as rotating clockwise around the
source, etc.
4.4 Barrier Definition Form
The barrier entry form is set up to allow the user to define a barrier or reflector. He can enter this form by
either clicking on the “Create” menu item on the Control Panel or by double clicking on a valid file shown
in the appropriate List Box in the Project Tabs.
The form is broken down into data entry and Menu Options. The menu options are located on the top of
the screen in a similar fashion to other Windows programs. The Menu Options generally provide other
means to view or enter more data.
4.4.1 Menu Options
The menu options and sub-menu options perform the following:
File
New
- Starts a new file or clears the existing screen.
Open - Opens a file you have previously saved.
Save
- Saves the file you are working on.
SaveAs - Saves the file as a different name.
Printer Font - Sets the font data will be printed in.
Print
- Prints a summary of the data input.
Close - Exits the entry form.
Leakage - Allows the selection of sound “leakage” around a barriers vertical edge. This is useful when
two or more barriers adjoin.
View
- Provides a plan view and elevation “bar”.
Help
- Provides on-line help.
4.4.2 Barrier Data Entry
The data indicated on the Barrier/Reflector Definition Form are mandatory. It includes: coordinates, a
description, barrier or reflector type and reflection coefficients. Reflection coefficients of 1 (fully
reflective) are the default.
Other information, such as leakage, is not mandatory and will take on default values. The default value
for side (edge leakage) is sound is allowed to leak around the barrier’s edge.
SPM9613 Users Manual
Power Acoustics, Inc.
Page 24
4.5 Industrial Sites And Foliage Definition Form
The industrial site and foliage entry form is set up to allow the user to define a attenuation from an
industrial site or foliage. He can enter this form by either clicking on the “Create” menu item on the
Control Panel or by double clicking on a valid file shown in the appropriate List Box in the Project Tabs.
The form is broken down into data entry and Menu Options. The menu options are located on the top of
the screen in a similar fashion to other Windows programs. The Menu Options generally provide other
means to view or enter more data.
4.5.1 Menu Options
The menu options and sub-menu options perform the following:
File
New
- Starts a new file or clears the existing screen.
Open - Opens a file you have previously saved.
Save
- Saves the file you are working on.
SaveAs - Saves the file as a different name.
Printer Font - Sets the font data will be printed in.
Print
- Prints a summary of the data input.
Close - Exits the entry form.
View
- Provides a plan view and elevation “bar”.
Help
- Provides on-line help.
4.5.2 Industrial Site and Foliage Data Entry
The data indicated on the Industrial Site and Foliage Definition Form are mandatory. It includes:
coordinates, a description, Industrial Site or Foliage indicator.
The coordinates defining the industrial sites or foliage can be irregular in shape. However, no lines
defining the industrial site of foliage area must cross when viewed in the plan view.
4.6 Contour Data Definition Form
The contour data entry form is set up to allow the user to define a range of x-y values he wishes to perform
contour calculations on. The program breaks down the grid to an 11x11 map and allows the user to put in
information about the ground elevation and hardness. He can enter this form by either clicking on the
“Define Observers” menu item on the Control Panel or by double clicking on a valid file shown in the
appropriate List Box in the Project Tabs.
The form is broken down into data entry and Menu Options. The menu options are located on the top of
the screen in a similar fashion to other Windows programs. The Menu Options generally provide other
means to view or enter more data.
4.6.1 Menu Options
The menu options and sub-menu options perform the following:
File
Open
- Opens a file you have previously saved.
SPM9613 Users Manual
Power Acoustics, Inc.
Page 25
Save
- Saves the file you are working on.
SaveAs - Saves the file as a different name.
Printer Font - Sets the font data will be printed in.
Print
- Prints a summary of the data input.
Close - Exits the entry form.
Ground Characteristics - Allows user to define the ground type and elevation.
Set Ground Elevation - Defines the elevation on the 11x11 grid points.
View - Provides a 3-D view of the ground elevation
Set Ground Hardness - Defines the ground hardness on the 11x11 grid points.
View - Provides a Contour view of the ground hardness
4.6.2 Contour Data Control Entry
The data indicated on the Contour Data Control Definition Form are mandatory. It includes: minimum
and maximum coordinates of the desired plotting range , a description and an average observer height
above the ground.
Default values for ground hardness are 0 (hard ground), and 0 meters ground elevation.
4.7 User Defined Observer Points Definition Form
The user defined observer locations data entry form is set up to allow the user to define individual x-y and
elevation values he wishes to perform specific point calculations on. The form allows the user to add
information about the ground elevation and hardness at the observer and at the middle ground area. He
can enter this form by either clicking on the “Define Observers” menu item on the Control Panel or by
double clicking on a valid file shown in the appropriate List Box in the Project Tabs.
The form is broken down into data entry and Menu Options. The menu options are located on the top of
the screen in a similar fashion to other Windows programs. The Menu Options generally provide other
means to view or enter more data.
4.7.1 Menu Options
The menu options and sub-menu options perform the following:
File
Open - Opens a file you have previously saved.
Save
- Saves the file you are working on.
SaveAs - Saves the file as a different name.
Printer Font - Sets the font data will be printed in.
Print
- Prints a summary of the data input.
Close - Exits the entry form.
Page 2
Page 3
Page 4
Help
- Allows user to define the specific observers, 13 to 24.
- Allows user to define the specific observers, 25 to 36.
- Allows user to define the specific observers, 37 to 48.
- Provides on-line help.
4.7.2 Observer Form Data Control Entry
The data indicated on the Observer Data Control Definition Form are mandatory. It includes: x, y and z
coordinates of the receiver, the ground elevation and hardness of the receiver and the middle ground
hardness, a description and an average observer height above the ground. The box location near the
observer must be checked for the observer to be included in the calculation.
SPM9613 Users Manual
Power Acoustics, Inc.
Page 26
4.8 Results Form
The results form is set up to allow the user to view the individual noise calculations at each x,y,z observer
location. This is accomplished by clicking on the arrow near the list box and highlighting the coordinate
that you wish to view. The data shown will be sorted by source (maximum to minimum) on A or C
weighted values as determined by the selection on the Project Control Panel.
The menu options are located on the top of the screen in a similar fashion to other Windows programs.
The Menu Options generally provide other means to view or enter more data.
4.8.1 Menu Options
The menu options and sub-menu options perform the following:
File
Printer Font - Sets the font data will be printed in.
Print
- Prints a summary of the data input.
Edit
- Allows the user to copy the output data into other applications. This is accomplished by
highlighting (left mouse button) items the user wishes to copy, then selecting “copy”. The data
can then be pasted into other Windows applications.
Return - Returns the user to the main Project Control Panel.
View
- Allows user to view data.
Contour - Contour plot of data (if project contour calculation was selected)
Sources - Sound Spectra are shown in waterfall plots for the 10 highest ranked sources.
SPM9613 Users Manual
Power Acoustics, Inc.
Page 27
4.8.2 Displayed Results
All octave band sound pressure levels and A-weighted and C-weighted sound levels calculated to be less
than 0 dB are displayed as 0 dB. As an example, a value calculated to be -10 dB will appear on the
display and printout as 0 dB.
The A-weighted and C-weighted sound levels, however, are calculated prior to the octave band sound
pressure levels being set to the display limit of 0 dB.
4.8.3 Contour Plots
Within the Contour Plot, the user can print the plot, view and transport the data that made up the plot into
other applications.
Selecting the data menu option will provide a listing of the data used to develop the plot. It can be
highlighted using the mouse and copied on to the clipboard by either using the edit menu option or by
right clicking on the mouse and selecting the appropriate item.
SPM9613 Users Manual
Power Acoustics, Inc.
Page 28
4.9 Example Of Project (Samples)
Samples must be in the directory “C:\SPM9613 for them to work correctly. This will automatically be
performed for you if you’ve allowed the program to install itself in the default directory.
After installing the samples from the CD-ROM to your C: drive, perform the following:
In the project control panel file, go to File and Open.
Be sure you are in C:\SPM9613.
If you’ve correctly loaded the program to it’s default directory, the sample files will be showing you
“econ1.prj”, “line.prj”, and “pointe33.prj”.
Highlight the econ1.prj file and double click or click on the open button.
It will show a list of files for the “Project” when you click on the Source, Barrier, Industrial Site and
Foliage, or Observer file tabs.
You can look at the project input by clicking on “View” while in the Project Control Panel form.
The equipment layout can be viewed as well as observers and contour observer points.
After viewing the project, go to the “Source” Tab, double click on stack exit. You can “View” the
coordinates and the spectrum. While still in the Source Definition form, click the directivity menu item
and select “Z-axis”. You can “view” the directivity information.
Try doing similar things with the Barriers and Foliage.
Now click on the “observers” tab and double click on the contour File. It will show you the coordinates
you’ve defined for the contour. You can look at the ground elevation and hardness by clicking on
“Contour Ground Characteristics”. Now you can view the elevation (surface plot) or hardness (Contour).
You can also view the observers file (individually user selected observers) by double clicking on it. These
are user selected data points (not contour points.) A check mark indicates the calculation will include the
“Observer”. Removing the check mark will cause the calculation to bypass that specific data point.
4.9.1 Running
You can run the program by clicking on Run. After you’ve run your first calculation, you can view it later
(the output is automatically saved from the last run) .
You can “view” the composite source spectra for each observer or the contour plot. The observer that you
view can be selected by the drop down list box showing the coordinates of the observer. If you’ve run a
contour calculation, you can view the contour plot. The contour data can be found in the file item marked
“data”. The data can be copied into other applications or contouring programs.
4.9.2 Plot Screen Resolution
In some cases, the text resolution of the various three dimensional plots shown on your computer’s
monitor may not be readable. The printed versions of the plots, however, will be significantly improved.
On high resolution printers, the plots will be presentation quality.
SPM9613 Users Manual
Power Acoustics, Inc.
Page 29
5.0 Support Policy and Upgrades
To provide SPM9613 on a cost effective basis, free support is limited to 30 minutes for each licensed copy.
This should adequately allow you to get the program operational on your PC.
Additional support will be billed at the consultant’s standard hourly rate.
Bugs found by the user that are well documented with hand calculations and/or systematic running of the
program will be supported free of charge and corrected at the soonest possible time.
User’s of SPM9613 Version 1 are entitled to free upgrades to Version 1 from the internet site. Details of
downloading upgrades will be provided upon purchase of software.
6.0 Software Protection Keys (HASP keys)
Runtime operation of SPM9613 is protected by a hardware key. Without the key attached to your
computer’s parallel port, the program will go into a demo mode. The demo mode does not allow the user
to save noise source files and limits the number of days SPM9613 can be used or number of runs to 30.
A hardware driver must be installed to allow the HASP key to be recognized by your computer. If you
have not loaded the driver, enter the HASPDrvr directory (file folder) on the SPM9613 CDROM. Find
the setup.exe file and execute it by double clicking on it.
Provided the SPM9613 CDROM version (not the internet version) has been loaded on your computer,
installing the HASP key along with the necessary driver (software) will eliminate any access problems and
provide full functionality of the SPM9613 program.
7.0 Replacement Policy
HASP Keys
Protect Your Key!!!!!! It is valuable.
Damaged or inoperable HASP hardware keys must be returned to Power Acoustics, Inc. for
replacement.
You must call Power Acoustics, Inc. before returning keys. Lost or stolen keys or keys not received by
Power Acoustics, Inc. in return shipment can be replaced at the full purchase price.
Keys returned within 30 days of purchase, will be replaced free of charge.
Lost or stolen keys can be replaced at the full purchase price.
CDROM
Damaged or inoperable CDROMs will be replaced for free within 30 days of purchase.
responsibility to make a backup copy for your own use.
SPM9613 Users Manual
It is your
Power Acoustics, Inc.