1
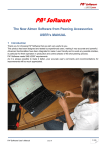
Targeted Risk Assessment
User Guide for the integrated tool TRAM
Version 3 update to version 3.1
June 2014
EUROPEAN CENTRE FOR ECOTOXICOLOGY AND TOXICOLOGY OF CHEMICALS
www.ecetoc.org
User Guide for the TRA integrated tool – TRAM, version 3.1
Contents
1.
Introduction
1
Manual and Batch Mode
1
Data Entry
1
Standard and Refined Assessments
1
Working in EXCEL 2007
1
2. Starting / Exiting the Application
2
2.1 Starting
2
2.2 Exit the ECETOC TRA integrated tool
3
3. User Interface
4
3.1 Overview
4
3.2 Part I - General Workflow, Retrieval and Storage from and to the Datasheets, and Batch Processing 4
Colour Codes for Input Fields
5
Indicator: Manual or Batch Mode
5
Entering Data into the User Interface for Manual Mode Assessment
5
Run: Single Substance Assessment from User Interface in Manual Mode
6
Save: Store Single Substance Assessment Data from User Interface to Datasheets
6
Read: Retrieve Assessment Data from Datasheets into User Interface from Manual Run
6
Clear: Delete Entries of Single Substance from User Interface
6
Batch Mode
6
Standard vs Advanced
7
3.3 Part II - Identification of substance
7
3.4 Part III - General physico-chemical data entry
7
3.5 Part IV - Data Entry - Worker Assessment
8
3.6 Part V - Data Entry - Consumer Assessment
9
Working with existing categories and sub-categories
Creating New Sub-Categories
3.7 Part VI - Data Entry for Environmental Assessment
Amounts Used
4. Output of Results in the User Interface
9
11
14
15
19
4.1 Output of the Worker Exposure and Risk
19
4.2 Output of the Consumer Exposure and Risk
20
User Guide for the TRA integrated tool – TRAM, version 3.1
4.3 Output of the Environmental Exposure, Risk and Safe Amount for Handling (MSAFE)
5. Datasheets
21
23
5.1 Datasheets – Entering Input for Standard Assessments
23
5.2 Datasheets – Entering Input for Advanced Assessments
25
Emission Assessment via Datasheet
25
Refining Environmental Assessments beyond SPERCs
26
Refined Physical-Chemical and Degradation Data
28
PNEC Derivation analogous to EUSES
28
5.3 Output within the Datasheets
29
Interim Results of the Environmental Emission Assessment
30
Scaling Parameters for Environmental Scenarios Assessed
31
6. Practical Considerations for Users
33
Microsoft Windows clipboard
33
CPU and RAM of your PC
33
Country settings of your windows system
33
TIER II data
33
PNEC derivation
33
Running “batch” mode for a single substance
33
Differences between the consumers standalone version and the integrated version
34
User Guide for the TRA integrated tool – TRAM, version 3.1
1. INTRODUCTION
This User Guide is to help the reader in operating the ECETOC TRA v3.1 integrated tool. This User Guide does
not provide guidance on the technical basis for the TRA. For that the reader is referred to the ECETOC
Technical Reports 107 and 114, together with the Addendum to 114, Technical Report 124. The ECETOC TRA
v3.1 uses colour codes to mark the differences between data fields. For that reason it is recommended to
obtain a multicolour print of this user guide.
Subsequent to the 2010 REACH registration the ECETOC TRA v2 was developed to account for exposure
assessments needing to be refined based on the scientific basis described in the ECETOC Technical Report
107 and 114 (TR 107 and TR 114). ECETOC TRA v3 which implements many of the refinement options
outlined in TR 107. The introduction of v3.1 of the TRA enables the exposures and risks associated with the
infrequent consumer uses of substances to be better the addressed. The ECETOC TRA integrated tool offers
the exposure and risk assessment for workers, consumers and the environment in one single tool, the socalled ‘integrated’ tool or ECETOC TRAM. In addition, the consumer assessment tool is available as a
standalone version.
Manual and Batch Mode
The ECETOC TRAM can be operated in a manual and a batch mode. In the manual mode, assessments are
performed and saved one-by-one. In the manual mode, one substance can be assessed with fifteen
scenarios in one single run. The batch mode allows for serial assessments. Both modes are administered via
the datasheet ‘Interface’.
Data Entry
Data entry can occur via the Interface or via the datasheets of the ECETOC TRAM. Assessments in the batch
mode require that data are entered into the datasheets prior to the assessment. In the batch mode up to 60
scenarios can be assessed per substance. In addition to the serial assessments, the batch mode allows for
enhanced reporting or results and supports advanced environmental assessments. Alternatively, data
entered in the ‘Interface’ may be stored to the datasheets (see chapter 3.2).
Standard and Refined Assessments
Standard assessments can be performed in the manual and the batch mode. Advanced assessments
available in the manual mode include all refinements of worker assessments; generating customised
subcategories for consumer assessments; and the use of specific Environmental Release Categories (SPERCs)
for environmental assessments. These options are also available via the batch mode. In addition, the batch
mode exclusively offers the possibility to enter data to refine the environmental fate modelling (partition
coefficients between water and various sub-compartments, and degradation rate constants), to derive
PNECs following the R16 Technical Guidance, and to generate customised emission assessments.
Working in EXCEL 2007
The ECETOC TRA has been developed in the 2003 version of EXCEL. So far, it was found that operating the
integrated ECETOC TRA from the 2007 version of EXCEL differs from the 2003 version for a small number of
operations. This is due to the altered structure of the menu setup of these higher versions of EXCEL. Some of
the changes will be addressed in Chapter 2.1, 2.2 of this user guide.
Page 1
User Guide for the TRA integrated tool – TRAM, version 3.1
2. STARTING / EXITING THE APPLICATION
2.1 Starting
To start the integrated TRA, extract the file “Integrated tool v3,1.zip” into one single folder using WinZip or
any other program capable of extracting .zip-files. The folder will then look as displayed in Figure 1. To run the
application, double click on the file “ecetocTRAM.xls”. The tool will then start. Enable macros when asked in
message box and allow for linking to the remaining eight files. They will then open automatically.
Figure 1: Extracted TRA folder.
Extract the Integrated tool v3,1.zip into one folder and double-click on ecetocTRAM.xls to start the
application. Enable macros when asked in message box. The remaining files will open automatically.
Users of EXCEL 2007 are recommended to manually check all 9 files opened and to enable before
entering data into the ecetocTRAM Interface spreadsheet.
Users of EXCEL 2007 and 2010 have to enable the macros in the ECETOC TRAM as shown below.
Page 2
User Guide for the TRA integrated tool – TRAM, version 3.1
2.2 Exit the ECETOC TRA integrated tool
To save and leave the ECETOC TRA integrated tool and close all 9 files press Ctrl+e while the ecetocTRAM.xls is
active. Alternatively, the button “ecetocTRAM” in the Excel command line may be used while the
ecetocTRAM.xls is active which offers “Save and exit”.
To leave the ECETOC TRA integrated tool and close all 9 files WITHOUT saving data, press Ctrl+t while the
ecetocTRAM.xls is active.
Example for Excel 2003:
For Excel 2007/2010, the “Safe and exit” can be accessed via “Add-ins”:
Page 3
User Guide for the TRA integrated tool – TRAM, version 3.1
3. USER INTERFACE
3.1 Overview
The user interface allows for the exposure and risk assessment of a single substance in several uses for
worker, consumer and the environment (maximum 15 scenarios each). The environmental assessment is
limited to ERC- and SpERC-based exposure estimates (TIER II estimates are possible via the datasheets and
using the batch mode exclusively).
The user interface is structured in the following way:
I.
General workflow and assessment management, i.e. options for running assessments from the User
Interface (manual mode), clearing entries from Interface, retrieval from and storage to the datasheets
and batch processing of datasets in the datasheets
NEW features in version 3.1: export and import of data sets for single substances from/into
datasheets
II.
Identification of substance
III.
General physico-chemical data entry
IV.
Data entry for worker assessment
V.
Data entry for consumer assessment
VI.
Data entry for environmental assessment
3.2 Part I - General Workflow, Retrieval and Storage from and to the Datasheets, and
Batch Processing
Part I (Figure 2) gives a short overview of the general workflow for an assessment. A substance from the
datasheets can be read into the user interface (“Read” button in cell E 21) or the entered data can be stored
into the datasheets (“Save” button in cell E 24). The “Clear” button in cell “I 21” allows for clearing all input
and output fields in the user interface. The user can select to run a manual assessment of one substance
(“Run” button in cell E 22 or to run a batch process. For batch processes, all assessments for human health
(worker and consumer) and environment can be performed using the “Run batch” button (in cell E 26) to
calculate the exposure and risk for several substances as entered into the datasheets). Alternatively,
assessments for human health or environment can be run separately by using the “Run batch – Human
health” or “Run batch – Environment” button (both in cell E27). This may reflect the work process in
companies or just speeds up the batch run if e.g. refinement of only one part is required.
New features included in version 3.1 are the options to export and import data sets for single substances
from/into datasheets.
To export the parameters for a substance, select the substance from the drop-down list in cell I24 (this is
equivalent to the list in the “Contents” sheet) and click on the macro “Export substance” to the right (cell
J24/25). Click on “Delete” when prompted. The toll has now created an Excel file (Book <x>) with one sheet
named “Import” containing the data (substance data and assessment parameters only – no results) of the
selected substance in the structure of the TRAM datasheets. This can be saved under a name of your choice
and used for sharing. This is also the file structure required for the import function (NOTE: do not re-name
Page 4
User Guide for the TRA integrated tool – TRAM, version 3.1
the sheet “Import” as this is needed for the import function).
To import substance data (from suitable files), click on the macro “Import substance” (cell I22/23), select the
Excel source file to import the data (browse directories as usual, if needed) and click “Open”. Click
“Continue” when prompted and “No” in next Window popping up. The TRAM identifies the first available
area/substance in the Datasheets for saving the substance information imported by checking for the
substance name to be “empty” in the datasheets row 8, columns C, BL, etc. (compare “Safe” function further
down in this chapter).
Figure 2: Overview of Part I of the user interface.
Yellow fields are data entry fields at the top of Part I. The new export/import features are placed on the
right side of the UserInterface sheet.
Colour Codes for Input Fields
Input fields are marked with specific colours as indicated in cells H17 and H18. Yellow cells represent
mandatory inputs, blue cells represent optional inputs. However in some cases (e.g. D44 – D48, partition
coefficients) at least one of the blue fields needs to be filled. In addition, there are grey fields which do not
accept input (or do not use any input that maybe made).
Indicator: Manual or Batch Mode
Cell D18 indicates whether one operates in manual (“m”) or batch mode (“b”). This is not an entry field, but
automatically set by the TRAM if an assessment of one substance is run from the user interface (“Run”
button in cell E22) or a batch process is used (“Run batch” buttons in cell E26 or E27).
Entering Data into the User Interface for Manual Mode Assessment
How to enter the relevant data into the user interface for a manual calculation or for saving them to the
datasheets is explained further down for Parts II – VI. The ”Clear” button can be used to clear any existing
Page 5
User Guide for the TRA integrated tool – TRAM, version 3.1
entries in the user interface in order to avoid confusion.
Run: Single Substance Assessment from User Interface in Manual Mode
To run the entered scenarios for the selected substance in the user interface, one simply needs to click on
the “Run” button in cell E 22. All input data in the user interface are then transferred to the respective
calculation tools (consumer, worker, and environment) and are processed. Afterwards the results are
written back into the user interface into the results cells next to the input cells of each scenario (scroll right
in each scenario line in the “Interface” to view results).
Save: Store Single Substance Assessment Data from User Interface to Datasheets
To save a substance just entered into the “Interface” into the “datasheets” click on “Save” (cell E24). All data
visible in the user interface are then transferred into one of the datasheets (datasheet1-datasheets20) at the
position indicated in cell D24. Datasheet1 contains substances 1 to 4, datasheet2 contains substances 5-8,
and so on.
Practical note: The TRAM identifies the first available area/substance in the Datasheets for saving the
substance information entered in the user interface by checking for the substance name to be “empty” in
the datasheets row 8, columns C, BL, etc. You may use a substance number that had been populated before
in the Datasheet by entering “empty” as the substance name. Check whether the TRAM has identified the
substance number in D24 of the Interface and you can save the dataset from the Interface to this substance
in the Datasheet.
Read: Retrieve Assessment Data from Datasheets into User Interface from Manual Run
In manual mode, one can read a substance with its scenarios from the datasheets by selecting a substance
from the drop-down menu in cell D21 and then clicking on “Read” in cell E21. The data entered into the
datasheets for this substance are then transferred to the interface.
Practical note: Only the first 15 worker and consumer scenarios will be read into the user interface
(limitation of the user interface) and only ERC and SpERC inputs for environmental assessments will be
transferred (no TIER II assessments). ERC and SpERC assessments will be assigned in G114-G128 in the
Interface, but any TIER II assessments will be blank as they cannot be operated from the Interface. Please
note that also the specification of the environmental assessment needs to be re-entered in column G
because TIER II selection cannot be reflected in the INTERFACE.
Clear: Delete Entries of Single Substance from User Interface
To clear all entries of a substance in the “Interface” click on “Clear” (cell I21). All data visible in the user
interface are then removed. The cells G114-G128 set to the default assessment (ERC) and the type of
reference value per default set to PNEC or DNEL (for environment only).
Practical note: The combination of the “Clear” and “Safe” function can be used to remove datasets from
Datasheets to create a blank sheet for new entries.
Batch Mode
When processing data in the batch mode, one needs to enter the starting substance number into cell I26 and
the last substance to be processed into cell K26 of the interface. The substance number is the number under
Page 6
User Guide for the TRA integrated tool – TRAM, version 3.1
which a substance is stored in the datasheets. The sheet “contents” gives an overview which substances are
stored in the data base and where.
By clicking “Run batch” in cell E26, the tool starts to calculate all scenarios entered into the datasheets for
the selected substances. Alternatively, assessments for human health or environment can be run separately
by using the “Run batch – Human health” or “Run batch – Environment” (in cell E27).
Standard vs Advanced
Cell I27 allows the user to select “Standard” or “Advanced” form of the Batch mode. This only applies to
environmental assessments. Using the advanced mode, more detailed results for the environmental
assessment will be shown (e.g. PECregional) - compare output list on datasheets line 517 and below. It is also
required to derive PNEC by the model based on ecotoxicological data inputs in the datasheets (line 188).
Practical note: A single substance can be run by entering the substance number in both cell I26 and K26. The
results of the batch mode runs will be displayed in the respective area of the datasheet from row 444
onwards (assessed scenarios by column). Selective assessment of e.g. substance 1, 5, 9, etc. in batch mode is
not possible.
3.3 Part II - Identification of substance
Part II (Figure 3) asks the user to enter required data for the identification of the substance to be assessed,
like substance name and CAS number.
Figure 3: Part II. Identification of substance.
Cell D30 (SUBSTANCE) is a mandatory input. Here, enter the substance name under which the substance
will be saved in the datasheets. The name needs to be unique. Cell D32 is for entering the CAS-No. of the
substance. This field is also mandatory. All other cells in this section are optional entries: general name of
the substance, CAS-No., EC-No., identification of use, assessment identifier, assessment date and
comments. PCs, PROCs, ACs are entered in the respective human health parts further down, because
they directly determine the assessed scenarios.
3.4 Part III - General physico-chemical data entry
Part III (Figure 4) is the screen for entering general physico-chemical data of the substance to be assessed.
Page 7
User Guide for the TRA integrated tool – TRAM, version 3.1
Some data need to be entered as numbers (e.g. molecular weight, vapour pressure), some others need to be
selected from a drop-down menu, like physical form. The fields displayed in blue are optional entries, but at
least one of the optional fields needs to be filled in. Some fields (Partition coefficient octanol-water and Koc)
offer the selection of entering either the value for Kow (cell D42) and Koc (D45) or their log units, which has
to be specified by the user in cells E42 and E45 respectively. Also for the vapour pressure (cell D40) the user
can select to enter the value in Pa or hPa (cell E40).
Figure 4: Part III. General physico-chemical data.
Lines 39 to 48 cover the entries of substance specific data which are of general relevance for the
exposure assessment. Most fields require the entry of a number. These fields are: molecular weight,
vapour pressure, water solubility and the relevant partition coefficients. Some fields require an input by
selection of one option of the drop-down menus. These fields are: Biodegradability test result, Chemical
class for KOC QSAR and Physical form. Special fields are Kow, Koc and Vapour pressure: besides entering
a value, the type of value needs to be selected from a drop-down menu (Kow or logKow, Koc or logKOC,
Pa or hPa). The fields displayed in blue are optional inputs, however one of the options must be used,
either a chemical class forKoc-QSAR has to be selected or at least one partition coefficient has to be
entered.
Column K indicates where the parameters are used and comments e.g. on the source of the data can be
recorded in column L.
Cell G50 (Input for additional PC data) states that additional PC data (e.g. various solid-water partition
coefficients, rate constants for various degradation reactions) can be entered, if a refinement for some
reasons will be necessary. Those additional data cannot be entered via the user interface. They have to be
entered directly into the datasheets in lines 164-181.
3.5 Part IV - Data Entry - Worker Assessment
Part IV (Figure 5) shows the entry fields for worker exposure and risk assessment. Fifteen different uses can
be entered here (lines 55 to 69), each with its own combination of PROC (D55-D69), operating conditions
and exposure modifying factors. The glossary for PROCs can be found in line 72 or in the ECHA guidance R12.
The entries to all fields, except the optional scenario name (B55-B69), which is a free text field, need to be
done via a selection from drop-down menus (except a numerical value for vapour pressure in case of an
Page 8
User Guide for the TRA integrated tool – TRAM, version 3.1
assessment for volatile substances at elevated process temperature in column G). Further down in this
section there is an option to enter indicative reference values (D76 or H76 and D77), which can be DNELs or
any other reference value. TRA version 3 includes also reference values for short-term inhalation and longterm dermal local exposure (H78 and D79). In column “Basis of reference value” (F76-F79) it should be stated
which reference value is entered (e.g. DNEL, OEL, etc.). For more details on the single parameters please
refer to the ECETOC Technical Reports (TR) 93 and 107 and 114.
Figure 5: Part IV. Worker exposure entry fields.
Lines 55 to 69 represent the input and output cells of the worker exposure and risk scenarios. In each
line, one PROC can be selected from a drop down menu. A descriptive text can be assigned as a scenario
name. Under “type of setting” the user needs to select whether the task is operated within a professional
or an industrial setting. Whether the physical form during the process is solid or not can selected from a
drop-down menu, also the dustiness in case it is a solid and the vapour pressure at operating
temperature in case it is not a solid. The duration of activity, the use of local exhaust or/and general
building ventilation (or if the operation takes place outdoors), the use of respiratory and dermal
protection including efficiency and if the substance is used in a preparation (including percentage can be
addressed via drop-downs. In column M, the assessor can set the assessment to consider the effect of
local exhaust ventilation on dermal exposure.
Lines 76 to 79 represent entry fields for reference values, against which the calculated exposure will be
compared. This can be DNELs or OELs or other reference value (preferably mg*m-3 for inhalation
exposure, mg-1* kg-1*d-1 for (systemic) dermal exposure and µg * cm-2 for local dermal exposure). The
type of value may be specified in the field “basis for reference value”.
Practical note: TRAM version 3 offers the option to do a first estimate for short-term inhalation exposure
and the related short-term DNEL inhalation can be entered here as well. Same applies to a long-term local
dermal exposure assessment.
3.6 Part V - Data Entry - Consumer Assessment
Working with existing categories and sub-categories
Part V (Figure 6-1) covers the entries which specifically relate to consumer exposure and risk assessment. Up
Page 9
User Guide for the TRA integrated tool – TRAM, version 3.1
to fifteen different scenarios can be entered into the drop-down menu fields and free-text fields (lines 8397). The scenario name (B83-B97) can again be entered as free text. Cells D83-D97 are used for the selection
of PCs or ACs from a drop-down list. This drop-down list is structured to start with PCs and then ACs that are
covered by the TRA with default values and allow TIER I assessments for sentinel products or articles or
specific sub-categories, if selected. The glossary for PCs and ACs can be found in lines 100 and 101 or in the
ECHA guidance R12.
Further down in the drop-down list, all other PCs and ACs are available for the creation of new subcategories
(see below for more information on new sub-categories).
In E83-E97 one can optionally select a product or article subcategory for refinement. The drop-downs allow
the selection of subcategories depending on the PC or AC selected in column D of the same row. For more
details on the subcategories please refer to ECETOC Technical Report 93, 107, 114, together with the
Addendum to 114, Technical Report 124. In column F it may be selectable if the product is a spray. However
there are some categories which can never be a spray or are always a spray. The drop-down is therefore only
active to select “yes” or “no” where applicable. For more details on this topic see the consumer tool
guidance and the report.
The remaining input cells in this section (“amount of product used per application”, product ingredient
fraction by weight”, “skin surface area dermal and oral” are optional inputs. If nothing is specified here,
default values will be used. For more details on the scientific issues and the meaning of the input fields and
default values, please refer to the ECETOC Technical Report 93, 107 and the amendment to TR 107 (in
preparation)..
Further down in this section (cells D105-D107) there is an option to enter indicative reference values, which
can be DNELs or any other reference value. In column “Basis of reference value” (F105-F107) it can be stated
which reference value is entered (e.g. DNEL, OEL, …). A special feature here is in cells D105 and H105, where
the inhalation reference value can be specified in different dimensions (either mg* m-3 or mg*kg-1*d-1).
Page 10
User Guide for the TRA integrated tool – TRAM, version 3.1
Figure 6-1: Overview of the consumer input cells in the “Interface” sheet.
Each row represents one (contributing) consumer scenario. Scenario names can be entered in column B,
PC and AC categories and their related sub-categories in column D and E, respectively. Further
parameters are in columns F-L. Glossary for PCs and AC are in lines 100 and 102 (just for reference – no
model inputs here!). Reference values (e.g. DNELs for consumers can be entered in rows 105-107.For
new subcategories: Navigation button in cell D98. Row 92 shoes an example of a new sub-category
selected for assessment with the entry cells for model parameters labeled to prevent user from entering
data here. Column C also provides the information that data need to be edited in the sub-module
(navigate via button in cell D98).
Practical note: Reference values for consumers entered in this section are used in the environmental
assessment to compare with oral and inhalation exposure of man via the environment.
Creating New Sub-Categories
Working with new sub-categories
Columns D and E are set up to select new subcategories defined by the user and calculate the results in the
assessment as for the existing TRA sub-categories (i.e. one or more of the rows in the user interface maybe a
new subcategories while other are existing ones.). It is the intention that information available from the
activity coordinated by DUCC (DUCC SCED Guidance) and intended to generate Specific Consumer Exposure
Determinants (SCEDs) for common uses of consumer products is referred to at this stage. Before they can be
used in the assessment by simple selection in columns D and E, they need to be created and populated by
the user. To do this, click on the button “Create or edit new subcategory” in cell D98 (See Figure 6-1) and a
macro will take the user to respective work area in the consumer sub-module (sheet “Add Subcategories”).
In the sheet “Add Subcategories”, a second macro can be activated by clicking on the button “CLICK TO ADD
ROWS” next to cell B2 (Figure 6-2). The user will be asked how many rows (i.e. new sub-categories) shall be
added. Please note that rows cannot be removed any more once they have been added.
Once the model parameters have been entered (see paragraph below), the new sun-category/ies need to be
added to the drop-down for selection in the TRA by pushing the button “Finish new subcategories” (next to
cell D2). The user will be taken back to the “ecetocTRAM” master file and can run the assessments for both
existing and new sub-categories from the “Interface” (and in batch mode from the “datasheets” – see
Page 11
User Guide for the TRA integrated tool – TRAM, version 3.1
section on batch mode below).
Practical note: Please note that the entry fields for model parameters in the TRA; (“Interface” and
“datasheets”) will be displayed in different format and the user will receive a respective warning message if
a new sub-category was selected in order to advise that the parameters for new sub-categories cannot be
edited in the user interface and datasheets but only in the consumer sub-module. Use macro to navigate to
the consumer sub-module and edit existing new sub-categories.
Parameters for new sub-categories in the consumer sub-module
Column B is the same drop-down as already known from cells D83-D97 of the “Interface” for the selection of
all PCs or ACs. In column D, the names of the new sub-categories can be entered by the user. Please make
sure to use unique names in order to avoid confusion in the look-up functions (may return incorrect results).
Column C supports the user by indicating that a sub-category name was already used in the existing subcategories by displaying a red exclamation mark (see comment in cell D6). So he just needs to ensure no
duplication within column D of this sheet.
Columns F-G, K-N, Q-S and V-Y allow the entry of an advanced set of model parameters. Some of them are
the same as used in the user interface before (e.g. column F: Product is a spray?; column K: Product
Ingredient Fraction by Weight).
In general, the input area is structure to address:
-
“Product is a spray?” and “Product is a solid?” for PCs in columns F and G
Routes of exposure and differentiation for adults and children in columns H-J
Product Ingredient Fraction by Weight in column K
Frequency of use – for all routes in column L
Dermal parameters in columns M and N (related contact area values returned in column O and P)
Oral parameters in columns Q, R and S (related contact area values returned in column T and U)
Inhalation parameters in columns V - Y
User comments can be captured in column AB
For more details on the use of new subcategories please refer to the updated user guide for the consumer
tool (version 3.1) and the ECETOC TRA technical report and the addenda to it.
Page 12
User Guide for the TRA integrated tool – TRAM, version 3.1
Figure 6-2: General part of the input area for new sub-categories in the consumer sub-module, sheet
“Add Subcategories”.
The button “CLICK TO ADD ROWS” is next to cell B2 - user will be asked how many rows (i.e. new subcategories) shall be added. The button “Finish new subcategories” (next to cell D2) is required to add the
recently created “New sub-categories” to the selection lists in the “ecetocTRAM.xls file for batch
processing.
Figure 6-3: Dermal and oral part of the input area for new sub-categories in the consumer sub-module,
sheet “Add Subcategories”.
For dermal exposure, the selection of two additional body parts (“two fingertips” and “palm of one
hand”) was included. Parameters in columns S are only applicable for AC5 when “5: default” was
selected in column R. Column S fields will then turn from grey shading into active cells with entry options
from drop-down.
Page 13
User Guide for the TRA integrated tool – TRAM, version 3.1
Figure 6-4: Inhalation part of the input area for new sub-categories in the consumer sub-module, sheet
“Add Subcategories”.
New parameters are the “Place of use” and the specification of a Transfer Factor (TF) for inhalation.
NOTE: For using the “New sub-categories” created in the “Add-subcategories” sheet in the Consumer submodule in the batch processing of the datasheets in ecetocTRAM.xls master file, it is required to add the
recently created “New sub-categories” to the selection lists in the “ecetocTRAM.xls file by clicking the macro
button “Finish new subcategories” on the “Add-subcategories” sheet. If one of the “New sub-categories” is
then selected for batch processing in the datasheets, the respective entry fields in the datasheets are deactivated (no editing possible). All parameter setting can only be done in the “Add-subcategories” sheet.
3.7 Part VI - Data Entry for Environmental Assessment
Part VI (Figure 7) covers the entries for an environmental exposure and risk assessment. The input via the
user interface (manual mode) offers the possibility to assess exposure using the environmental release
classes (ERC) defined in ECHA guidance R16 or using some more refined specific environmental release
classes (SpERC) as a first step.
For the environmental exposure assessment, up to 15 different uses (lines 114-128), each characterised by a
combination of life cycle stage, tonnage, ERC as the use descriptor related to environment (column H) and a
fraction of the tonnage considered for a regional assessment, can be considered. The scenario name (B114B128) is an optional free text field; the entry of the life cycle stage is also optional and several life cycles can
be selected from a drop-down menu (D114-D128). The annual EU tonnage needs to be entered as a number.
In cells E114-E128 the fraction of the tonnage considered for a regional assessment is selected via a dropdown menu. For more information on regional assessments please refer to the TRA report and the ECHA
guidance Part D and R16. In cells G114-G128 the user needs to select whether he wants to use an ERC or a
SpERC as a determinant for the exposure assessment. If ERC is selected here, column I of the environment
section need to be filled to specify if there is a sewage treatment plant considered for this ERC (column I). A
glossary for the ERCs can be found in line 131 and the ECHA guidance document R16. If ‘SpERC’ is selected as
emission assessment method in column G, the organisation/industry sector for which the SpERC is relevant
is selected in column J. In column K the particular SPERC is selected for the assessment. All SpERCs are based
on the assumption that a municipal STP is available for wastewater treatment. Hence, for SPERC
assessments column I can be left empty.
Page 14
User Guide for the TRA integrated tool – TRAM, version 3.1
Amounts Used
For specifying ‘Daily amount used at site [kg/d] for SpERC assessment’ (column L) for point sources several
scenarios are possible:
-
-
the emission assessment is based on an ERC: the cell in column L is grey and no entry is possible. The
‘Daily amount used at site [kg/d] for SpERC assessment is derived based on Chapter R16 of the ECHA
Guidance.
the emission assessment is based on a SPERC for which no value of MSPERC is specified: the cell in
column L is yellow. A value must be entered.
the emission assessment is based on a SPERC for which a value of MSPERC is been specified: the cell in
column L is light blue. The value of MSPERC displayed in column N. It can be overwritten by entering a
value into column L.
For specifying ‘Daily amount used at site [kg/d] for SpERC assessment’ (column L) for wide dispersive uses
the emission assessment the cell in column L is grey and no entry is possible, irrespective of ERC or SPERC
emission assessment.
The above options for specifying ‘Daily amount used at site [kg/d] for SpERC assessment’ are analogous to
the approaches taken in ECHA’s CHESAR.
For more information about SpERCs please refer to the CEFIC SPERC Guidance and the ECETOC Technical 107
and the available SpERC Factsheets (SpERC Factsheets) Further down (cells D135- D141), the reference values
for the different endpoints need to be entered for a risk characterisation as well as the indication which
reference value it is (e.g. PNEC).
Practical note: ERC is a mandatory entry even if the assessment may be based on SpERCs or higher TIER
approaches as it will define whether the assessment refers to a point source or a wide dispersive use.
For a higher TIER assessment the user is advised to enter the data directly into the datasheets (see batch
mode). For details on the release estimation options see section 4, datasheets, the ECETOC Technical Reports
107 and TR114
Page 15
User Guide for the TRA integrated tool – TRAM, version 3.1
Figure 7 : Part VI. Environmental exposure assessment input.
The environmental input is also set up in the same way as the human health input fields. There is an
optional free text entry field for a descriptive use name and a drop down field for the selection of a life
cycle stage. The annual EU tonnage is entered per life cycle stage, also the fraction of this tonnage that
goes into the region. Here a value of 1 (100%) or 0.1 (10%) can be selected in line with the ECHA guidance
document R16. The other columns allow for choosing between calculating the PECs based on the ERCs or
SpERCs (specific ERCs). The entry in column “Use ERC or SpERC…” determines which approach will be
used for the calculation, in column “ERC”, the corresponding ERC for this use has to be selected (as use
descriptor and for calculation of aggregated WDU, with or without STP in column “STP”.
Alternatively, if SpERC is selected, the industry sector or sector organisation can be selected in column
“Industry sector for SpERC”, which provided SpERCs to the ECETOC TRA. In the last input column the
corresponding SpERC can then be selected (column J and K).
Notes:
Column L allows the entry of the daily amount used at a site (in kg/d)where applicable and needed – see
further details in Figure 7-2.
Column H will show a warning if the selected SpERC does not correspond to the ERC selected (check
against the specification of the underlying ERC refined by the selected SpERC).
Practical note: Reference values for the assessment of exposure of ‘man via the environment’ have to be
entered in the consumer section to compare with the predicted oral and inhalation exposure.
Page 16
User Guide for the TRA integrated tool – TRAM, version 3.1
Figure 7-1: Part VI. Environmental exposure assessment input – General and ERC input.
Figure 7-2: Part VI. Environmental exposure assessment input – SpERC related input.
The daily amount used at a site (kg/d) may be entered for point source assessments. If there is no MSPERC
defined, the cell is formatted in yellow indicating a mandatory input (example CEPE SPERC 2.1a.v1). If a
MSPERC is defined, the cell is formatted in blue indicating an optional input (example AISE SPERC 2.1a.v1 MSPERC is 16700 kg/d). If ERCs or SpERCs for wide dispersive uses are selected, the cell is formatted in grey
– no entry should be done (will be ignored!)
Note: The last SpERC selected was not a refinement of the selected ERC (use descriptor) and the warning
message alerts the user to check for consistency.
Page 17
User Guide for the TRA integrated tool – TRAM, version 3.1
Figure 7-3: Part VI. Environmental exposure assessment input – Reference value input.
Page 18
User Guide for the TRA integrated tool – TRAM, version 3.1
4. OUTPUT OF RESULTS IN THE USER INTERFACE
The output of the three parts “consumer”, “worker” and “environment” exposure and risk assessment are
structured in a similar way. The first columns always show the estimated exposure values, the following
columns show the “risk characterisation ratios” (RCRs), the exposure divided by the reference value. If a risk
is estimated for a use, the respective cell is highlighted in red (Figure 9).
The outputs are always arranged adjacent to the columns of the use inputs in the same line, so that one line
always displays the input and the result for a specific use (e.g. line 55 is the first worker use with its PROC
and conditions as input in cells D55-L55 and the corresponding results in O55-X55.
4.1 Output of the Worker Exposure and Risk
The output of the calculated exposures and RCRs for workers can be found in cells O54 to Z69. Column O
3
covers the results for inhalative exposure in ppm, column P covers inhalative exposure in mg/m and column
3
Q dermal exposure in mg/kg/day. In TRA version 3 short-term inhalation in mg/m (column R) and long-term
dermal local exposure in µg/cm2 (column S) were included in the assessment. If for a certain route
(inhalative or dermal) no exposure can be estimated the result is #NV (Figure 8). Columns V to Z show the
RCRs for the corresponding routes.
Figure 8: Worker output fields in the user interface
Long-term Inhalative
Exposure Estimate (ppm
for volatiles) / (mg/m3
for solids)
1.00E+00
5.00E+00
Long-term
Inhalative
Exposure Estimate
(mg/m3)
4.17E+00
2.08E+01
Long-term Dermal
Exposure Estimate
(mg/kg/day)
2.74E-01
6.86E-02
Short-term Inhalative
Exposure Estimate
(mg/m3)
1.67E+01
8.33E+01
Local Dermal
Exposure Estimate
(µg/cm2)
4.00E+01
1.00E+01
1.00E+00
4.17E+00
6.86E-03
1.67E+01
1.00E+00
4.00E+00
1.67E+01
2.74E-02
6.67E+01
4.00E+00
1.50E-04
6.25E-04
6.86E-05
2.50E-02
1.00E-02
2.50E+02
1.04E+03
4.29E+01
4.17E+03
2.00E+03
2.50E+02
1.04E+03
4.29E+01
4.17E+03
2.00E+03
1.75E+02
7.29E+02
4.29E+01
2.92E+03
2.00E+03
Notes/comments on
exposure estimates:
LEV efficiency inhalation
[%]: 90, LEV efficiency
demal [%]: 90,
LEV efficiency inhalation
[%]: 80, LEV efficiency
demal [%]: 80,
LEV efficiency inhalation
[%]: 90, LEV efficiency
demal [%]: 90,
Note that the TRA
predicts vapour phase
exposure; exposure by
aerosols is not taken into
account; if aerosol
formation is relevant,
refer to other information
or models.
Note that the TRA
predicts vapour phase
exposure; exposure by
aerosols is not taken into
account; if aerosol
formation is relevant,
refer to other information
or models.
Note that the TRA
predicts vapour phase
exposure; exposure by
aerosols is not taken into
account; if aerosol
formation is relevant,
refer to other information
or models.
Risk
Characterisation
Ratio - Long-term
Inhalation
4.17E-01
2.08E+00
Risk
Characterisation
Ratio -Long-term
Dermal
5.49E-02
1.37E-02
Risk Characterisation
Ratio - Long-term
Total Exposure
4.72E-01
2.10E+00
Risk
Characterisation
Ratio - Short-term
Inhalation
8.33E-01
4.17E+00
Risk
Characterisation
Ratio - Local
Dermal
4.00E-01
1.00E-01
4.17E-01
1.37E-03
4.18E-01
8.33E-01
1.00E-02
1.67E+00
5.49E-03
1.67E+00
3.33E+00
4.00E-02
6.25E-05
1.37E-05
7.62E-05
1.25E-03
1.00E-04
1.04E+02
8.57E+00
1.13E+02
2.08E+02
2.00E+01
1.04E+02
8.57E+00
1.13E+02
2.08E+02
2.00E+01
7.29E+01
8.57E+00
8.15E+01
1.46E+02
2.00E+01
In the columns adjacent to the input fields, the respective results of the calculation are shown, after the
“run” button was activated and the scenarios were calculated. Displayed is the calculated exposure for
the different routes and the resulting risk characterisation ratio. Red fields indicate an RCR>1, green
fields indicate an RCR<1.
Page 19
User Guide for the TRA integrated tool – TRAM, version 3.1
Practical note: The total exposure for human health was removed from the report and only the total RCR is
reported in version 3. However, important comments/remarks regarding the predicted exposure is now
provided to the user in column R. Particularly the effectiveness of LEV for inhalation exposure (and dermal
exposure, where applicable) is reported.
4.2 Output of the Consumer Exposure and Risk
The consumer results are structured in the same way as the worker results with one specialty: Columns N-V
show the results calculated for the product subcategories (if a product or article subcategory was specified)
and columns X-AF show the results calculated for the “sentinel” product categories (if no product or article
sub-category was specified) (Figure 9). For details on subcategories and sentinel products please refer to the
user guide for the consumer tool and the TRA report.
Figure 9-1: Consumer output fields for Product Subcategory in the user interface.
OUTPUT BY PRODUCT SUBCATEGORY
Risk
Characterisation
Ratio - Oral
Risk
Characterisation
Ratio - Total
1.34E-02
Inhalation exposure
(mg.kg-1.d-1)
1.34E-01
Dermal exposure (mg.kg- Oral exposure
1.day-1)
(mg.kg-1.day-1)
0.00E+00
Inhalation exposure
(mg.m-3)
1.47E+00
Risk
Risk Characterisation Characterisation
Ratio - Inhalation
Ratio - Dermal
1.34E-02
0.00E+00
5.53E+00
0.00E+00
4.04E+01
5.53E-01
0.00E+00
5.53E-01
5.38E-01
0.00E+00
5.88E+00
5.38E-02
0.00E+00
5.38E-02
1.34E+00
0.00E+00
1.47E+01
1.34E-01
0.00E+00
1.34E-01
2.02E-01
1.78E+01
2.21E+00
2.02E-02
1.78E+00
7.42E-01
7.42E-01
1.88E+00
In the columns adjacent to the consumer input fields, the respective results of the calculation are shown,
after the “run” button was activated and the scenarios were calculated. The calculated exposure for the
different routes is displayed and the resulting risk characterisation ratio for the sub-categories. Red fields
indicate an RCR>1, green fields indicate an RCR<1.
Note: Empty line may occur if no sub-category was specified and, thus, only results for sentinel products
were calculated (see Figure 9-2).
Page 20
User Guide for the TRA integrated tool – TRAM, version 3.1
Figure 9-2: Consumer output fields for Sentinel Products in the user interface.
OUTPUT BY SENTINEL PRODUCT CATEGORY
Inhalation exposure
(mg.kg-1.d-1)
5.53E+00
Oral exposure
(mg.kg-1.day-1)
2.14E+01
Inhalation exposure Dermal exposure
(mg.m-3)
(mg.kg-1.day-1)
0.00E+00
4.04E+01
Risk
Characterisation
Ratio - Inhalation
5.53E-01
Risk
Characterisation
Ratio - Dermal
2.14E+00
Risk
Characterisation
Ratio - Oral
0.00E+00
Risk Characterisation
Ratio - Total Exposure
2.70E+00
4.97E+00
5.95E-02
0.00E+00
4.97E-01
5.95E-03
0.00E+00
5.03E-01
8.70E+02
3.69E+00
1.29E+02
0.00E+00
4.04E+01
3.69E-01
1.29E+01
0.00E+00
1.32E+01
1.84E+00
1.00E+01
6.75E+01
1.50E+01
0.00E+00
4.04E+01
1.84E-01
3.69E+00
1.43E+02
1.27E+02
7.15E+01
7.15E+01
4.04E+01
3.69E-01
1.43E+01
1.27E+01
7.15E+00
7.15E+00
1.00E+00
6.75E+00
1.50E+00
0.00E+00
1.55E+01
1.95E+01
8.65E+00
7.51E+00
3.69E+00
9.07E+01
7.15E+01
7.15E+01
0.00E+00
0.00E+00
4.04E+01
9.93E+02
3.69E-01
9.07E+00
7.15E+00
7.15E+00
0.00E+00
0.00E+00
7.51E+00
1.62E+01
New subcat
New subcat
New subcat
New subcat
New subcat
New subcat
New subcat
New subcat
7.38E+00
3.69E+00
7.38E+00
3.69E+00
7.38E+00
1.03E+03
1.46E+01
5.57E+01
3.47E+00
6.27E+01
4.30E+00
0.00E+00
3.00E+00
1.00E+00
7.17E-01
4.04E+01
4.04E+01
4.04E+01
4.04E+01
4.04E+01
7.38E-01
3.69E-01
7.38E-01
3.69E-01
7.38E-01
1.03E+02
1.46E+00
5.57E+00
3.47E-01
6.27E+00
4.30E-01
0.00E+00
3.00E-01
1.00E-01
7.17E-02
1.04E+02
1.83E+00
6.61E+00
8.16E-01
7.08E+00
In the columns adjacent to the consumer input fields, the respective results of the calculation are shown,
after the “run” button was activated and the scenarios were calculated. The calculated exposure for the
different routes and the resulting risk characterisation ratio for the sentinel products. Red fields indicate
an RCR>1, yellow fields indicate an RCR<1.
Note: No sentinel product results will be reported for NEW sub-categories created by the user (see
example in row 10 above).
4.3 Output of the Environmental Exposure, Risk and Safe Amount for Handling
(MSAFE)
The consumer results are structured in the same way as the results for workers. There is one exception:
Besides the exposure or predicted environmental concentrations (PECs) and the RCRs also the maximum
amount for safe handling (MSAFE) is shown in columns AA-AG (Figure 10). For details on this parameter please
refer to the TRA report.
Page 21
User Guide for the TRA integrated tool – TRAM, version 3.1
Figure 10: Environmental output fields in the user interface.
In the columns adjacent to the environmental input fields, the respective results of the calculation are
shown, after the “run” button was activated and the scenarios were calculated. Displayed is the
calculated exposure for the different routes, the resulting risk characterisation ratios and the maximum
amount for safe handling. Red fields indicate an RCR>1, green fields indicate an RCR<1.
Page 22
User Guide for the TRA integrated tool – TRAM, version 3.1
5. DATASHEETS
The datasheets consist of 20 tabs in the ecetocTRAM.xls called “datasheet1” to “datasheet20”. Each
datasheet offers the possibility to save four substances with up to 60 (contributing) scenarios for worker
and consumer and up to 24 scenarios for environment. In total up to 80 substances, with up to 60 uses for
consumer and worker and 24 for environment, can be saved in the datasheets. Substances can be saved
there via the save button in the user interface (limited to 15 uses) or by direct entry into the datasheets.
Entering data directly into the datasheets is for advanced users and offers also the possibility to enter data
which might become necessary for a refinement. The datasheets offer the possibility to enter more detailed
physico-chemical data, environmental fate data and (eco)toxicological data for deriving PNECs.
5.1 Datasheets – Entering Input for Standard Assessments
The upper part of the datasheets is structured in a similar way as the user interface (Figure 11). The first
part is the identification of substance, followed by the basic physico-chemical data. The next parts cover up
to 60 scenarios for worker, consumer and 24 for the environment. In contrary to the user interface one use
is not arranged in one line but in one column (e.g. cells D34-D42 covers the input parameters for the
first worker scenario per datasheet).
Column B of the datasheets contains the description of all possible input parameters of the TRA.
The datasheets interact with the user interface via the “read” and “save” buttons. Since the user interface
does not cover all cells which can be filled in the datasheets, only those reflected in the user interface can
be read via the “read” button and be saved via the “save” button (i.e. worker scenarios 1-15, consumer
scenarios 1-15 and environmental scenarios 1-15) .
Page 23
User Guide for the TRA integrated tool – TRAM, version 3.1
Figure 11-1: Upper part of a datasheet with worker inputs.
Column B contains the description of all possible input and output parameters. The structure of the upper
part equals the structure of the user interface. One use is represented in one column (red ellipse). Yellow
fields are mandatory inputs for exposure parameters, blue fields are optional, as in the user interface.
Reference values in column C have been extended to short-term inhalation (15 minutes average) and
long-tern local dermal in TRA v3.1.
In total the ecetocTRAM.xls offers 20 datasheets to cover 80 substances with up to 60 (contributing)
scenarios for worker and consumer and 24 for the environment.
For the consumer assessment part, the same parameters as used in the “Interface” sheets are available, but
in columns instead of rows (same as for worker assessments). The button to navigate to the consumer submodule to create or edit new sub-categories is located in column B (cell B53).
Page 24
User Guide for the TRA integrated tool – TRAM, version 3.1
Figure 11-2: Consumer input part of a datasheet.
One use is represented in one column (pink ellipse). Yellow fields are mandatory inputs, blue fields are
optional, as in the user interface. Button to navigate to the consumer sub-module is in cell B53.
5.2 Datasheets – Entering Input for Advanced Assessments
Emission Assessment via Datasheet
All entries for refinement are formatted as “optional” (i.e. not required for ERC or SpERC based assessments),
but are required for TIER II exposure assessments.
In the datasheets, the daily site amount for SpERCs may be entered in line 79, MSPERC would be reported in
line 89 and a related message in line 90 following the same logic as described for the Interface. For TIER II
assessments, the daily site amount is entered in lines 123 and 130.
Where a daily site amount (Msite in kg/d) is entered (and this also applies to SpERCs, where applicable),
Fmainsource is calculated as:
= Msite / (EU Tonnage * 1000 * Fregion/Temis) OR
= Msite / (Tregion * 1000 /Temis)
The selection of the release estimation method/approach for environmental assessments in the datasheets
is done via 4 drop-down cells (lines 102, 103 and 105 106- Figure 12). Only one can be set to “TRUE”
(warning message will appear in line 107 if more than 1 “TRUE” was selected).
Page 25
User Guide for the TRA integrated tool – TRAM, version 3.1
Figure 12: Selection of the release estimation method for environmental assessments in the datasheets
(TIER I and TIER II).
102
103
104
105
106
Select approach ERC
Select approach spERC
TIER II Assessment Approaches:
Select approach using SPECIFIC RELEASE FRACTIONS
Select appraoch using MEASURED DATA (releases in kg/day)
FALSE
TRUE
TRUE
FALSE
107
ECETOC TRA FLAT DATABASE - INPUT TIER 2
108
Environmental Assessment (including Man via Environment)
only 1 TRUE
The example shows the error message returned if two methods were set to “TRUE”.
Refining Environmental Assessments beyond SPERCs
Lines 109-181 are for entering input parameters for a refined environmental assessment (Figures 13-1 and
13-2). In lines 116 the type of RMM is specified as free text. In line 117 the associated efficiency of the RMM
is entered as numerical value (in %). Lines 121-127 can be used for entering release factors (e.g. from OECD
ESDs), lines 130-138 for entering amounts release in [kg/day] derived e.g. from measured data.
Lines 141-146 cover specific data on sewage treatment plants. Line 143 offers the possibility to override the
default specify that a sewage treatment plant treats wastewater which is discharged to the marine
environment. In lines 165-173, refined physico-chemical data can be entered and in lines 176-181
degradation and transformation rates can be entered.
Practical note: TRAM version 3 reduced the TIER II inputs for release estimation to release fractions and
release rates (in [kg/day]) and provides fields in lines 109-119 of the datasheets to explain/justify the TIER II
parameters used for refinement.
Please note that the RMM efficiency (%) documented in this part will also be used in the generation of
scaling parameters. Therefore, any combined RMMs can be described in free text in the RMM lines, but the
resulting total efficiency needs to be entered in the efficiency lines.
If an ERC of SpERC based assessment is to be refined by additional RMMs, the release fractions can be picked
from lines 153-155 of the original scenario assessed and entered into the TIER II section of the refined
scenario (lines 125-127, e.g. by copy/paste special - values). The additional RMM efficiency can then be
directly factored into the refined release fraction using the efficiencies specified in lines 115, 117 and/or 119
as follows:
Refined release fraction = original release fraction * (1-efficieny of RMM)
Example 2% release in ERC 2 to air to be refined via RMM efficiency in cell D115 (%):
Refined release fraction = 0.02 * (1-D115)
Page 26
User Guide for the TRA integrated tool – TRAM, version 3.1
Figure 13-1: Optional input for a TIER II environment assessment with release estimates based on
release fraction (displayed example, e.g. from OECD emission scenario documents) or release rates (e.g.
from measured data – not populated in example).
102
103
104
105
106
Select approach ERC
Select approach spERC
TIER II Assessment Approaches:
Select approach using SPECIFIC RELEASE FRACTIONS
Select appraoch using MEASURED DATA (releases in kg/day)
FALSE
FALSE
TRUE
FALSE
107
ECETOC TRA FLAT DATABASE - INPUT TIER 2
108
109
110
111
112
113
114
115
116
117
118
119
120
121
122
123
124
125
126
127
128
129
130
131
132
133
134
135
136
137
138
139
140
141
142
143
144
145
146
Environmental Assessment (including Man via Environment)
Justifications for refined release parameters
Basis used for refinement (e.g. ERC, SPERC)
Fraction of EU tonnage to region (-) - modified in line 78
Daily amount used at site [kg/d]
Release times per year (d/year)
Local release to air - RMM
Local release to air - efficiency of RMM (%)
Local release to sewage - RMM (beyond STP)
Local release to sewage - efficiency of RMM (%)
Local release to soil - RMM
Local release to soil - efficiency of RMM (%)
RELEASE ESTIMATION BASED ON SPECIFIC RELEASE FRACTIONS
Comments 1
Comments 2
Daily amount used at site [kg/d] (release fractions)
Release times per year (d/year)
Local release fraction to air
Local release fraction to sewage
Local release fraction to soil
ERC
ERC default
adjusted to reflect largest
conservative number assu
ERC default
n/a
Oil-water separation
90%
ERC default
n/a
only RMM for waste wate
STP and river flow = defau
1000
100
0.05
0.006
0.0001
RELEASE ESTIMATION BASED ON RELEASE RATES, e.g. measured data (releases in kg/day)
Daily amount used at site [kg/d] (release rates)
Release times per year (d/year)
Name of Monitoring Site or other source of information
Remark
Monitoring regime
Remark
Measured. Release to air (kg/d)
Measured Release to sewage (kg/d)
Measured Release to soil (kg/d)
STP PARAMETERS (can be used to refine also ERCs and spERCs except for STP [yes/no] )
Use of local STP (yes/no)
Local STP with primary settler?
Use STP local marine?
SludgeToSoil? (yes/no)
River flow (m3/d)
Effluent discharge rate of local STP (m3/d)
Page 27
yes
yes
yes
yes
18000
2000
User Guide for the TRA integrated tool – TRAM, version 3.1
Refined Physical-Chemical and Degradation Data
Also some additional physical-chemical data and degradation rates can be entered for a refined assessment.
Figure 13-2: Optional input for a TIER II environment assessment with release estimates based on
release fraction (e.g. from OECD emission scenario documents) or release rates (e.g. from measured
data).
164
165
166
167
168
169
170
171
172
173
174
175
176
177
178
179
180
181
PHYSICAL-CHEMICAL SUBSTANCE PROPERTIES
Vapour pressure at the temperature of the data set (Pa) - from TIER I
Temperature at which vapour pressure was measured (degrees C)
Water solubility at the temperature of the data set (mg.l-1) - from TIER I
Temperature at which solubility was measured (degrees C)
Melting point (degrees C)
Solids-water partition coefficient raw sewage sludge (l.kg-1)
Solids-water partition coefficient settled sewage sludge (l.kg-1)
Solids-water partition coefficient activated sewage sludge (l.kg-1)
Solids-water partition coefficient effluent sewage sludge (l.kg-1)
DEGRADATION AND TRANSFORMATION RATES
Rate constant for degradation in STP (d-1)
Total rate constant for degradation in surface water at env. Temp (d-1)
Total rate constant for degradation in marine water at env. Temp (d-1)
Total rate constant for degradation in bulk sediment at env. Temp (d-1)
Rate constant for degradation in air (d-1)
Total rate constant for degradation in bulk soil at env. Temp (d-1)
25
0.005
Also some additional physical-chemical data and degradation rates can be entered for a refined
assessment.
PNEC Derivation analogous to EUSES
Lines 183 – 441 offer the possibility to enter data for deriving the PNECs in the same way as it was done
in the TGD-Excel spreadsheet version of EUSES (Figure 14). This option is only available in the “advanced”
batch mode.
However, many users will have derived PNECs outside of the TRAM and will not use these rows. Therefore, a
new feature was added to expand the related rows in the input and output by a macro button in line 183. To
collapse the PNEC derivation area, a second button is available in line 186 (only visible in expanded mode).
The “Expand” / “Collapse” function will also apply to the PNEC results area in the results section of the
datasheets.
Page 28
User Guide for the TRA integrated tool – TRAM, version 3.1
Figure 14: Optional input for PNEC derivation based on (eco)toxicological data.
“Expand” button
“Collapse” button
The PNECs are derived the same way as within EUSES or the TGD Excel Spreadsheet model.
Practical note: Alert: Upon pushing the button ‘Open PNEC derivation area’ (line 183), the screen moves to
the far left, i.e. the columns of the first substance in the respective datasheet. Hence, make sure to input the
data into the correct substance (i.e. check that the inputs are made into the correct columns).
5.3 Output within the Datasheets
The output within the datasheets is structured in the same way as the input: worker, consumer,
environment TIER I, followed by environment TIER II (Figure 15). Derived PNECs are displayed if the
respective area was expanded by using the macro button in line 183 as described above.
As in the user interface the output is arrange in a way that it related directly to the input. The output in a
certain column is the result of the estimation for the use put in the same column (output of column D
is the result of the scenario put in column D).
Page 29
User Guide for the TRA integrated tool – TRAM, version 3.1
Figure 15: Output of a worker assessment within the datasheets.
444
ECTETOC TRA FLAT DATABASE - OUTPUT TIER 1
445
446
Human Health - Workers
447
448
449
450
451
452
Estimate of exposures
Long-term Inhalative Exposure Estimate (ppm volatiles/mg.m-3 solids)
Long-term Inhalative Exposure Estimate (mg/m3)
Long-term Dermal Exposure Estimate (mg/kg/day)
Short-term Inhalation Exposure Estimate (mg/m3)
Long-term Local Dermal Exposure Estimate (µg/cm2)
Notes/comments on exposure estimates:
453
454
455
456
457
458
459
Risk characterization
Risk Characterisation Ratio - Long-term Inhalation
Risk Characterisation Ratio - Long-term Dermal
Risk Characterisation Ratio - Long-term Total Exposure
Risk characterisation Ratio - Short-term Inhalation
Risk characterisation Ratio - Long-term Local Dermal
0.01
0.322083333
0.034285714
0.322083333
10
0.02
0.644166667
0.274285714
0.644166667
40
LEV efficiency inhalation
[%]: 80, LEV efficiency
demal [%]: 0,
0.7
0.7
0.068571429
0.7
20
0.018
0.57975
6.857142857
0.96625
1000
0.09
2.89875
0.041142857
11.595
6
LEV efficiency inhalation
[%]: 90, LEV efficiency
demal [%]: 90,
0.032208333
0.064416667
0.07
0.057975
0.289875
0.006857143
0.054857143
0.013714286
1.371428571
0.008228571
0.039065476
0.11927381
0.083714286
1.429403571
0.298103571
0.016104167
0.032208333
0.035
0.0483125
0.57975
No Local Dermal DNEL No Local Dermal DNEL No Local Dermal DNEL No Local Dermal DNEL No Local Dermal DNEL
The output is structured in the same way as the input. The output of one column reflects the result of the
estimation for a use put in the same column.
Interim Results of the Environmental Emission Assessment
Lines 151-162 display the results of the emission assessment (see Figure 16). The following information is
specified per use: the amount used locally (line 151), the number of days at which emissions occur (line 152),
the release fractions (lines 153-155, to air, water, and soil, respectively – these are the release fractions as
stated in the ERC or SPERC background tables or set in line 125 of the Datasheet), and the local release rate
(line 156-158, to air, water, and soil, respectively, - the release rates take into account that for wide
dispersive uses, the local release will be considered 0 in accordance with the ECHA Guidance document
R.16). Lines 159-161 specify the regional releases to air, water, and soil which are cumulated over all
individual uses. These regional releases are used as input to the PECRegional calculation.
Figure 16: Example output of Interim results for volumes and releases in environment assessments.
148
149
151
152
153
154
155
156
157
158
159
160
161
162
VOLUMES and RELEASES (INTERIM RESULTS)
EU tonnage for use (tpa)
Amount used locally (kg/d)
Release times per year (d/year)
Release fraction air (as in ERC or SPERC background table or set in line 125)
Release fraction (waste) water (as in ERC or SPERC background table or set in line 125)
Release fraction soil (as in ERC or SPERC background table or set in line 125)
Local release to air (kg/d) (will be set to 0 for WDU - see ECHA guidance R.16)
Local release to waste water (kg/d)
Local release to soil (kg/d) (will be set to 0 for WDU - see ECHA guidance R.16)
Regional release (from all uses) to air (kg/d)
Regional release (from all uses) to waste water (kg/d)
Regional release (from all uses) to fresh water directly (kg/d)
Regional release (from all uses) to soil (kg/d)
31478.15947
511.662803
126.6365437
33.93045311
1.67E+04
2.20E+02
2.00E-04
1.00E-04
0.00E+00
3.34E+00
1.67E+00
0.00E+00
1.67E+04
2.20E+02
2.00E-04
1.00E-04
0.00E+00
3.34E+00
1.67E+00
0.00E+00
8.35E+03
2.20E+02
2.00E-04
1.00E-04
0.00E+00
1.67E+00
8.35E-01
0.00E+00
Additional output is generated by TRAM version 3.1 for the environmental assessments at the bottom end
datasheets to correspond to the REACH Chemical Safety Report template (ECHA ES format).
Page 30
User Guide for the TRA integrated tool – TRAM, version 3.1
Figure 17: Example output of additional assessment results for the environmental compartment for the
REACH Chemical Safety Report template.
Scaling Parameters for Environmental Scenarios Assessed
A new output section was added to the TRAMv3 environmental results in order to support the generation of
data required for scaling. These results are only provided in the “advanced” batch mode (i.e. via “Run batch”
or “Run batch – Environment” in the INTERFACE with Cell I27 set to “Advanced”) and are displayed in
lines760 and below (see Figure 17). As for the PNEC derivation, a macro button is available in line 760 to
expand this area with the scaling results and a second macro button to collapse it. Two sets of data are
generated per environmental scenarios related to point sources (NOT for wide dispersive uses) and directly
feed into scaling tools, e.g. the GEST tool (in preparation). For other scaling tools using these parameters, the
order/format/etc. may need to be adjusted for input.
Practical note: After running a manual run via the user interface results are not automatically saved in
the datasheets. For saving the results of a manual run via the user interface the save button has to be
activated to save the results and the input parameters to the datasheets (see “Safe” function in Part 1 of this
user guide).
Page 31
User Guide for the TRA integrated tool – TRAM, version 3.1
Figure 18: Example output of scaling parameters for environment feeding into a “simple scaling tool” /
DU ES Conformity tool as currently developed.
Page 32
User Guide for the TRA integrated tool – TRAM, version 3.1
6. PRACTICAL CONSIDERATIONS FOR USERS
There are some known issues which need consideration when using the TRA integrated tool.
Microsoft Windows clipboard
Please be aware that the TRA, when calculating, uses a number of Microsoft Windows copy- paste functions.
During this time values from different sheets are transferred to the Microsoft Windows clipboard. It is
strongly advised to not using the windows clipboard during TRA calculation to avoid wrong information
being put into the TRA from the Windows clipboard. This is extremely important when using the “run batch”
mode.
CPU and RAM of your PC
The TRA uses as much CPU power as it can get. This means that during a large batch process it may happen
that other work on the same computer may be very slow. However, if you have a multi-core CPU, the TRA
uses only one core and other work on the same computer should not be affected too much.
It may also happen that the TRA requires a lot of memory (RAM) during operation (100 MB or more,
depending on the number of entered data), especially when running a large batch process.
Country settings of your windows system
Please be aware that the country settings of your windows system may have an influence on the operation
of the TRA. Lines 102/103 and 105/106 of the datasheets have a drop-down selection of “true” and “false”,
for example, for the approach you select for the environmental assessment (ERC, SpERC, release
fractions, release rates). If your computer uses a different language than English, problems might occur
because “true” and “false” are not the right words for your computer. If you cannot change your language
and country settings to English, a workaround is to copy and paste the terms in your computers language
into the fields rather than selecting them from the drop-down menu.
TIER II data
TIER II input data can be given for refining the assessments in lines 110-181 in the datasheets. Please
consider that inputs made in these lines will only be taken into account when using the “run batch” mode in
the user interface. Those data cannot be loaded into the user interface and will therefore not be considered
in the “run” mode.
PNEC derivation
The PNEC derivation can also only be used in the “run batch” mode, not in the “run” mode.
Running “batch” mode for a single substance
Some functions like PNEC derivation or TIER II data are only taken into account by the tool, if “run batch” is
selected in the user interface.
If you want to use these functions you need to calculate your substance(s) via the “run batch”. The “run
batch” can be used for many or for just one substance. Just specify the starting substance and the last
Page 33
User Guide for the TRA integrated tool – TRAM, version 3.1
substance to be calculated in the user interface cells I26 and K26. If you want to run a “batch” for just one
substance the start substance number (cell I26) and the end substance number (K26) are identical.
Differences between the consumers standalone version and the integrated version
For sentinel products, the stand-alone tool allows users to change product subcategory parameters within
each sentinel group. This could result in changes in the worst-case scenario. In the Integrated Tool, users
cannot change product subcategory parameters within each sentinel group so the worst-case scenario is
always "fixed".
Page 34
© ECETOC AISBL
Av. E. Van Nieuwenhuyse 2 (box. 8)
B-1160 Brussels, Belgium
VAT: BE 0418344469
www.ecetoc.org