1
Tools for Intelligent System Management of
Very Large Computing Systems
TIMaCS Manual
Documentation and User Guide
1/77
Tools for Intelligent System Management of
Very Large Computing Systems
Table of contents
1 About TIMaCS in General.................................................................................................................4
1.1 Introduction................................................................................................................................4
1.2 License Information...................................................................................................................5
1.3 About TIMaCS...........................................................................................................................7
1.5 Structure of TIMaCS.................................................................................................................8
2 How to install TIMaCS?..................................................................................................................10
2.1 System Requirements..............................................................................................................10
2.2 Step-by-step installation...........................................................................................................11
2.2.1 TIMaCS............................................................................................................................11
2.2.2 pycrypto............................................................................................................................11
2.2.3 paramiko...........................................................................................................................12
2.2.4 Erlang...............................................................................................................................12
2.2.5 RabbitMQ.........................................................................................................................12
2.2.6 XSB..................................................................................................................................12
2.3 Getting started – initial setup and configuration......................................................................13
2.3.1 Adjust configuration variables.........................................................................................13
2.3.2 Create a hierarchy............................................................................................................13
2.3.3 Run setup.sh.....................................................................................................................14
2.3.4 Compile XSB interface....................................................................................................14
2.4 First run....................................................................................................................................15
2.5 Installation of the Rule-Engine................................................................................................15
2.6 Installation of the TIMaCS Graphical User-Interface.............................................................17
3 Configuration of TIMaCS...............................................................................................................17
3.1 Configuration Files..................................................................................................................17
3.1.1 Configuration file for importers.......................................................................................17
3.1.2 Basic configuration file for Regression- and Compliance-Tests......................................20
3.1.3 File containing the configuration for Online-Regression-Tests.......................................22
3.1.4 Configuration files for Compliance-Tests........................................................................23
3.1.5 Configuration file for aggregators....................................................................................23
3.1.6 Configuration file for the hierarchy.................................................................................24
3.2 Command line Options............................................................................................................24
3.3 Rule-Engine Setup...................................................................................................................28
3.4 Configuration of the Policy-Engine.........................................................................................28
3.4.1 Configuring Interfaces.....................................................................................................28
3.4.2 Configuration of the Knowledge-Base............................................................................30
3.5 Configuration of Compliance-Tests.........................................................................................32
3.6 Configuration of the Delegate..................................................................................................33
3.7 Configuration of the Virtualization component.......................................................................34
3.8 Configuration of the TIMaCS Graphical User-Interface.........................................................35
3.9 Some tips and tricks for the configuration of the system........................................................35
4 Starting TIMaCS..............................................................................................................................35
4.1 Starting Online-Regression-Tests............................................................................................35
2/77
Tools for Intelligent System Management of
Very Large Computing Systems
4.2 Starting a Compliance-Test......................................................................................................36
5 For Users: How to use TIMaCS......................................................................................................37
5.1 The Communication Infrastructure..........................................................................................37
5.1.1 channel_dumper – a tool to listen to an AMQP-channel.................................................38
5.1.2 RPC for listing the running threads..................................................................................38
5.1.3 RPC to display channel statistics.....................................................................................38
5.2 Monitoring...............................................................................................................................38
5.2.1 Data-Collector..................................................................................................................40
5.2.2 Storage.............................................................................................................................40
5.2.2.1 Usage of the Database API.......................................................................................40
5.2.2.2 mdb_dumper – a command line tool to retrieve information from the Storage.......41
5.2.2.3 A Multinode Example...............................................................................................43
5.2.3 Aggregator........................................................................................................................45
5.2.4 Filter & Event-Generator.................................................................................................45
5.3 Preventive Error Detection......................................................................................................45
5.3.1 Compliance-Tests.............................................................................................................45
5.3.1.1 Benchmarks..............................................................................................................48
5.3.2 Regression-Tests..............................................................................................................53
5.3.2.1 Online-Regression-Tests..........................................................................................53
5.3.2.2 Offline-Regression-Tests..........................................................................................54
5.3.2.3 Regression Analysis.................................................................................................60
5.4 Management.............................................................................................................................61
5.4.1 Rule-Engine.....................................................................................................................61
5.4.2 Policy-Engine...................................................................................................................63
5.4.3 Delegate...........................................................................................................................64
5.5 Virtualization............................................................................................................................65
5.6 Using TIMaCS Graphical User-Interface................................................................................67
5.7 How to write plug-ins for TIMaCS..........................................................................................70
5.7.1 Writing custom Delegates................................................................................................70
5.7.2 Writing plug-ins for the regression analysis....................................................................71
5.7.3 Writing plug-ins for a batch-system.................................................................................72
5.7.4 Writing sensors and benchmarks for Compliance-Tests..................................................74
6 Acknowledgment.............................................................................................................................76
3/77
Tools for Intelligent System Management of
Very Large Computing Systems
1 About TIMaCS in General
1.1 Introduction
Operators of very large computing centres face the challenge of the increasing size of their offered
systems following Moores or Amdahls law already for many years. Until recently the effort needed
to operate such systems has not increased similarly thanks to advances in the overall system architecture, as systems could be kept quite homogeneous and the number of critical elements with comparably short Mean Time Between Failure (MTBF) such as hard disks could be kept low inside the
compute node part.
Current petaflop and future exascale computing systems would require an unacceptable growing human effort for administration and maintenance based on an increased number of components. But
even more would the effort rise due to their increased heterogeneity and complexity [1–3]. Computing systems cannot be built anymore with more or less homogeneous nodes that are similar siblings
of each other in terms of hardware as well as software stack. Special purpose hardware and accelerators such as GPGPUs and FPGAs in different versions and generations, different memory sizes and
even CPUs of different generations with different properties in terms of number of cores or memory
bandwidth might be desirable in order to support not only simulations covering the full machine
with a single application type, but also more coupled simulations exploiting the specific properties
of a hardware system for different parts of the overall application. Different hardware versions go
together with different versions and flavours of system software such as operating systems, MPI libraries, compilers, etc. as well as different, at best individual user specific, variants combining different modules and versions of available software fully adapted to the requirements of a single job.
Additionally the operation model from purely batch might be complemented by usage models allowing more interactive or time controlled access for example for simulation steering or remote visualization jobs.
While the problem of detecting hardware failures such as a broken disk or memory has not changed
and still can be done similarly as in the past by specific validation scripts and programs between
two simulation jobs the problems that occur in relation with different software versions or only in
specific use scenarios are much more complex to be detected and are clearly beyond what a human
operator can address with a reasonable amount of time. Consequently the obvious answer is that the
detection of problems based on different type of information collected at different time steps needs
to be automated and moved from the pure data level to the information layer where an analysis of
the information either leads to recommendations to a human operator or at best trigger a process applying certain counter measures automatically.
A wide range of monitoring tools such as Ganglia [4] or ZenossCore [5] exist that are neither scalable to the system sizes of thousands of nodes and hundred thousands of compute cores, cannot
cope with different or changing system configurations (e. g. this service is only available if the compute node is booted in certain OS modes), and the fusion of different information to a consolidated
system analysis state is missing, but more important they lack a powerful mechanism to analyse the
information monitored and to trigger reactions to change the system state actively to bring the system state back to normal operations.
Introduction
4/77
Tools for Intelligent System Management of
Very Large Computing Systems
Another major limitation is the lack of integration of historical data in the information processing,
the lack of integration with other data sources (e. g. planned system maintenance schedule database)
and the very limited amount of counter measures that can be applied. In order to solve these problems, we propose in scope of the TIMaCS [6] project a scalable, hierarchical policy based monitor ing and management framework. The TIMaCS approach is based on an open architecture allowing
the integration of any kind of monitoring solution and is designed to be extensible for information
consumers and processing components. The design of TIMaCS follows concepts coming from the
research domain of organic computing (e. g. see References [7] and [8]) also propagated by different computing vendors such as IBM in their autonomic computing [9] initiative.
In the following chapters we present the TIMaCS project, a hierarchical, scalable, policy based
monitoring and management framework, capable to solve the challenges and problems mentioned
above.
1.2 License Information
The TIMaCS framework consists of eight components. Due to the different license models of the libraries used by the different TIMaCS components, there does not exist an united license model for
the TIMaCS framework. Thus each TIMaCS component has its own license model.
The following components are released under GNU Lesser General Public License (LGPL) in version 3 (http://www.gnu.org/licenses/lgpl):
•
Data-Collector
•
Aggregator
•
RRD-Database
•
Compliance-Tests
•
Regression-Tests
•
Policy-Engine
•
Delegate
•
TIMaCS Monitoring GUI
The following components are released under GNU General Public License
(http://www.gnu.org/copyleft/gpl.html):
•
VM-Manager
The following components are released under Eclipse Public Licence
(http://www.eclipse.org/legal/epl-v10.html):
•
Rule-Engine
•
Rule-Editor
The next table states the dependency of the TIMaCS components and their license models.
License Information
5/77
Tools for Intelligent System Management of
Very Large Computing Systems
Dependency
Source (URL)
License model
used by
1
Python 2.6
http://www.python.org/
Open Source , all components
GPL kompatibel
RabbitMQ
http://www.rabbitmq.com/
MPL v1.12
all components
pika
http://pypi.python.org/pypi/pika
MPL v1.12 and
GPL v2.03
Data-Collector,
Aggregator,
RRD-database ,
ComplianceTests, Regression-Tests
simplejson
http://pypi.python.org/pypi/simplejson MIT4
py-amqplib
http://pypi.python.org/pypi/amqplib
LGPL5
Data-Collector,
Aggregator,
RRD-database ,
Rule-engine, Policy-Engine, Delegate
paramiko
http://pypi.python.org/pypi/paramiko
LGPL5
Data-Collector,
Aggregator,
RRD-database
Stream Benchmark
http://www.streambench.org/
Non-standard
permissive license9
ComplianceTests
Data-Collector,
Aggregator,
RRD-database
Effective Bandwidth https://fs.hlrs.de/projects/par/mpi//b_ef no license infor- ComplianceBenchmark (beff)
f/b_eff_3.2/
mation
Tests
Eclipse Modelling
Framework (EMF)
http://www.eclipse.org/emf
Eclipse Public
License6
Rule-editor
Eclipse Graphical
Modelling Framework (GMF)
http://www.eclipse.org/gmf
Eclipse Public
License6
Rule-editor
MPL v1.12 and
GPL v2.03
Rule-editor
Java AMQP client li- http://www.rabbitmq.com/javabrary
client.html
License Information
6/77
Tools for Intelligent System Management of
Very Large Computing Systems
Prolog-Engine XSB
http://xsb.sourceforge.net/
LGPL5
Policy-Engine
GPL7 (no rePolicy-Engine
strictions for
generated code)
Simplified Wrapper http://www.swig.org/
and Interface Generator (SWIG)
Singleton Mixin
http://www.garyrobinson.net/2004/03/p Public Domain
ython_singleto.html
Delegate
libvirt library
http://www.libvirt.org
LGPL5
VM-Management
libvirt Python Bindings
http://www.libvirt.org
LGPL5
VM-Management
Ext JS 4
http://www.sencha.com
GPL v37
GUI
JavaScript InfoVis
Toolkit
http://thejit.org/
BSD8
GUI
1 http://docs.python.org/release/2.6.7/license.html
2 http://www.mozilla.org/MPL/1.1/
3 http://www.gnu.org/licenses/gpl-2.0.html
4 http://www.opensource.org/licenses/mit-license.php
5 http://www.gnu.org/licenses/lgpl
6 http://www.eclipse.org/legal/epl-v10.html
7 http://www.gnu.org/copyleft/gpl.html
8 http://www.opensource.org/licenses/BSD-3-Clause
9 http://www.cs.virginia.edu/stream/FTP/Code/LICENSE.txt
The benchmark memory-tester is not included in the list above, since it is derived from the Streambenchmark and thus has the same license and dependencies.
1.3 About TIMaCS
The project TIMaCS (Tools for Intelligent System Management of Very Large Computing Systems)
is initiated to solve the issues mentioned in the introduction. TIMaCS deals with the challenges in
the administrative domain upcoming due to the increasing complexity of computing systems especially of computing resources with a performance of several petaflops. The project aims at reducing
the complexity of the manual administration of computing systems by realizing a framework for intelligent management of even very large computing systems based on technologies for virtualization, knowledge-based analysis and validation of collected information, definition of metrics and
policies.
The TIMaCS framework includes open interfaces which allow easy integration of existing or new
monitoring tools, or binding to existing systems like accounting, SLA management or user management systems. Based on predefined rules and policies, this framework is able to automatically start
predefined actions to handle detected errors, additionally to the notification of an administrator. Beyond that the data analysis based on collected monitoring data, Regression-Tests and intense regular
checks aims at preventive actions prior to failures.
About TIMaCS
7/77
Tools for Intelligent System Management of
Very Large Computing Systems
We developed a framework ready for production and validated it at the High Performance Computing Center Stuttgart (HLRS), the Center for Information Services and High Performance Computing
(ZIH) and the Distributed Systems Group at the Philipps University Marburg. NEC with the European High Performance Computing Technology Center and science + computing are the industrial
partners within the TIMaCS project. The project funded by the German Federal Ministry of Education and Research started in January 2009 and ended in December 2011.
This manual describes the TIMaCS framework, presenting its architecture and components.
Overview about the functionality of TIMaCS:
TIMaCS is a policy based monitoring- und management framework, developed to reduce the complexity of manual administration of very large high performance computing clusters. It is robust,
highly scalable and allows integration of existing tools. It
• monitors the infrastructure and performs intense regular system checks in order to detect errors.
• reduces administration effort with the means of predefined policies and rules, enabling semiautomatic to fully-automatic detection and correction of errors.
• performs Regression-Tests to enable preventive detection and reaction on errors prior to system failures.
• incorporates Compliance-Tests for early detection of software and/or hardware incompatibilities.
• provides sophisticated automation and escalation strategies.
• allows easy setup and removal of single compute nodes.
• includes open interfaces to enable binding to relevant existing systems such as accounting or
user management systems.
• provides a convenient way to dynamically partition the system, e. g. for fulfilling service
level agreements or separating academic and commercial users for increased security.
• uses virtualization for presenting a homogeneous environment to users on top of heterogeneous hardware.
• is possible to integrate Nagios and Ganglia.
1.4
1.5 Structure of TIMaCS
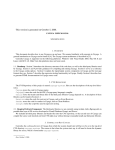
TIMaCS is organized hierarchically to guarantee scalability even for systems until 100 000 nodes
(see Figure 1). The compute nodes of a managed system form layer 0 (L0), the bottom of the hierarchy. The compute nodes contain sensors for their monitoring. The next level (L1) contains the lowest level of TIMaCS nodes. Each of these TIMaCS nodes manages a group of compute nodes. The
group size varies from several hundred to a few thousand compute nodes, depending on the expected incoming rate of messages, as shown in Table 1.
Structure of TIMaCS
8/77
Tools for Intelligent System Management of
Very Large Computing Systems
TIMaCS components
Max processing
speed
[msg / seconds]
Assumed max
incoming rate of
messages or metrics
[msg / seconds]
Max processing
capacity (per TIMaCS
node)
[number of hosts]
Data-Collector
600
0.2 (12 metrics per
minute)
3000
Filter & Event-Generator 250
(Rule-Engine)
0.2
1250
Policy-Engine
0.2
500
100
Table 1: Performance tests
The TIMaCS nodes at layer 1 are again divided into groups and each group exchanges data with
one TIMaCS node in the next higher layer (L2). This principle continues across an arbitrary number
of levels up to the top layer n (Ln), where the TIMaCS administrator node has control and comprehensive knowledge of the whole system.
Figure 1: Hierarchy of TIMaCS
Structure of TIMaCS
9/77
Tools for Intelligent System Management of
Very Large Computing Systems
To keep the additional load on the system generated by TIMaCS as small as possible, TIMaCS is organized in components, whereat on each node only that components are loaded, which are used
there. On the compute nodes (L0) are the sensors installed, which generate the monitoring data and
send them to the monitoring block on that TIMaCS node on the first level (L1), which is responsible
for this group of compute nodes. The monitoring block consists of the following components: DataCollector, Filter & Event-Generator, Aggregator and Storage. The Data-Collector collects the data
arriving from the sensors. Those data on the one hand will be stored in the Storage and on the other
hand they are forwarded to the Filter & Event-Generator. The Filter & Event-Generator checks if
the data match the corresponding reference values or are inside a range of permissible values. If the
Filter & Event-Generator detects a deviation from a reference value, it generates an event in which
the error is announced. This event is sent to the corresponding management block. The Aggregator
aggregates data and sends a summery called report of the state of the node to the corresponding
TIMaCS node in the next higher level.
The management block makes decisions based on the information it gets and acts autonomously.
The management block consists of the following components: Event/Data-Handler, Decision-Component, Controller, Controlled-Component and Execution-Component. The Event/Data-Handler receives messages from the monitoring block and from management blocks situated in lower layers. It
evaluates those messages, categorizes them and forwards them to the local Decision-Component if
the message contains information about an error. The Decision-Component decides what to do to
correct the error. This could be on the one hand to generate again an event, on the other hand it
could be to generate a command if the automatic error-correction is turned on. In the latter case a
report is generated in addition, so that the next higher level, which has more information, knows
what has happened and is able to correct the decision if necessary. Commands are forwarded down
in the hierarchy to the Delegate, which performs these commands then.
A monitoring block and a management block with their corresponding components are situated as
well on TIMaCS nodes in higher layers. The administrator node at the highest level contains in addition the administration interface, from which the administrator can have a look at all information
of the system and he/she has the possibility to intervene manually.
2 How to install TIMaCS?
The following sections will guide through the initial steps needed to get TIMaCS up and running
with a basic configuration.
2.1 System Requirements
For using TIMaCS, some additional software is needed. TIMaCS was tested on SuSE Linux Enterprise Server 11 SP1. The following list shows the dependencies and the versions that were used during testing:
• Linux OS – Kernel 2.6.32 (should work an any UNIX-like OS, though)
• Python v2.x, x≥6 – 2.6.8 (Package of SLES11 SP1)
• Python packages:
System Requirements
10/77
Tools for Intelligent System Management of
Very Large Computing Systems
◦ pycrypto – 2.6
◦ paramiko – 1.7.7.2
◦ Optional: pika, amqplib (already supplied with TIMaCS)
• RabbitMQ or compatible AMQP broker – RabbitMQ 2.8.4
◦ Erlang – R15B01
• XSB – 3.3.6
• swig – 1.3.36 (Package of SLES11 SP1)
• User "timacs" for running the daemons as a restricted user (the default)
If the virtualization component is used, please consult the dedicated Wiki page for its system requirements. If you don't use torque in your cluster, you can use virtualization without a batch-sys tem. If you use LSF, Load Leveler or another batch-system different from torque you can use
virtualization but then the virtual machines have to be started manually by the administrator or the
TIMaCS framework starts them automatically by using policies. This can be done via the command
line client of the TIMaCS-Delegate or directly via the command line client of the virtualization
component.
2.2 Step-by-step installation
In the following example we use a x86_64 machine running SuSE Linux Enterprise Server 11 SP1.
Python, swig, pcre and mysql were installed from the repositories.
For the default setup, we will use /opt/<software name>/<version>/ as the location for 3rdparty software, e. g. /opt/erlang/R15B01/.
Before installing, the following environment variables have been set:
export SRCDIR=/opt/src
export BUILDDIR=/opt/BUILD
export INSTALLDIR=/opt
2.2.1 TIMaCS
cd "$INSTALLDIR"
tar -xzf timacs.tar.gz
2.2.2 pycrypto
cd "$BUILDDIR"
tar -xzf "$SRCDIR/pycrypto-2.6.tar.gz"
cd pycrypto-2.6
python ./setup.py install
python ./setup.py test
Step-by-step installation
11/77
Tools for Intelligent System Management of
Very Large Computing Systems
2.2.3 paramiko
cd "$BUILDDIR"
unzip "$SRCDIR/paramiko-1.7.7.2.zip"
cd paramiko-1.7.7.2
python ./setup.py install
python ./test.py
2.2.4 Erlang
cd "$BUILDDIR"
tar -xzf "$SRCDIR/otp_src_R15B01.tar.gz"
cd otp_src_R15B01
./configure --prefix="$INSTALLDIR/erlang/R15B01" --enable-threads --enable-smpsupport --enable-kernel-poll --enable-hipe --enable-native-libs
make
make install
cd "$INSTALLDIR/erlang"
ln -s R15B01 default
2.2.5 RabbitMQ
cd "$INSTALLDIR"
mkdir rabbitmq
cd rabbitmq
tar -xzf "$SRCDIR/rabbitmq-server-generic-unix-2.8.4.tar.gz"
mv rabbitmq_server-2.8.4 2.8.4
ln -s 2.8.4 default
2.2.6 XSB
Attention: The configure script of XSB version 3.3.6 has a bug that prevents CFLAGS from being
propagated correctly. In the example setup below, a patch (setup/configure-xsb.patch) will
be applied to fix this problem for gcc as TIMaCS needs -fPIC on the example platform. If you are
using another compiler, you may need to adjust configure yourself.
FIX for SLES11 SP1 (java-1_6_0-ibm-1.6.0 does not provide jni_md.h):
touch /usr/lib64/jvm/java-1_6_0-ibm-1.6.0/include/linux/jni_md.h
Step-by-step installation
12/77
Tools for Intelligent System Management of
Very Large Computing Systems
cd "$BUILDDIR"
tar -xzf "$SRCDIR/XSB336.tar.gz "
cd XSB/build
patch < "$INSTALLDIR/timacs/setup/configure-xsb.patch"
JAVA_HOME=/usr/lib64/jvm/java CFLAGS=-fPIC XSBMOD_LDFLAGS=-fPIC LDFLAGS=fPIC ./configure --prefix="$INSTALLDIR/xsb" --with-dbdrivers
./makexsb
./makexsb install
cd "$INSTALLDIR/xsb"
ln -s 3.3.6 default
2.3 Getting started – initial setup and configuration
TIMaCS looks in predefined locations for its configuration and run-time files. All files of the
TIMaCS package are expected to be found at /opt/timacs/. The configuration is looked up under the config subdirectory (i. e. /opt/timacs/config/ by default).
Advanced Usage: If you have installed TIMaCS into a different location or want to use another configuration directory, create /etc/timacs.conf and set the variables TIMACS_ROOT and/or
TIMACS_CONFIG_PATH:
/etc/timacs.conf:
TIMACS_ROOT="/usr/local/timacs"
TIMACS_CONFIG_PATH="/etc/timacs/configuration_a"
2.3.1 Adjust configuration variables
File: $TIMACS_ROOT/config/global
If the flavor used when compiling XSB was not x86_64-unknown-linux-gnu, then adjust the variable TIMACS_XSB_CONFIG to reflect the actual path where XSB can find its settings.
If you do not want to use a "timacs" user for running the daemons, set TIMACS_USER accordingly.
There are many more settings that can be tuned according to your environment, for a default installation, nothing needs to be changed. If you are curious, the individual settings have some documentation inline.
2.3.2 Create a hierarchy
This step is optional. If you don't define any groups or hierarchy, a default hierarchy consisting of a
single host will be created.
File: $TIMACS_CONFIG_PATH/nodes/groups.csv
Define groups of nodes. Each line consists of the hostname of the master of the group followed by
each member in CSV format. The master should also be a member of the group. Add every host to
the group whose master will collect the metrics for the respective host.
Getting started – initial setup and configuration13/77
Tools for Intelligent System Management of
Very Large Computing Systems
config/nodes/groups.csv:
node_a,node_a,node0,node1,node2
node_b,node_b,node3,node4,node5
File: $TIMACS_CONFIG_PATH/nodes/master_hierarchy.csv
Define the hierarchy of the master nodes. Each line consists if the hostname of the master followed
by its children in CSV format.
config/nodes/master_hierarchy.csv:
node_m,node_a,node_b
2.3.3 Run setup.sh
cd "$TIMACS_ROOT/setup"
./setup.sh
The setup script will look for the needed 3rd-party software in the default locations and create symlinks under $TIMACS_ROOT/3rdparty/ if it is present. If you have installed at a different location, then you need to create the symlinks manually. TIMaCS needs to know the locations of erlang,
rabbitmq, and xsb. For a standard setup, this would look like this:
cd /opt/timacs/3rdparty
ls -l
drwxr-xr-x benchmarks
lrwxrwxrwx erlang -> /opt/erlang/default
lrwxrwxrwx rabbitmq -> /opt/rabbitmq/default
lrwxrwxrwx xsb -> /opt/xsb/default
2.3.4 Compile XSB interface
The Policy-Engine of TIMaCS consists of prolog-code running within the XSB-engine, and python
code (running within the Python environment) used to connect the XSB-engine with the AMQPbroker. The interface
cd "$TIMACS_ROOT/setup"
./compile_xsb_interface.sh
To test the interface, run timacsinterface from $TIMACS_ROOT/src/timacs/policyengine/xsbinterface/. You should see the following output:
./timacsinterface
[xsb_configuration loaded]
[sysinitrc loaded]
[Compiling ./edb]
[edb compiled, cpu time used: 0.0520 seconds]
[edb loaded]
Return a|b|c
Return 1|2|3
Getting started – initial setup and configuration14/77
Tools for Intelligent System Management of
Very Large Computing Systems
Return [1,2]|[3,4]|[5,6]
Return _h140|_h154|_h140
2.4 First run
At this point, the default configuration is in place and you may try starting TIMaCS to see if it
works. Simply execute timacs-start from the bin directory and all TIMaCS services should start
up. You can browse through the work directory to see if any problems show up in the log files.
Have a look at Chapter 4 for more detail on starting the daemons.
2.5 Installation of the Rule-Engine
To get the rule diagram editor and the node diagram editor running you have to install eclipse.
Eclipse Installation
We recommend that you install an eclipse "Eclipse Modeling Tools" on your workstation:
http://eclipse.org/
→ Download → "Eclipse Modeling Tools"
Next install the "Apache Commons IO" within your eclipse using the eclipse installer:
•
Open eclipse and select "Install New Software"" from the Help menu.
•
In the Install dialog:
◦ Add the update-site:
http://download.eclipse.org/tools/orbit/downloads/drops/R20100519200754/repositor
y/
◦ check "group items by category"
◦ select "orbit bundles by name: org.apache.*" / "Apache Commons IO"
Installing the timacs eclipse plugins
Next you have to install the timacs specific plug-ins with your eclipse. There is an update-site in the
source-code: src/ruleseditor/timacs-update-site/
Now start your eclipse and register the timacs update site:
•
Help → "Install New Software"
•
press the "Add button"
•
enter "timacs" as name (or whatever name you like)
•
use the "Local"-button and enter the path
<mysvn>/trunk/src/ruleseditor/timacs-update-site/
As soon as you have selected the timacs update site in the Install dialog you have to deselect the
"Group items by category" in the lower part of the dialog panel to see the available software. You
now should see "nodes", "Rules" and "viewer extensions" as available software. Check all three,
then press "Next" and follow the wizards instructions.
Installation of the Rule-Engine
15/77
Tools for Intelligent System Management of
Very Large Computing Systems
The editors should be installed now. Look now in the eclipse online help for the timacs specific entries to get started. You should especially consider going through the tutorial you will find in the online help or as a pdf document ruleEngineTutorial.pdf in the documentation directory of TIMaCS:
docs/.
The sources of the graphical rules and nodes editor can be found in the directory "src/ruleseditor".
This directory is a complete eclipse workspace which you can open within your eclipse IDE
(helios). After opening, simply import all projects. Some projects will show errors, which will disappear as soon as you choose the correct target platform "timacs", which should appear as an entry
in the target platform preference page.
As soon as the errors disappear you can start the GUI editor as an eclipse application.
Example for running tests
To run tests on a specific Rule-Engine, you have to:
1. Import the rules from that Rule-Engine, where the tests should run. Now you should have
the test rules in your project in sc.test.
2. Open sc/test/runAllTests.design_diagram
3. Add a monitor in your node diagram and connect it to every exchange/Rule-Engine that is
referenced in sc.test.runAllTests.
4. Start the monitor
5. perform sc.test.runAllTests on the Rule-Engine (right click sc/test/runAllTests.design →
perform rules)
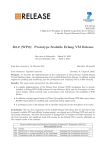
6. Check the results in the messages view. Use the message summary view to focus on the test
messages (context menu → focus)
The results in the message summary view could look like this:
Figure 2: Message Summary
Installation of the Rule-Engine
16/77
Tools for Intelligent System Management of
Very Large Computing Systems
2.6 Installation of the TIMaCS Graphical User-Interface
TIMaCS Graphical User-Interface (GUI) is available as packaged WAR file that can be dropped
into an existing Tomcat servlet container. Please find it at src/GUI/TimacsGUI.war.
The WAR file must be copied into the directory %CATALINA_HOME%\webapps. %CATALINA_HOME%
is the location of the Tomcat installation directory. After copying the file, Tomcat needs to be
restarted.
3 Configuration of TIMaCS
The configuration of TIMaCS is done via configuration files and via command line options.
3.1 Configuration Files
Configuration files can be located anywhere in the file system and can have any name as long as the
right path and file name is provided as a command line option to htimacsd. Usually configuration
files are collected in a directory called config. On the TIMaCS development system this directory is
located directly below the base timacs directory.
Use bin/htimacsd -h to see all command line options and configuration files that can be specified.
3.1.1 Configuration file for importers
Importers are configured within a separate configuration file. Use the --conf-importer= path/file to
specify it on the htimacsd command line.
Each line in the file describes one importer to start. The first parameter specifies the importer class
to run. The second parameter defines a logical number that defaults to 1 (if not specified) and is
used to allow to start more than one instance of the same importer class. Everything following the
equal sign “=” is interpreted as parameter for the importer where parameters are separated by a
colon “:”.To start more than one importer of the same type just add the index number after the importer’s name. Following the (optional) index number, separated by a equal sign “ =” the parameters
for the importer follow. The following example will illustrate the configuration file syntax:
[importers]
GangliaXMLMetric 1 = host_name=localhost:only_group=<False>:only_self=<False>
NagiosStatusLog = url="ssh://myname@nagios/var/log/nagios/status.log"
SocketTxt 1 = port_or_path="10000"
The first line following the mandatory [importers] statement starts a Ganglia importer thread with
the command line parameter --host_name=localhost, --only_group=<False> and
--only_self=<False>. The second line starts a Nagios importer thread with the --parameter
url="...". The third and last line starts a collectd importer thread (which is of class SocketTxt) that
listens on TCP port 10000.
Configuration Files
17/77
Tools for Intelligent System Management of
Very Large Computing Systems
Using the default setting all Importers run with an interval to poll the data source every 30 seconds.
The default can be changed within the importer configuration by appending poll_interval to the Importer definition, e. g.:
poll_interval_s=<seconds>
In the default configuration, the metrics collected by an importer will be published in the same
group that the master-node is member of. If this is not desired, e. g. if you want to monitor multiple
clusters from a single master-node, the subgroup parameter can be used to specify a child group
where the metrics of the importer shall be placed:
subgroup=groupname
In the following example, two importers will be started that retrieve metrics from the host ganglia.extern, the first connects to port 8649 and stores the values in the group cluster_a, the second uses
port 8650 and group cluster_b:
GangliaXMLMetric 1 =
host_name=ganglia.extern:port=8649:only_group=<False>:only_self=<False>:subgroup=cluster_a
GangliaXMLMetric 2 =
host_name=ganglia.extern:port=8650:only_group=<False>:only_self=<False>:subgroup=cluster_b
Ganglia Importer
Ganglia metrics are imported by starting an instance of the Ganglia Importer like already described
in the previous section.
Ganglia propagates metrics over the network using Broadcast, thus a Ganglia daemon running on a
node receives not only metrics that are originating from the local node but also remote metrics. The
following two settings can be enabled to recognize only metrics generated on the local host
(only_self) or with the local group (only_group). All other metrics will be ignored if one of these
flags is enabled.
only_group = <True|False>
only_self = <True|False>
Nagios Importer
The Nagios Importer uses SSH to connect to a host (usually localhost) and retrieves the Nagios logfile. The following example starts a Nagios Importer that reads the log-file from the Nagios default
location at /var/log/nagios/status.log and polls it every 15 seconds.
NagiosStatusLog = url="ssh://localhost/var/log/nagios/status.log":poll_interval_s=15
After retrieving the file it is parsed, Metrics are created and fed into the system by publishing them
within the metrics channel.
Burnin Importer
The burnin importer can be used for stress-testing the framework. It is able to generate a bunch of
metric values once a second. There are a set of configuration parameters that define which metrics
are to be generated, they are explained below.
Configuration Files
18/77
Tools for Intelligent System Management of
Very Large Computing Systems
SocketTxt Importer
This importer is usually used to import collectd metrics. There is a collectd plug-in that sends plain
text messages over a Berkeley socket UNIX or INET connection to the importer.
Collectd plug-in
Collectd (http://collectd.org) gathers statistics about the system it is running on and stores this data
or sends it to other applications. Collectd can be extended through plug-ins.
To install the htimacsd plug-in add the following lines to the configuration file collectd.conf. Note
that with the following configuration collectd finds the plug-in in the current directory. The plug-in
is located in src/timacs/importers/socket_txt/collectd_plugin/socket_txt_ writer.py. Thus it should
be linked or copied into the current directory.
...
# python plugin
<LoadPlugin python>
Globals true
</LoadPlugin>
<Plugin python>
ModulePath "/usr/lib64/python2.6"
ModulePath "."
Interactive false
Import "socket_txt_writer"
<Module socket_txt_writer>
<host "localhost">
#
path "/var/tmp/collectd"
port 10000
</host>
</Module>
</Plugin>
LoadPlugin python
This configuration loads the plug-in socket_txt_writer. All tags inside <Module socket_txt_writer>
are used as parameters for the plug-in. Only use path or port tag! The path tag tells the plug-in to
use a UNIX connection, with the port tag set a INET TCP connection is opened. The above configuration tells the plug-in to open a TCP connection to the htimacsd importer on TCP port 10000.
This matches with the htimacsd importer configuration line in config/importer.conf: SocketTxt 1 =
port_or_path="10000"
In scenarios where collectd is not running on the same host like htimacsd replace the “localhost”
setting in the host tag with the hostname where htimacsd is running. Note that in this scenario only
INET configurations can be used!
The plug-in requires Python 2.6 and was tested with collectd version 4.10.2.
Collectd-Configuration
Configuration Files
19/77
Tools for Intelligent System Management of
Very Large Computing Systems
collectd is running on all nodes which have the write_http plug-in configured that way, that all data
are send per HTTP POST with the path /collectd and as a list of JSON-objects (summarized to
blocks of about 4 kByte) to the port 5470 (chosen arbitrarily) of each rack head node.
<Plugin write_http>
<URL "http://<rack_head_node>:<http_collector_port>/collectd">
Format "JSON"
</URL>
</Plugin>
Type and content of the messages are given through the normal functionality of the write_http plugin. Messages, which are sent to the http-collector, look like this:
[{"dsnames":["value"], "dstypes":["counter"],
"host":"babe14f6-0e4b-4962-aa1c-8717fee13e56",
"interval":10, "kind":"timacs.http-collector.\/collectd",
"plugin":"cpu", "plugin_instance":"0", "time":1287733527,
"type":"cpu", "type_instance":"nice", "values":[2491311]},
{"dsnames":["value"], "dstypes":["gauge"],
"host":"babe14f6-0e4b-4962-aa1c-8717fee13e56",
"interval":10, "kind":"timacs.http-collector.\/collectd",
"plugin":"df", "plugin_instance":"root", "time":1287733527,
"type":"df_complex", "type_instance":"free", "values":[4504680000]},
{"dsnames":["value"], "dstypes":["gauge"],
"host":"babe14f6-0e4b-4962-aa1c-8717fee13e56",
"interval":10, "kind":"timacs.http-collector.\/collectd",
"plugin":"df", "plugin_instance":"root", "time":1287733527,
"type":"df_complex", "type_instance":"reserved", "values":[1146190000]},
...
]
Which values are measured (partly also how detailed) can be specified via the usual collectd.conf.
Likewise if hostname, FQDN or the content of /etc/uuid is used for the value of the host attribute.
3.1.2 Basic configuration file for Regression- and Compliance-Tests
Example:
The basic configuration file for Regression- and Compliance-Tests may look like this:
[General]
path to the timacsmodules = /opt/timacs/src/
commandsearchpath = /sbin:/usr/local/bin:/usr/bin:/bin
[Batchsystem]
name of the batchsystem = lsf
node for submitting jobs to the batch-system = /localhost
[Regressiontests]
# disable regression tests with: regressiontest-config-file = None
regressiontest-config-file = /opt/timacs/config/regressiontest.conf
Configuration Files
20/77
Tools for Intelligent System Management of
Very Large Computing Systems
[Compliancetests]
# disable compliance-tests with: enable compliance-tests = False
enable compliance-tests = True
# decide which rule engine to use
use lightweight filter and event generator = False
# relative path starting with directory timacs needed for
# "path to sensors" and "path to benchmarks"
path to sensors = timacs/compliancetests/sensors/
path to benchmarks = timacs/compliancetests/benchmarks/
# full path needed for "path to scripts" and for "reference value file"
path to scripts = /opt/timacs/src/timacs/compliancetests/scripts/
reference value file = /opt/timacs/config/reference_values.conf
This configuration file has four sections.
• A section General for information which is not specific to Compliance- or Regression-Tests.
• A section Batchsystem for information specific to the batch system.
• A section Regressiontests in which the file containing the configuration of Online-Regression-Tests is specified.
• A section Compliancetests for information which is only important for Compliance-Tests.
Compliance- and Regression-Tests are optional. They can be disabled or enabled in the configuration file. The following table explains the structure of this configuration file in detail.
Section General
path to the timacsmodules
commandsearchpath
complete path to the timacs-modules
paths where the system should look for external commands
Section Batchsystem
name of the batchsystem
abbreviation of the batch-system used (ll: Load Leveler, lsf: LSF,
pbs: Portable Batch System)
node for submitting jobs to the
name of the host, which is used to submit jobs via the batch-system
batch-system
Section Regressiontests
regressiontest-config-file
Section Compliancetests
enable compliance-tests
complete file name (including path) of the file containing the
configuration of Online-Regression-Tests or None if RegressionTests are disabled
Compliance-Tests are enabled and False if they are disabled
if the Rule-Engine doesn't work, the lightweight filter & eventuse lightweight filter and event generator may be used to make Compliance-Tests work
generator
False if the Rule-Engine is used and True if the lightweight filter &
event-generator is used
Configuration Files
True if
21/77
Tools for Intelligent System Management of
Very Large Computing Systems
path to sensors
path to benchmarks
path to scripts
reference value file
relative path to the directory containing the sensors used in
Compliance-Tests; the full path to this directory is obtained if the
path to the timacsmodules is put in front of this relative path
relative path to the directory containing the benchmarks used in
Compliance-Tests; the full path to this directory is obtained if the
path to the timacsmodules is put in front of this relative path
complete path to the directory containing the scripts used in
complex Compliance-Tests
if the lightweight filter & event-generator is used, the reference
values should be saved here (complete path to the corresponding
file)
3.1.3 File containing the configuration for Online-Regression-Tests
This file must have the name and the location mentioned in the option regressiontest-config-file of
the section Regressiontests in the basic configuration file or one has to change that option in the
basic configuration file to the name and location where the file containing the configuration for Online-Regression-Tests is.
Online-Regression-Tests must be configured before starting TIMaCS. All Online-Regression-Tests
must be configured in one file. Each Online-Regression-Test has to be given a name. This name
must be written in square brackets in the configuration file and it will be the name of the metric
generated by that Regression-Test. In principle this name is arbitrary, but for not losing the overview it is recommended to choose names which tell that this metric is generated by a RegressionTest and which original metric is used to derive the result. The lines following the name of the
Regression-Test contain the options of the Regression-Test as key = value pairs. In the following
the meaning of the keys is explained:
Name of the metric used by the Regression-Test.
Minimal time interval in seconds after which the same
Regression-Test is running again (a Regression-Test will
not run more frequently than a new value of the metric the
interval_s = ...
integer Regression-Test uses is generated. This option is especially
useful for Regression-Tests which use metrics which are
generated very frequently but the Regression-Test should
not run that often).
Name of the file (without ending .py) which contains the
algorithm_for_analysis = ... string
algorithm (also called Regression Analysis), which should
be used for the analysis of the data.
Name of the host (as path in the hierarchy), whose data
host name = ...
string
should be analyzed.
metric = ...
number_of_values_to_be_us
ed = ...
less_values_are_ok_as_well
Configuration Files
string
integer Number of data used for the Regression Analysis.
boolean True if the regression may be calculated with less data than
22/77
Tools for Intelligent System Management of
Very Large Computing Systems
= ...
specified in number_of_values_to_be_used and False if
the regression analysis must use exactly the number
specified in number_of_values_to_be_used.
Example:
[RegTestDiskSpeed]
metric = disk_speed
interval_s = 86400
algorithm_for_analysis = linear_regression
host name = /p2/d127
number_of_values_to_be_used = 25
less_values_are_ok_as_well = False
[RegTestMemErr]
metric = memory_errors
interval_s = 604800
algorithm_for_analysis = integrate_reg
host name = /p1/s055
number_of_values_to_be_used = 30
less_values_are_ok_as_well = True
For configuring thousands of Regression-Tests for big clusters it is recommended to write a script to
create the configuration file for Regression-Tests.
3.1.4 Configuration files for Compliance-Tests
It is recommended to use the configuration-tool for Compliance-Tests as explained in Chapter 3.5.
3.1.5 Configuration file for aggregators
Aggregators are defined within a configuration file. This file is specified with the command line option --conf-aggregator=path/file.
See the following example that shows how to define aggregators:
[aggregator_preset ThreeStateNumeric]
base_class = HostSimpleStateAggregator
state_OK = OK
state_WARNING = WARNING
state_CRITICAL = CRITICAL
cond_OK = ((metric.value < arg_warn) and (arg_warn <= arg_crit)) or ((metric.value >
arg_warn) and (arg_warn > arg_crit))
cond_WARNING = ((arg_warn <= metric.value < arg_crit) or (arg_crit < metric.value <=
arg_warn))
cond_CRITICAL = ((metric.value >= arg_crit) and (arg_warn <= arg_crit)) or ((metric.value <=
arg_crit) and (arg_warn > arg_crit))
max_age = 120
[aggregate]
Configuration Files
23/77
Tools for Intelligent System Management of
Very Large Computing Systems
load_one as grpsumc_load_one = GroupSumCycle:max_age=<30>
load_one as grpavgc_load_one = GroupAvgCycle:max_age=<30>
cpu_num as grpsumc_cpu_num = GroupSumCycle:max_age=<30>
cpu_num as grpmax_cpu_num = GroupMax
# demo for preset aggregator: warning if load_one exceeds 2, critical if it exceeds 5
load_one as overload_state = ThreeStateNumeric:arg_warn=<0.1>:arg_crit=<5.0>
overload_state as grp_overload_state = GroupTristateCycle:max_age=<130>
3.1.6 Configuration file for the hierarchy
Example:
/n101 m:/
/g1/n102 m:/g1
/g1/n103
/g2/n104 m:/g2
/g2/n105
/g2/n106
The configuration-file for the hierarchy has as many lines as there are nodes in the cluster. Each line
contains the name of one node. The node-name starts with a slash followed by the group names the
node belongs to. Each group is separated by its subgroup by a slash. This structure is analogous to a
hierarchical file-system where group-names correspond to directory-names and node-names correspond to filenames.
In the above example there are six nodes called n101, n102, n103, n104, n105, and n106. They are
distributed into two subgroups: g1 and g2. The nodes n102 and n103 belong to the group g1 and the
nodes n104, n105, and n106 belong to the group g2.
In addition the nodes, who are master-nodes have to be marked by the letter m followed by a colon
and then the name of the group, they are master of. In the above example one can see, that n101 is
the top-level master, n102 is the master of group g1 and n104 is the master of group g2.
3.2 Command line Options
Command line options for the TIMaCS-daemon:
The complete set of command line options can be retrieved with htimacsd -h. Currently there are:
--help, -h
show help message and exit
--amqp-flavor=<amqp|pika|local>
AMQP flavor for building the URLs.
Flavor of AMQP communication used. Note that some
flavors require additional software to be installed.
amqp: uses py-amqplib
pika: uses Pika (default), a pure Python implementation
for AMQP
local: do not use AMQP since all subscribers are on the
Command line Options
24/77
Tools for Intelligent System Management of
Very Large Computing Systems
same machine like publishers
--amqp-server=<hostname|IP>
Host name or IP of server which runs AMQP.
If not provided, the suitable master host according to the
hierarchy definition is automatically chosen (recommended).
--channel-prefix=<prefixString>
Prefix for channel names. This option allows to run
several htimacsd instances on the same machine without
interference.
--conf-aggregator=<path/file>
Path to aggregator configuration file.
If not specified no aggregators will be instantiated. Note,
that without aggregators no metric data will be
communicated from one hierarchy level to the other!
--conf-importer=<path/file>
Path to importer configuration file.
This file defines which importers should be started. Since
importers are the only source of sensor data it is almost
always needed to start at least one importer.
--direct-rpc-port=<port>
Port for the directRPC service.
htimacsd opens a regular Berkeley Socket port and
listens on it to receive RPS requests. Port range: 1...64 k.
Note that some ports are already chosen for other
services. Use "netstat -at" to check is a particular port is
available on your system.
--hostname=<hostname>
Enforce hostname for this htimacsd.
If not specified use the hostname set for this host. Specify
to override.
--hierarchy-cfg=<path/file>
Group hierarchy configuration file.
Required! It is absolutely essential to have a defined
hierarchy! Without hierarchy almost everything will not
work correctly.
--log-file=<path/file>
Log file. Default is stderr.
Specify a log file to omit all output be dumped to the
console.
--log-level=<debug|info|warning|
error|critical>
Log level. Default: warning.
Use to control the amount of log output that is written to
the output device.
--metric-database=<path/dir>
Metric database base directory path.
Default: $HOME/metrics
This specifies the path where the database stores it's data.
Command line Options
25/77
Tools for Intelligent System Management of
Very Large Computing Systems
This option must be set on all nodes that act as group
master according to the hierarchy. It is possible to specify
this option on all nodes. It will be ignored if no database
is run on the particular node.
--settings-file=<path/file>
Path to the configuration file containing settings for
Regression- and Compliance-Tests.
Further description of the file can be found in
Chapter 3.1.2.
--offreg_enabled=<yes|no>
Needed to initialize the Offline-Regression-Delegate to
be able to make TIMaCS start Offline-Regression-Tests
automatically when special conditions are met. Default:
no
For more information see Chapter 5.3.2.2.
--conf-delegate=<path/file>
Path to the configuration file containing settings for the
delegate. For more information see Chapter 3.6.
--conf-directory=<path/file>
Path to the configuration file containing the connection
information (host, port, virtual host and credentials) for
the AMQP Servers. Required by the Delegate. For more
information see Chapter 3.6.
Example invocation to start htimacsd on any node in the HLRS development cluster. Note that
$NODE should be replaced by the hostname of the node and $UID by the user ID of the user under
which htimacsd will be run.
bin/htimacsd \
--log-level=info \
--log-file=$HOME/timacs-$NODE.log \
--channel-prefix=$UID \
--hierarchy-cfg=`pwd`/config/hlrs_hierarchy.conf \
--direct-rpc-port=1$UID \
--conf-importer=`pwd`/config/hlrs_importer.conf \
--settings-file=`pwd`/config/settings_compliancetest.conf \
--metric-database=$HOME/timacs-$NODE-metrics
Command line options for the Compliance-Test configuration tool ( bin/configure_compliancetest):
--config-file=<path/file>
Path to the configuration file containing settings for Regressionand Compliance-Tests.
Further description of the file can be found in Chapter 3.1.2.
--config-dir=<path/dir>
Path to that directory where the configuration of ComplianceTests is/will be stored.
--log-file=<path/file>
Log file. Default : stderr.
Command line Options
26/77
Tools for Intelligent System Management of
Very Large Computing Systems
Specify a log file to omit all output be dumped to the console.
--log-level=<debug|info|
warning|error|critical>
Log level. Default: warning.
Use to control the amount of log output that is written to the output device.
Command line options for starting a Compliance-Test (bin/do_compliancetest):
--config-file=<path/file>
Path to the configuration file containing settings for
Regression- and Compliance-Tests. Default:
config/settings.conf
Further description of the file can be found in
Chapter 3.1.2.
--config-dir=<path/dir>
Path to that directory where the configuration of
Compliance-Tests is/will be stored. Default:
config/compliancetests/
--log-file=<path/file>
Log file. Default: stderr.
Specify a log file to omit all output be dumped to the
console.
--log-level=<debug|info|warning|
error|critical>
Log level. Default: warning.
Use to control the amount of log output that is written to
the output device.
--name=<name>
Name of the Compliance-Test, which should be
performed. The use of this option is mandatory!
--sensor-benchmark=<name of
sensor or benchmark>
Use this option if you want to query only one sensor or
benchmark of this Compliance-Test.
--hostlist=<”host1, host2, ...”>
Submit Compliance-Test to these hosts instead of those in
the configuration file.
--waiting-timeFirstLevelAggregator=<n>
Number of seconds which will be added to the maximum
timeout at the FirstLevelAggregator. Default: 0.0
--waiting-timeTopLevelAggregator=<n>
Number of seconds which will be added to the maximum
timeout at the TopLevelAggregator. Default: 0.0
--amqp-flavor=<amqp|pika|local>
AMQP flavor for building the URLs.
Flavor of AMQP communication used. Note that some
flavors require additional software to be installed.
amqp: uses py-amqplib
pika: uses Pika (default), a pure Python implementation
for AMQP
local: do not use AMQP since all subscribers are on the
same machine like publishers
Command line Options
27/77
Tools for Intelligent System Management of
Very Large Computing Systems
Command line options for starting an Offline-Regression-Test(bin/do_offline_regressiontest):
--help, -h
show help message and exit
--hierarchy-cfg=<path/file>
Group hierarchy configuration file.
It should be the same file than used for htimacsd.
--direct-rpc-port=<port>
Port for the directRPC service. Default: 9450
It should be the same port than used for htimacsd.
3.3 Rule-Engine Setup
To start a new Rule-Engine instance, use the script
bin/ruleengine --server=<SERVER>
where <SERVER> is the name of the amqp broker the Rule-Engine will get its messages from. To
find out about its configuration in more detail, try the option --help.
For configuring the rules a Rule-Engine must be running already. The easiest way is to start it as
part of the common TIMaCS startup process as laid out in Chapter 4.
Rule-Engine configuration from TIMaCS-Hierarchy:
The Rule-Engine configuration can be created from the TIMaCS-hierarchy-configuration-file. For
using this feature click in the New-wizard "Configuration Model" "generate from hierarchy config"
and "generate node structure diagram". Then choose the hierarchy-file in the file-browser.
Then a minimal node-configuration will be created, which contains the hierarchy levels level0 until
leveln. This node-configuration consists of a .nodesconfig and a .nodes-file. To be able to graphically manipulate the .nodes-file a .nodes_diagram will be generated. Now the rules have to be entered into the nodes-editor. If a configuration should be shared for the referenced rules (for their
configuration reader), the corresponding KeyGroups have to be entered into the .nodesconfig file.
Thus the nodesconfig-editor provides then in the context-menue different export-actions. If one
choses ToplevelNodeListConfig, one can put the configurations to all Rule-Engines at once.
3.4 Configuration of the Policy-Engine
The configuration of the Policy-Engine consists (i) of the configuration of the interfaces to AMQPhost, allowing to receive events or send commands, and (ii) configuration of the knowledge-base,
allowing to handle errors.
3.4.1 Configuring Interfaces
The Policy-Engine is configured by setting the parameters of the AMQP-host and the exchanges in
the file <timacs-install-dir>/config/policyengine.conf.
Configuration of the Policy-Engine
28/77
Tools for Intelligent System Management of
Very Large Computing Systems
Configuring the interfaces to the AMQP-host
After generating and testing the interfaces to XSB (see Chapter 2.3.4), the settings needed by the
start-up script need to be specified in the file <timacs-install-dir>/config/policyengine.conf. The
entry for policy-engine, is described by
Parameter
Description
xsbpath
The path to the XSB installation-directory.
prolog_rel_source_path
Specifies the location of the prolog files relative to the src/ path of
timacs (fix, always like in the following example).
mainfile
The name of main prolog file, that is executed after starting XSB and
contains the functionality of the TIMaCS policy-engine (fix, always like
in the following example).
Example for the policy-engine entry in policyengine.conf:
[policyengine]
xsbpath: /opt/timacs/3rdparty/xsb
prolog_rel_source_path: timacs/policyengine/timacs/
mainfile: main.pl
The entry for the AMQP-Broker used for communication is described by the following AMQP
related settings according to http://www.rabbitmq.com/uri-spec.html:
Parameter
Description
host
Hostname of the node, where the AMQP-Broker is located.
port
Port on which the AMQP-Broker is listening (5672 by default).
virtual_host The name of the virtual host used for partitioning different namespaces.
userid
Username to authenticate the client at the AMQP-Broker (guest by default).
password
Password corresponding to the username (the default password is guest for the the
userid guest ).
exchange
Name of the exchange used to send or receive messages. It depends on the
configuration-entry (<ENTRY-NAME> in the following example): incoming_event,
outgoing_event, incoming_command, outgoing_commands
routing_key Topic-filter to be applied on incoming messages. The routing-key # accepts all
topics.
Example for the AMPQ-Broker entry in policyengine.conf:
[<ENTRY-NAME>]
host: localhost
Configuration of the Policy-Engine
29/77
Tools for Intelligent System Management of
Very Large Computing Systems
port: 5672
virtual_host: /
userid: guest
password: guest
exchange: event
routing_key: #
The file policyengine.conf contains four AMQP-Broker entries. They are called
• incoming_event
• outgoing_event
• incoming_command
• outgoing_commands
(i. e. [<ENTRY-NAME>] has to be substituted by [incoming_event], [outgoing_event], and so on.)
The exchange-name for the entry [incoming_event] is events. The exchange-name for the entry
[incoming_command] is incoming_commands. The exchange-name for the entry
[outgoing_event] is policyengine. The exchange-name for the entry [outgoing_commands] is
commands.
In principle the names of the exchanges can be different from the here suggested ones, but one has
to make sure that the names are the same than used for the corresponding exchanges in the RuleEngine or in policyengine.conf of the superior policy-engine.
3.4.2 Configuration of the Knowledge-Base
The configuration of the knowledge-base contains:
The TIMaCS hierarchy, describing the hierarchical relationship of the TIMaCS framework.
The Error-Dependency, describing the error-dependency between components/componenttypes monitored by the TIMaCS framework.
The ECA-rules (Event, Condition, Action), describing events and conditions, which trigger
actions to handle errors.
These components are explained in the following subsections:
The TIMaCS hierarchy
The TIMaCS hierarchy describes the hierarchical relationship between TIMaCS-components and
resources monitored by the TIMaCS framework. The configuration file is located in
src/timacs/policyengine/timacs/dependency_table.pl .
The configuration of the hierarchy is done by setting the parameters for the predicate
IsInScope (ResourceType, ResourceIDList, ScopeType, ScopeID)
ResourceType describes type of the resource (cluster/node/host/…)
ResourceIDList is the list of resources within a particular scope
ScopeType describes the type of the scope (cluster/node/host/…)
ScopeID is the name or ID of the scope
Example:
isInScope(cluster, [timacs],organisation, hlrs).
Configuration of the Policy-Engine
30/77
Tools for Intelligent System Management of
Very Large Computing Systems
isInScope(group, [g1,g2], cluster, timacs).
isInScope(host, [n102,n103], group, g1).
isInScope(host, [n104,n105,n106], group, g2).
Error-Dependency
The Error-dependency describes the dependency between errors detected in resources that are
monitored by the TIMaCS framework. Such a configuration specifies the dependency between the
state of the components, the services, nodes, groups etc., and enables propagation of the error-states
to dependent components, as indicated by the scope.
The configuration file is located in src/timacs/policyengine/timacs/dependency_table.pl. The
configuration of the error-dependency is done by setting the parameters for the predicate
dependent (Scope_Kind, ScopeUUID, Resource_Kind, ResourceUUID, DependentResource_Kind,
DependencyList, DependencyType)
Scope_Kind describes the type of the scope (device,service, host, group, cluster).
ScopeUUID is the UUID (Universally Unique Identifier) of the scope. The reserved value
“self” corresponds to any UUID.
Resource_Kind is the type of the resource that is dependent on the state of resources listed in
DependencyList.
ResourceUUID is the UUID of the resource that is dependent on the state of resources listed
in DependencyList.
DependentResource_Kind is the type of the resources stated in DependencyList. “any”
corresponds to any type.
DependencyList is the list of all resources on which the resource with ResourceUUID is
dependent.
DependencyType is the type of dependency between the resource with ResourceUUID and
the resources declared in DependencyList. Dependency-type “required” states that all
resources declared in DependencyList are mandatory for the function of the resource.
Dependency-type “optional” states that all resources declared in DependencyList are
optional for the function of the resource.
For example the configuration entry dependent(host, self, host, self, any, [ping,ssh,cpu],
required). declares that the state of any resource of type “host” is dependent on states of services
‘ping’ and ‘ssh’, and on the state of the device ‘cpu’.
ECA-Rules
In order to handle error-events, the TIMaCS framework uses event-condition-action rules, that
select decisions (in terms of a command or action) as a reaction on received events and conditions
declared in ECA-Rules ("eca" predicate). Selected decisions in form of commands are send to
“delegates” of the corresponding resources, where these commands are executed.
The definition of the ECA-rules is stored in the configuration-file
src/timacs/policyengine/timacs/timacs_rules.pl.
The configuration of the ECA-rules is done by setting parameters for the predicate
eca (Kind, Scope_Kind, Resource_Kind, ResourceName, State, Conditions, Target, Action)
Configuration of the Policy-Engine
31/77
Tools for Intelligent System Management of
Very Large Computing Systems
is the kind of the message received (event/report/...)
Scope_Kind is the type of the scope (device/service/host/node/…)
Resource_Kind is the type of the resource that triggered the event
ResourceName is the name of the resource that triggered the event
State is the state of the resource at which the particular action should be executed
Conditions is a list of conditions which are evaluated on received events and must be true
for the execution of actions (as specified in "Action")
Target is the resource on which commands shall be executed
Action is the command which is send to that resource where it shall be executed
Kind
For example:
eca(‘timacs.event’, host, device, cpu, 2, [temperature > 65],[[kind, host], [name, self]],
[[command, shutdown]]).
This example declares that in case of an error-state 2 of the device cpu within the resource-type
host, and the condition that the temperature must be greater than 65, the command shutdown will be
send to the affected host.
3.5 Configuration of Compliance-Tests
Since Compliance-Tests are very complex, it is not recommended to configure them by creating and
editing the configuration file manually, because each sensor and each benchmark may have different options and additionally one and the same benchmark has different options depending if it is
send via the batch system or without using it.
For this reason TIMaCS provides a configuration tool for Compliance-Tests, configure_compliancetest, which can be found in the bin/ directory.
One is offered the following menu when performing configure_compliancetest:
• Check settings -> press 's'
With this function one can display and change the settings of the basic configuration file (see
Chapter 3.1.2).
Cave eat: The changes don’t take effect if the settings are changed while htimacsd is running. For the changes to take effect htimacsd has to be restarted if it is already running and
if there is no global file space, before restarting, the changed basic configuration file has to
be transferred to each TIMaCS-node.
• Show sensors and benchmarks available for Compliance-Tests -> press 'b'
This function shows a list of all available sensors and benchmarks.
• Show configured Compliance-Tests -> press 'l'
This function shows a list of all already configured Compliance-Tests and gives the option to
see the configurational details of one or more Compliance-Tests. That means it shows all
sensors and benchmarks requested by this Compliance-Test and on demand the values of all
options belonging to a sensor or benchmark can be shown.
Configuration of Compliance-Tests
32/77
Tools for Intelligent System Management of
Very Large Computing Systems
• Configure a Compliance-Test -> press 'c'
By using this function you can either change the configuration of an existing ComplianceTest or you can configure a new Compliance-Test. When configuring a Compliance-Test one
is asked amongst others on which node which sensor or benchmark should run. For remaining scalable even for very large clusters, one can not only specify a node or a list of nodes,
where the benchmark or sensor should be performed, but one can also specify a group of
nodes by their group-name if the sensor or benchmark should run on each node of this
group. Analogous one can specify the whole cluster by “/” if the sensor or benchmark should
be performed on all nodes of the cluster.
Configuring a Compliance-Test with this tool should be rather self-explanatory.
Configuration directory for Compliance-Tests
There is one directory for all configured Compliance-Tests. Each file in this directory corresponds
to a Compliance-Test. The name of the Compliance-Test corresponds to the file name but the file
name has in addition the ending .conf. There must be no other files and subdirectories in this directory. The name and location of this directory is arbitrary and must be made known to ComplianceTests via an option to the binaries configure_compliancetest and do_compliancetest. After
configuring and saving an Compliance-Test with the configuration tool one can see the corresponding file in this directory.
3.6 Configuration of the Delegate
The delegate is configured using a configuration file, that is passed to htimacsd via the --conf-delegate argument. This file contains some basic settings as well as the configuration of the different
adapters.
The basic configuration consists of the [delegate] section and contains following settings:
specifies the number of threads the Delegate uses.
•
workerCount
•
command_exchange
is the name of the exchange commands are sent to (usually “com-
mands”).
is the name of the exchange the delegate sends replies to, if a command
does not contain reply information.
•
response_exchange
•
adapterPackage
is the name of the package containing the implementation of all adapters
that are configured in this configuration file. All adapters have to be in a single package.
The remaining settings from the [delegate] section are only required for standalone use of the Delegate and not for use with htimacsd.
specifies if a special signal handler for Ctrl+C should be used. MUST be
•
signalHandler
false.
•
delegate_name
•
broker:
specifies the name of the delegate (first part of the command topic). Can be
set to an arbitrary value.
the path to the broker the delegate connects to. Can be set to an arbitrary value.
Configuration of the Delegate
33/77
Tools for Intelligent System Management of
Very Large Computing Systems
For each adapter there are two sections in the configuration file, an [adapter_x] and an [adapterConfig_x] section, where x is the number of the adapter. The [adapter_x] section contains the following settings:
is the name of the adapter module as well as the kind-specific part in the commands
for this adapter.
•
module
•
count
•
level
•
masterOnly
•
groupBinding
is the number of adapters that will be created and can be used concurrently by the
threads from the worker pool.
specifies the level of the nodes in the hierarchy that this adapter shall be activated on.
specifies if the adapter should be activated only on group master nodes ( True)
or on all nodes of the specified levels (False).
determines, if the adapter should be bound to the messaging system using a
wildcard group binding (True) or a delegate host binding (False). This setting is only relevant if masterOnly is set to True.
The [adapterConfig_x] section is passed unmodified to the adapter for initialization. It's meaning
depends on the adapter itself. In the case of the vmManager-adapter, it contains only a single setting:
•
url
specifies the URL of the XMLRPC interface of the vmManager.
Additionally, the delegate requires a directory, that contains connection information for the different
brokers used for communication. This directory is initialized using another configuration file that is
passed to htimacsd with the --conf-directory option. It consists of a section per broker, where the
section name is the path of the broker, i. e. the path of the node the broker is responsible for. For every broker the following settings are required:
•
host
specifies the host the broker is running on.
•
port
specifies the port the broker is listening to.
•
virtual_host
•
userid
specifies the virtual_host to be used, a mechanism to easily partition a broker
for different uses.
and password contain the required credentials.
3.7 Configuration of the Virtualization component
To configure the Virtualization component, please see this site:
http://mage.uni-marburg.de/trac/xge/wiki/Configuration
Configuration of the Virtualization component 34/77
Tools for Intelligent System Management of
Very Large Computing Systems
3.8 Configuration of the TIMaCS Graphical User-Interface
In order to make the GUI able to connect to the Master Node for getting all necessary data through
the Timacs Database Interface, the file %Appfolder%/config/configurations.jason needs
to be adapted.
The file content is simply:
{
masterNode: 'timacs',
port: 9450
}
masterNode
port
is the hostname or IP address of the Master-Node.
is the port number of Direct-Rpc-Server (9450 is default value).
3.9 Some tips and tricks for the configuration of the system
Configuration of Nagios
Nagios don't know anything about hierarchies, so it is advisable to configure it that way, that there
is one Nagios-Instance per group. This Nagios-Instance should only care for the nodes belonging to
this group.
4 Starting TIMaCS
The TIMaCS package includes start scripts for all its daemons and for some of the used 3rd-party
software, too. The scripts are located in the bin/rc/ directory and can be used to start and stop the
daemons individually. When starting daemons separately, one must pay attention to the dependencies that exist between them, though.
For convenient managing of the TIMaCS daemons, there exist two scripts in the bin/ directory that
start or stop all daemons according to the selected configuration in the proper order.
Start all configured daemons:
bin/timacs-start
Stop all configured daemons:
bin/timacs-stop
4.1 Starting Online-Regression-Tests
Online-Regression-Tests will be started by htimacsd according to their configured schedule. Refer
to Chapter 3.1.3 on how to configure Regression-Tests.
The log messages of TIMaCS show the initialization of the Online-Regression-Tests, and when
which Regression-Test is run. The result of an Online-Regression-Test is saved in the Storage.
Starting Online-Regression-Tests
35/77
Tools for Intelligent System Management of
Very Large Computing Systems
Caveat: Online-Regression-Tests run only on group masters. On each TIMaCS-master only those
Online-Regression-Tests run, which analyze metrics originating from a node inside its group.
Therefore TIMaCS should be started on all master nodes to make sure that each configured OnlineRegression-Test will run.
4.2 Starting a Compliance-Test
1. Check, if Compliance-Tests are enabled in the basic configuration file for Regression- and
Compliance-Tests (see Chapter 3.1.2) and if the other options concerning Compliance-Tests
in this file are configured correctly.
2. htimacsd has to run on all master nodes. If the basic configuration file for Regression- and
Compliance-Tests does not lie at the default location (config/settings.conf), the option
--settings-file <path/filename of the basic configuration file for Regression- and Compliance-Tests>
has to be used.
3. If you change the content or the location of the basic configuration file for Regression- and
Compliance-Tests, you have to restart htimacsd on all master-nodes to make TIMaCS aware
of the changes.
4. Configure some rules in the Rule-Engine, which test, if the results of the sensors and bench marks used by the Compliance-Test are correct.
5. Another prerequisite for running an Compliance-Test is, to have at least one configured
Compliance-Test. If the Compliance-Test, you want to run, is not yet configured, consult
Chapter 3.5 for an instruction how to do it.
6. Start a Compliance-Test with the command
bin/do_compliancetest --name <name of the Compliance-Test to be performed>
Use more options as you need (see Chapter 3.2, Section “Command line options for starting
a Compliance-Test” for a list of possible options).
7. To see the result of the Compliance-Test, run channel-dumper (see Chapter 5.1.1) on the
channel admin.out on the top-node.
36/77
Tools for Intelligent System Management of
Very Large Computing Systems
5 For Users: How to use TIMaCS
5.1 The Communication Infrastructure
To enable communication in TIMaCS, all TIMaCS nodes of the framework are connected by a scalable message based communication infrastructure supporting publish/subscribe messaging pattern,
with fault tolerant capabilities and mechanisms ensuring delivery of messages, following the Advanced Message Queuing Protocol (AMQP) [10] standard. Communication between components of
the same node is done internally, using memory based exchange channels bypassing the communication server. In a topic-based publish/subscribe system, publishers send messages or events to a
broker, identifying channels by unique URIs, consisting of topic-name and exchange-id. Subscribers use URIs to receive only messages with particular topics from a broker. Brokers can forward published messages to other brokers with subscribers that are subscribed to these topics.
The format of topics used in TIMaCS consists of several sub-keys (not all sub-keys need to be specified):
<source/target>.<kind>.<kind-specific>
• The sub-key source/target specifies the sender(group) or receiver(group) of the message,
identifying a resource, a TIMaCS node or a group of message consumers/senders.
• The sub-key kind specifies the type of the message (data, event, command, report, heartbeat,
…), identifying a type of the topic consuming component.
• The sub-key kind-specific is specific to kind, i. e., for the kind “data”, the kind-specific subkey is used to specify the metric-name.
The configuration of the TIMaCS communication infrastructure comprises the setup of the TIMaCS
nodes and AMQP based messaging middleware, connecting TIMaCS nodes according to the topology of the system. This topology is statically at the beginning of the system setup, but can be
changed dynamically by system updates during run time. To build up a topology of the system, a
connection between TIMaCS nodes and AMQP servers, the latter are usually co-located with
TIMaCS nodes in order to achieve scalability, must follow a certain scheme. Upstreams, consisting
of event-, heartbeat-, aggregated-metrics and report-messages, are published on messaging servers
of the superordinated management node, enabling faster access to received messages. Downstreams, consisting of commands and configuration updates, are published on messaging servers of
the local management node. This ensures that commands and updates are distributed in an efficient
manner to addressed nodes or group of nodes.
Using an AMQP based publish/subscribe system, such as RabbitMQ [11], enables TIMaCS to build
up a flexible, scalable and fault tolerant monitoring and management framework, with high interoperability and easy integration.
The Communication Infrastructure
37/77
Tools for Intelligent System Management of
Very Large Computing Systems
5.1.1 channel_dumper – a tool to listen to an AMQP-channel
A tool that can attach to a particular AMQP channel, subscribe with a topic and dump every message it receives. In normal mode only the TIMaCS specific payload of the messages is dumped in a
readable format, as used inside the monitoring component. In "raw" mode the entire AMQP message is displayed.
Usage: channel_dumper [options]
Options:
-h, --help
show this help message and exit
--channel=CHANNEL
URL of channel to listen to
--raw
Dump raw AMQP messages
--topic=TOPIC
topic to subscribe, default matches all topics
5.1.2 RPC for listing the running threads
TIMaCS provides a remote procedure call for listing the running threads.
Usage:
python direct_rpc_client.py localhost list_threads
or
nc localhost 9450
list_threads
5.1.3 RPC to display channel statistics
TIMaCS provides a remote procedure call for displaying channel statistics.
Usage:
PYTHONPATH=... direct_rpc_client.py localhost channel_stats
5.2 Monitoring
The TIMaCS Monitoring Infrastructure is built out of following components and abstractions:
1. Channel: An abstraction for communication paths between monitoring components. Uses
topic based publish/subscribe semantics and currently implements a local channel (usable
among threads inside the python process) and an AMQP channel.
2. Importer: Generic metrics publisher class from which all metric generators should inherit.
Publishes to one or more channels with a hierarchy-dependent topic.
Monitoring
38/77
Tools for Intelligent System Management of
Very Large Computing Systems
3. Consumer: Generic consumer class. Subscribes to a channel with a topic and calls an event
handler for each received message.
4. Database: A consumer application that receives metrics and stores them on disk. A database
instance is responsible for a group and contains the metrics of that group.
5. Aggregator: Class derived from consumer. Subscribes to channels and aggregates the received metrics to new derived metric values which it then publishes.
6. Hierarchy: Configures and describes the monitoring hierarchy of the system. This is represented by an object hierarchy containing Group and Host objects. The hierarchy is instantiated in each timacsd process.
The monitoring capability of a TIMaCS node provided in the monitoring block, consists of DataCollector, Storage, Aggregator, Regression-Tests, Compliance-Tests and the Filter & Event Generator, as shown in the figure below.
The components within the monitoring block are connected by messaging middleware, enabling
Figure 3:Structure of TIMaCS-Components
flexible publishing and consumption of data according to topics.
Monitoring
39/77
Tools for Intelligent System Management of
Very Large Computing Systems
5.2.1 Data-Collector
The Data-Collector collects metric data and information about monitored infrastructure from different sources, including compute nodes, switches, sensors or other sources of information. The collection of monitoring data can be done synchronous or asynchronous, in pull or push manner,
depending on the configuration of the component. In order to allow integration of various existing
monitoring tools (like Ganglia [4] or Nagios [12]) or other external data-sources, we use a plug-inbased concept, which allows the design of customized plug-ins, capable to collect information from
any data-source, as shown in the figure below. Collected monitoring data consist of metric values,
and are semantically annotated with additional information, describing source location, the time,
when the data were received, and other relevant information for data processing. Finally, the annotated monitoring data are published according to topics, using AMQP based messaging middleware, ready to be consumed and processed by other components.
5.2.2 Storage
The Storage subscribes to the topics published by the Data-Collector, and saves the monitoring data
in the local round robin database. Stored monitored data can be retrieved by system administrators
and by components analyzing the history of the data, such as Aggregator or Regression-Tests.
5.2.2.1 Usage of the Database API
The whole database system must be regarded as being distributed on many nodes. Only master
nodes of groups store data. Each master node database is responsible for the metrics originating
from its group. The database has a API interface that provides two methods to retrieve data. Both
methods decide internally from which master node data will be gathered. Thus the API user does
not have to care on which host a particular metric is stored.
•
To see which hosts data is available on the local machine use the following method.
hierarchy = Hierarchy(own_hostname, "/hierarchy/config/file.conf")
db = MetricDatabase("/metric/database/path", hierarchy=hierarchy)
db.getHostNames(group_path)
◦ own_hostname: hostname where this application is running (must appear in hierarchy
file)
◦ group_path: group the requested host is in
◦ return: a list containing hostnames, e. g. ['deepsky']
Please note that for the topmost group the grouppath is called "/".
•
To retrieve the available metric names of a particular host use:
hierarchy = Hierarchy(own_hostname, "/hierarchy/config/file.conf")
db = MetricDatabase( "/metric/database/path", hierarchy=hierarchy)
db.getMetricNames(group_path, host_name)
◦ host_name: hostname of host from which metric is requested
Monitoring
40/77
Tools for Intelligent System Management of
Very Large Computing Systems
◦ return: a list of available metric names, e. g. ['cpufreq', 'echo', 'log']
•
The following method retrieves the last stored metric of a particular type.
hierarchy = Hierarchy(own_hostname, "/hierarchy/config/file.conf")
db = MetricDatabase( "/metric/database/path", hierarchy=hierarchy)
db.getLastMetricByMetricName(group_path, host_name, metric_name)
◦ metric_name: name of metric of which further information should be retrieved
◦ return: a Metric object in string representation, e. g.
Metric(name='cpufreq', value=800000000.0, source='collectd', \ host='deepsky',
time=1301645116, type='cpufreq')
•
The last method retrieves Records. Records are time, value pairs.
hierarchy = Hierarchy(own_hostname, "/hierarchy/config/file.conf")
db = MetricDatabase("/metric/database/path", hierarchy=hierarchy)
db.getRecordsByMetricName(group_path, host_name, metric_name, start, end, step)
◦ start: time in seconds since epoch (1.1.1970) of first Record
◦ end: time in seconds since epoch (1.1.1970) of last Record
◦ step: seconds between successive Records
◦ return: a list of Record objects in string representation, e. g.
[LOG.Record(1301645072000000000L, '5', 'uc_update: Value too old: \
name = deepsky/echo-absolute/absolute-value; value time = 1301645072; \
last cache update = 1301645072;'), ...]
Please note that there are two kinds of Records: "LOG" and "RRD". The RRD database stores numerical values like integer, float and long. The LOG database is used for string type values.
5.2.2.2 mdb_dumper – a command line tool to retrieve information from the
Storage
This tool is used to retrieve the time, value pairs and other information from the metric database.
The metric database holds the last (most recent) metric supplied by a particular host and stores time,
value pairs (currently) in a time series database. The metric database also handles log data that is
put into a log database.
Since hosts can be arranged in groups, a group name must be used to select metrics. If no group
name is supplied it defaults to "/" which means all groups in this universe.
Possible queries are:
•
hosts: return all host names for which metrics are stored in this database
•
metrics: return all metrics that are stored for a particular host
•
last metric: return the last metric of a particular type from a particular host
•
records: return a list of records of numerical or log values
Monitoring
41/77
Tools for Intelligent System Management of
Very Large Computing Systems
Invoking the metric database dump tool.
bin/mdb_dumper --help
Usage: mdb_dumper [options]
Options:
-h, --help
show this help message and exit
--metric-database=DATABASE_PATH
metric database base directory path
--group=GROUP_PATH
name of group for which metric data should be retrieved
--hostname=HOST_NAME
hostname for metric data
--hierarchy-cfg=HIERARCHY_CFG
Group hierarchy configuration file.
--metric-name=METRIC_NAME
name of metric to retrieve
--start=START
start (time in s) with first record
--end=END
end (time in s) with last record
--step=STEP
step (time in s) of records
Examples for the usage of mdb_dumper:
Return a list of host names which are currently stored in the local database.
bin/mdb_dumper \
--metric-database=/tmp/timacs/metrics \
--hierarchy-cfg=../config/local_hierarchy_config \
--group="/"
Return a list of available metrics for a particular host.
bin/mdb_dumper \
--metric-database=/tmp/timacs/metrics \
--hierarchy-cfg=../config/local_hierarchy_config \
--group="/" \
--hostname=deepsky
Return a single metric (the most recently stored) of a particular host use.
bin/mdb_dumper \
--metric-database=/tmp/timacs/metrics \
--hierarchy-cfg=../config/local_hierarchy_config \
--group="/" \
--hostname=deepsky \
--metric-name=cpufreq
Monitoring
42/77
Tools for Intelligent System Management of
Very Large Computing Systems
The RRD/LOG database stores records. Records contain time (seconds since epoch) and either
LOG (output, value as strings) or RRD (numerical, integer or float) data. Thus the query might return a list of RRD or LOG records:
[LOG.Record(1296472623000000000L, 'CRITICAL', 'DISK CRITICAL - free space: / 2098 MB (5%
inode=96%):'), ...]
[RRD.Record(1297768738000000000L, 0.080000000000000002), ...]
Example invocation to retrieve metric cpufreq from host deepsky where the database files are located in /tmp/timacs/metrics/<hostname>/<metric-name>:
bin/mdb_dumper \
--metric-database=/tmp/timacs/metrics \
--hierarchy-cfg=../config/local_hierarchy_config \
--group="/" \
--hostname=deepsky \
--metric-name=cpufreq \
--start=0 \
--end=1500000000
//deepsky/cpufreq
[RRD.Record(1296745141000000000L, 800000000.0), RRD.Record(1296745141000000000L,
800000000.0),
<snipped for readability>
RRD.Record(1297158586000000000L, 800000000.0)]
All time values are in seconds since epoch (1. Jan 1970, also see: date "+%s"). If start ≥ end time
the last, most current metric object (Metric) will be retrieved.
The Python output is created in a way that is can be feed back to the eval() function to recreate an
identical object.
Example, an interactive Python session.
PYTHONPATH=$PYTHONPATH:`pwd`/src python
>>> from timacs.databases.metric.rrd import RRD
>>> myRRDRecord = eval("RRD.Record(1296745141000000000L, 800000000.0)")
>>> myRRDRecord
RRD.Record(1296745141000000000L, 800000000.0)
>>>
5.2.2.3 A Multinode Example
Imagine the following trivial scenario. Two hosts:
1. deepsea: topmost master
2. deepsky: master of group g1 and only host in g1, running gmond and collectd (on port
10000) importers
The database will be located on both hosts below /tmp/timacs/metrics.
Configuration
Monitoring
43/77
Tools for Intelligent System Management of
Very Large Computing Systems
config/local_hierarchy_config: deepsea m:
/g1/deepsky m:/g1
Start htimacsd on host deepsky:
bin/htimacsd \
--metric-database=/tmp/timacs/metrics \
--import-ganglia-xml=deepsky \
--import-socket-txt=10000 \
--hostname=deepsky \
--hierarchy-cfg=../config/local_hierarchy_config
Start htimacsd on host deepsea:
bin/htimacsd \
--metric-database=/tmp/timacs/metrics \
--import-ganglia-xml=localhost \
--import-socket-txt=10000 \
--hostname=deepsky \
--hierarchy-cfg=../config/local_hierarchy_config
To retrieve Records
Run mdb_dumper on host deepsea to retrieve Metric "cpufreq" of host deepsky located in group g1.
Note that the metrics of deepsky are stored on the master of the group which is in this case also host
deepsky.
bin/mdb_dumper \
--metric-database=/tmp/timacs/metrics \
--hierarchy-cfg=../config/local_hierarchy_config \
--hostname=deepsky \
--metric-name cpufreq \
--group="/g1" \
--start=0 \
--end=1400000000
To retrieve the last Metric object
Run mdb_dumper on host deepsea:
bin/mdb_dumper \
--metric-database=/tmp/timacs/metrics \
--hierarchy-cfg=../config/local_hierarchy_config
--hostname=deepsky \
--metric-name cpufreq \
--group="/g1"
To retrieve aggregated Metrics
Aggregatod Metrics of group g1 are stored on host deepsea which is master of all groups (universe).
Run mdb_dumper on host deepsea to retrieve Metric "grpmaxc_load_one":
bin/mdb_dumper \
--metric-database=/tmp/timacs/metrics \
--hierarchy-cfg=../config/local_hierarchy_config \
--hostname=g1 \
Monitoring
44/77
Tools for Intelligent System Management of
Very Large Computing Systems
--metric-name=grpmaxc_load_one \
--group="/"
5.2.3 Aggregator
The Aggregator subscribes to topics produced by the data collector, and aggregates the monitoring
data, i. e. by calculating average values, or the state of certain granularity (services, nodes, nodegroups, cluster etc.). The aggregated information is published with new topics, to be consumed by
other components of the same node (i. e. by the Filter & Event-Generator), or those of the upper
layer.
5.2.4 Filter & Event-Generator
The Filter & Event-Generator subscribes to particular topics produced by the Data-Collector, Aggregators, and Regression- or Compliance-Tests. It evaluates received data by comparing it with
predefined values. In case that values exceed permissible ranges, it generates an event, indicating a
potential error. The event is published according to a topic and sent to that components of the management block, which subscribed to that topic.
The evaluation of data is done according to predefined rules, defining permissible data ranges.
These data ranges may differ depending on the location, where these events and messages are published. Furthermore, the possible kinds of messages and ways to treat them may vary strongly from
site to site and in addition it depends on the layer the node belongs to.
The flexibility obviously needed can only be achieved by providing the possibility of explicitly formulating the rules by which all the messages are handled. TIMaCS provides a graphical interface
for this purpose, based on eclipse Graphical Modelling Framework [13].
Since the Filter & Event Generator works with predefined rules, it is also called Rule-Engine. For
more information see Chapter 5.4.1.
5.3 Preventive Error Detection
5.3.1 Compliance-Tests
What is a Compliance-Test?
Compliance-Tests enable early detection of software and/or hardware incompatibilities. They verify,
if the correct versions of firmware, hardware and software are installed and they test, if every component is on the right place and working properly. Compliance-Tests are only performed on request
since they are designed to run at the end of a maintenance interval or as a preprocessor to batch
jobs. They may use the same sensors as used for monitoring but additionally they allow for starting
benchmarks.
Compliance-Tests check if the system fulfills special requirements. In practice this means that actual values are compared with reference values and any deviation is considered as an error. Thus
one can verify, if the system is in the desired state.
Preventive Error Detection
45/77
Tools for Intelligent System Management of
Very Large Computing Systems
The focus of Compliance-Tests is to test compatibility. This may refer to the existence of hardware
and software, each with the correct version, but it may as well answer the question if a node is suitable for the performance of a special job.
A Compliance-Test checks metrics, which could be checked through monitoring as well. But in contrast to metrics usually monitored these metrics change their state only in rare occasions (e. g. when
an update is done or the hardware is changed). Hence those metrics do not need to be checked regularly. Which metrics are checked by a Compliance-Test can be configured individually. Examples
for such metrics are checks of firmware- or software-versions, the size of the main memory, or the
availability of program-libraries. In addition Compliance-Tests can be used to run larger tests like
benchmarks.
For not needing to send after an upgrade thousands of small Compliance-Tests, which check if everywhere the right software in the right version is installed, Compliance-Tests offer the possibility
to request many metrics within one Compliance-Test. Thus for example one can configure a Compliance-Test “Hardware”, which checks if the hardware found by the system is the same than mentioned in the inventory or if a node is not or not correctly connected to the cluster. Furthermore, one
can configure a Compliance-Test “Software”, which checks, if on all nodes the required software is
installed in the right version. Other Compliance-Tests could be for example “Node suitable for serial job” and “Node suitable for parallel job”, which check if the necessary services, which are
needed for that job, have been started on that node and are working properly. The difference between such two Compliance-Tests “Node suitable for serial job” and “Node suitable for parallel
job” is, that the latter checks in addition if MPI is working, whereas serial jobs may run on nodes,
whose MPI does not work.
How does a Compliance-Test work?
As mentioned above, Compliance-Tests consist of small checks and of benchmarks. These small
checks, which test if the system fulfills special requirements (e. g. a driver is available in a special
version) are called sensors. Routines, which take a longer time, which test for example the performance of the communication-network, are called benchmarks. Benchmarks as well as sensors are
implemented via an open interface, so that it is easy to add further sensors and benchmarks to the
TIMaCS framework. How one can implement a new sensor or benchmark is explained in Chapter 5.7.4.
When all needed sensors and benchmarks are implemented, Compliance-Tests can be configured
like described in Chapter 3.5. Compliance-Tests are started at the Toplevel-TIMaCS-master as described in Chapter 4.2. The result of the Compliance-Test is send via the publish/subscribe-system
again to the Toplevel-master.
When performing do_compliancetest, the program at first sends the configuration-information of
the requested Compliance-Test to the Toplevel-Delegate, which was started, when starting htimacsd. This special Delegate takes the configuration-information and publishes a command-message for each requested sensor and each requested benchmark for each requested node to the
Delegate on the corresponding TIMaCS-master-node, which is the group master of that node on
which the sensor or benchmark is requested. The sensor or benchmark is then performed per ssh on
the requested node and sends its result back to the Delegate on the group master. For there might be
a case, where the sensor or benchmark does not deliver a result, and neither an error-message, a
Preventive Error Detection
46/77
Tools for Intelligent System Management of
Very Large Computing Systems
timer is started when the request for the sensor or benchmark is send per ssh. The length of this
timer can be configured individually for each sensor and each benchmark on each node. If the sensor or benchmark sends its result before the timer expires, the result including possible error-messages is published to the metric-channel and forwarded to the storage, where it is stored as well as
forwarded to the Rule-Engine, where it is analyzed. If the sensor or benchmark have not send any
result when the timer expires, the message, that the timer expires before the sensor or benchmark responded, is sent as error-message. This way it is guaranteed that there is a response even if the system or node is in an erroneous state and the administrator does not need to wait forever for the
Compliance-Test to finish but can react on the error.
In the Rule-Engine one can configure rules, which automatically analyze the results of the sensors
and benchmarks if they are correct and create an event-message for each sensor and each benchmark containing the result of the check (OK or ERROR) and, if any, all the error-messages, which
came as a response of the sensor or benchmark. It is not only an error if a sensor or benchmark produces error-messages, but also if a result without error-messages is provided, which does not meet
the expectations (i. e. the actual value does not equal the reference value or does not lie inside the
range of tolerance).
On the contrary to the usual monitoring, where only an event is created, when an error is found, in
the case of Compliance-Tests for every result an event must be created because the information if
the test is ready is needed.
All these generated events inside a TIMaCS-group are collected by the First-Level-Aggregator located at the TIMaCS-master of this group. It counts the correct results and the total number of expected results in its group. If all results came in or if the timer of the First-Level-Aggregator is
expired, the aggregated result consisting amongst others of the number of correct results and of all
error-messages is published and sent to the Top-Level-Aggregator.
The Top-Level-Aggregator located at the Top-Level-TIMaCS-node collects the aggregated messages of the First-Level-Aggregators and aggregates the result further before the end-result is sent to
the channel admin.out.
Figure 4 shows a schematic view on Compliance-Tests.
Preventive Error Detection
47/77
Tools for Intelligent System Management of
Very Large Computing Systems
Figure 4: Principle of work of Compliance-Tests
5.3.1.1 Benchmarks
Currently there are four benchmarks in use by Compliance-Tests. The interfaces to benchmarks is
written as an open interface. Hence one can at any time include a new benchmark if there is a need
to do it.
At the moment four benchmarks are implemented into TIMaCS for the use with Compliance-Tests:
• hdd_speed
• stream
• memory_tester
• beff
Before benchmarks can be used, they need to be compiled at first. After compilation the compiled
binary has to be moved to the directory src/timacs/compliancetests/benchmarks/bin.
All benchmarks return a python tuple which consists of two elements: The value of the result and a
string, which may contain an error-message. If no error occurred, the string is empty. Each benchmark also creates a file where one can find additional information about the execution of the pro-
Preventive Error Detection
48/77
Tools for Intelligent System Management of
Very Large Computing Systems
cesses. This file has the name <benchmark_name>.log and can be found in the working directory
of the benchmark, which is stated in its configuration (see option workdir).
In the following sections each benchmark is explained:
1. Speed of a hard disk
This benchmark measures the speed of a hard disk drive. The utility to provide the information for
this benchmark is dd. The benchmark gives the possibility to determine average speed of a hard
drive. It creates a file filled with random numbers. Therefore the output is a measure for the speed
of writing random characters.
Compilation
This benchmark works without compilation.
Parameters
This benchmark requires the following parameters:
• the amount of bytes (one block)
• the amount of blocks to read and write at once
• the path to the working directory
For example, we can specify 512k as the amount of bytes and 1000 as the amount of blocks. As a
result we will get a 512 MB-file.
Result
The resulting file includes the following information:
Random values:
1000+0 records in
1000+0 records out
524288000 bytes (524 MB) copied, 98.5273 seconds, 5.3 MB/s
The resulting value is a speed of the HDD in MBytes per second.
2. Stream
The second benchmark is the well-known benchmark Stream, which measures the bandwidth of the
main memory. The benchmark Stream consists of several tests: copy, scale, sum and triad. Each test
performs the corresponding action on a data array in the main memory to calculate the bandwidth:
Name
COPY
SCALE
SUM
TRIAD
Action
a(i) = b(i)
a(i) = q * b(i)
a(i) = b(i) + c(i)
a(i) = b(i) + q * c(i)
Compilation
To compile this benchmark the following command has to be executed:
Preventive Error Detection
49/77
Tools for Intelligent System Management of
Very Large Computing Systems
• gcc -fopenmp -D_OPENMP [path to source file] -o [path to binary file]
(on a 32 bit machine)
• gcc -mcmodel=medium -fopenmp -D_OPENMP [path to source file] -o [path to binary
file]
(on a 64 bit machine)
You can also use the gcc optimization flags:
• gcc [-mcmodel=medium] -O[1–3] -fopenmp -D_OPENMP [path to source file] -o [path to
binary file]
Parameters
To run this benchmark one should specify the following parameters:
•
•
•
•
•
the number of elements in a data array
the number of times to run each test
the offset for a data array
the maximum number of threads in a parallel region
the path to the working directory
For example, we can specify 25468951 as the number of elements in the data array, 16 as the number of times to run each test, 356467 as the offset in the data array and 8 as the number of threads.
Result
The resulting file includes the following information:
STREAM version Revision: 5.9
This system uses 8 bytes per DOUBLE PRECISION word.
Array size = 25468951, Offset = 356467
Total memory required = 582.9 MB.
Each test is run 16 times, but only
the best time for each is used.
————————————————————Number of Threads requested = 8
————————————————————Printing one line per active thread….
Printing one line per active thread….
Printing one line per active thread….
Printing one line per active thread….
Printing one line per active thread….
Printing one line per active thread….
Printing one line per active thread….
Printing one line per active thread….
————————————————————Your clock granularity/precision appears to be 1 microseconds.
Each test below will take on the order of 116895 microseconds.
(= 116895 clock ticks)
Increase the size of the arrays if this shows that
you are not getting at least 20 clock ticks per test.
Preventive Error Detection
50/77
Tools for Intelligent System Management of
Very Large Computing Systems
————————————————————WARNING – The above is only a rough guideline.
For best results, please be sure you know the
precision of your system timer.
Function
Copy:
Scale:
Add:
Triad:
Solution Validates
Rate (MB/s)
2964.3064
2870.1658
3260.8426
3209.4616
Avg time
0.1392
0.1440
0.1898
0.1932
Min time
0.1375
0.1420
0.1875
0.1905
Max time
0.1435
0.1503
0.1942
0.2012
The resulting value is an average of the memory bandwidth from all four methods (copy, scale, add
and triad).
3. Memory-tester
The third benchmark is called memory-tester and is used to find memory errors on a DIMM. It is
based on the Stream-benchmark and uses similar operations. The memory-tester allocates a rather
big amount of memory and performs different operations on this data array to check whether the
memory is in order or not.
Compilation
To compile this benchmark please execute the following command:
• gcc -fopenmp -D_OPENMP [path to source file] -o [path to binary file]
(on a 32 bit machine)
• gcc -mcmodel=medium -fopenmp -D_OPENMP [path to source file] -o [path to binary
file]
(on a 64 bit machine)
You can also use gcc optimization flags:
• gcc [-mcmodel=medium] -O[1–3] -fopenmp -D_OPENMP [path to source file] -o [path to
binary file]
Parameters
To run memory-tester, one needs to specify:
•
•
•
•
the amount of memory to test
the number of times to run each test
the maximum number of threads in the parallel region
the path to the working directory
For example one can specify 64 mb as the amount of memory to test, 1 as the number of times to
run each test and 4 as the maximum number of threads in the parallel region.
Result
The resulting file includes the following information:
This system uses 8 bytes per DOUBLE PRECISION word.
Preventive Error Detection
51/77
Tools for Intelligent System Management of
Very Large Computing Systems
Array size = 2546895
Total memory required = 58.3 MB.
———————Number of Threads requested = 4
Printing one line per active thread….
Printing one line per active thread….
Printing one line per active thread….
Printing one line per active thread….
———————Copy test #1: passed
———————Copy test #2: passed
———————Copy test #3: passed
———————Scale test: passed
———————Add test: passed
———————Triad test: passed
———————-
The resulting value is the total number of memory errors.
4. beff
The forth benchmark is also a well-known benchmark—beff. It measures the accumulated bandwidth
of a communication network of a parallel and/or distributed computing system. Several message
sizes, communication patterns and methods are used.
Compilation
To compile this benchmark please execute the following command:
mpicc -o [path to binary file] -D MEMORY_PER_PROCESSOR=[the amount of memory] [path to
source file] -lm
Parameters
To run the beff-benchmark, one needs to specify several parameters:
• the number of processes to start
• the maximum number of threads in the parallel region
For example one can specify 4 as the number of processes to start and 4 as the number of threads.
Result
The resulting file includes the following information:
b_eff = 481.172 MB/s = 120.293 * 4 PEs with 512 MB/PE on Linux p1s108 2.6.16.60–0.34+lustre.1.6.7.2+bluesmoke+perfctr.2.6.x-smp #1 SMP Fri Jan 16 08:59:01 CST 2009 x86_64
The resulting value is the bandwidth of the communication network in MBytes per second.
Preventive Error Detection
52/77
Tools for Intelligent System Management of
Very Large Computing Systems
5.3.2 Regression-Tests
What is a Regression-Test?
Regression-Tests help cutting down on system outage periods by identifying components with a
high probability of soon failure. Replacing those parts during regular maintenance intervals avoids
system crashes and unplanned downtimes.
To get an indication, if the examined component may break in the near future, Regression-Tests
evaluate the chronological sequence of monitoring data for abnormal behaviour. By comparing current data and historical data performance degradation can be recognized before a failure of the affected component occurs. The analysis and comparison of the data is done via an adequate
algorithm, which we call Regression Analysis. The result of the Regression Analysis presents the result of the Regression-Test. Since different metrics may need different algorithms for obtaining usable hints of the proper functioning of a component, TIMaCS allows for different regression
analyses, which are implemented through an open interface.
Consider, for example, hard disk drive failures. It is possible to monitor such parameters as temperature, write-speed, rotational speed and so on. Then one can run a Regression-Test based on this
data to compare whether values measured in the past have changed or not. If the current write-speed
is slower than in the past, this can hint at a upcoming failure of the hard disk drive.
Metrics appropriate for a Regression-Test are for example:
• bandwidth of main memory
• velocity of the communication network between nodes
• transfer rate of the hard disk drive
• write-speed of the hard disk drive
• read-speed of the hard disk drive
• response times of servers, data bases, … where they are important
• memory errors
You can extend or shorten this list as you wish.
How does a Regression-Test work?
TIMaCS distinguishes between online- and Offline-Regression-Tests. Online-Regression-Tests are
performed on a regular time interval and evaluate the most recent historical data being delivered by
the publish/subscribe-system. Offline-Regression-Tests on the contrary are only performed on request. They query the database to obtain their data for evaluation.
5.3.2.1 Online-Regression-Tests
After configuration (see Chapter 3.1.3) Online-Regression-Tests are performed on a regular basis
and analyse only data measured in the recent past. They receive those data from the publish/subscribe-system and save them in their main memory. Only if TIMaCS has been restarted and their
main memory is still empty, they fetch the necessary data from the data base, so that they are able to
run a Regression Analysis immediately after the arrival of the first value from the publish/subscribe-system.
Preventive Error Detection
53/77
Tools for Intelligent System Management of
Very Large Computing Systems
An Online-Regression-Test subscribes to that metric, whose development it should analyse. It saves
the latest N values of this metric (one can configure N by supplying the corresponding number to
number_of_values_to_be_used, see Chapter 3.1.3) in its working memory and every time, when a
new value of this metric arrives, the result of the Regression analysis will be newly calculated. Dependent on the algorithm used for the regression-analysis (see Chapter 5.3.2.3) the calculation can
be very time-consuming. Therefore it is possible to configure a time-interval T (corresponds to interval_s in Chapter 3.1.3), which states that the Regression-Test should not run more often than every T seconds, even if the metric it is using is updated more frequently.
Online-Regressionstests only run on master-nodes. Each master-node only analyses that metrics,
which are from a node inside its group. This happens transparent for the user.
5.3.2.2 Offline-Regression-Tests
In addition to Online-Regression-Tests, which take place on a regularly and automated basis, Offline-Regression-Tests are the tool of choice if the administrator wants to have a closer look on the
performance of a special component. An Offline-Regression-Test calculates a regression value for a
chosen metric based on a specified time period. In contrast to Online-Regression-Tests, the advantage of an Offline-Regression-Test is, that one can freely choose the time interval the RegressionTest should span. In addition an averaging routine is provided for optionally averaging older values.
This can be useful if there are lots of data within the requested time interval, either because the considered component was measured frequently or because the chosen time interval is very large. Depending on the complexity of the chosen algorithm for the Regression Analysis averaging can
accelerate the calculation. Offline-Regression-Tests are performed as an external tool and are invoked only on request.
Offline-Regression-Tests consist of two parts: a command-line user interface and a computational
part. They are invoked by executing the file bin/do_offline_regressiontest. This starts an interactive
session in which the user has to configure the Offline-Regression-Test. After all necessary information is provided, the Offline-Regression-Test retrieves the Storage to obtain a set of data for the Regression Analysis. If the required data are not stored in the local database, the data are requested via
a RPC connection from the corresponding remote TIMaCS Node. This process is transparent for the
user due to the special API of the Storage. The requested data-set is then, after an optionally averaging procedure, handed over to the Regression Analysis, which calculates the result and prints it on
the screen together with the data-set used for the Regression Analysis (see Figure 5).
Preventive Error Detection
54/77
Tools for Intelligent System Management of
Very Large Computing Systems
Figure 5: Principle of work of an Offline-Regression-Test
Information needed to run an Offline-Regression-Test:
To run an Offline-Regression-Test at first one needs to specify two command-line arguments: a port
number to establish the RPC connection and the location of the TIMaCS hierarchy configuration
file. In contrast to the Online-Regression-Tests, which use a configuration file, the Offline-Regression-Tests are “configured” via the user interface, where the user is prompted amongst others to
specify which metric from which host should be analyzed and which algorithm for the Regression
Analysis should be used.
The following information is required to run an Offline-Regression-Test:
1. Full path to the metrics database
2. Name of the host from which the data should be analyzed
Here only the name without the group path information must be typed in.
3. Metric name
4. Group path
Here the group path (first part of full hierarchical name) must be typed in.
Depending on the specified group path the Offline-Regression-Test provides either a local
Preventive Error Detection
55/77
Tools for Intelligent System Management of
Very Large Computing Systems
request to the database or a RPC request to get the data. Both kinds are transparent to the
user due to the special database API.
5. Algorithm to use for the Regression Analysis
For more information on Regression Analysis see Chapter 5.3.2.3.
6. Start time and end time
Both time points should be provided in the format: day.month.year hour:minute:second.
day is a number between 1 and 31, month is a number between 1 and 12 and year is a fourdigits number. The program also accepts the start time and the end time without the time of
day. In this case the time of day will be automatically set to 00:00:00.
7. Data averaging (optional, for detailed information see paragraph Data averaging).
◦ When “no” is chosen, the program calculates the result and prints it out.
◦ When “yes” is chosen, one needs to input a date and a time, until which the data should
be averaged. The data format is the same as before. In addition one needs to input the
time interval T in seconds which should be used for the averaging process. Then the
data will be averaged and the averaged data will be handed over to the regression analysis, which calculates the result before it is finally printed out.
Offline-Regression-Tests only work if TIMaCS is running. So before you can perform an OfflineRegression-Test, make sure that htimacsd is running on all TIMaCS-masternodes.
Example for running an Offline-Regression-Test:
n103:~$ bin/do_offline_regressiontest --hierarchy-cfg /home/nixby/timacs/trunk/config/hlrs_hierarchy_config --direct-rpc-port=19452
Please insert the full path to the metric database.
/home/nixby/db_n101
Please insert the name of the host from which you want to analyse the data.
n101
Please insert the name of the metric which you want to analyse.
boottime
Please insert the group path.
/
Please insert the file name of the algorithm you want to use for the regression analysis.
linear_regression
Please insert the start time = lower boundary of the data interval, which should be
used in the regression test. Use the following format: day.month.year
hour:minutes:seconds (only digits with 4-digit year)
01.01.2010
Please insert the end time = upper boundary of the data interval, which should be
used in the regression test. Use the following format: day.month.year
hour:minutes:seconds (only digits with 4-digit year)
01.01.2012
Do you want to average older values? Please answer ‘yes’ or ‘no’.
yes
Preventive Error Detection
56/77
Tools for Intelligent System Management of
Very Large Computing Systems
Please insert that time, until which the data should be averaged. Use the following
format: day.month.year hour:minutes:seconds (only digits with 4-digit year)
13.10.2011
Please insert the time interval in seconds, which should be used for averaging.
36000
The result of an Offline-Regression-Test may look similar to this:
Start: 01.01.2010 00:00:00 Stop averaging at: 13.10.2011 00:00:00 End: 01.01.2012
00:00:00
Those are the data for the regression analysis:
21.09.2011 13:10:43 1292772668.0
21.09.2011 13:10:43 1292772668.0
21.09.2011 13:10:43 1292772668.0
21.09.2011 13:10:43 1292772668.0
21.09.2011 13:10:43 1292772668.0
21.09.2011 13:10:43 1292772668.0
21.09.2011 13:10:43 1292772668.0
21.09.2011 13:10:43 1292772668.0
21.09.2011 13:10:43 1292772668.0
21.09.2011 13:10:43 1292772668.0
21.09.2011 13:10:43 1292772668.0
21.09.2011 13:10:43 1292772668.0
21.09.2011 13:10:43 1292772668.0
21.09.2011 13:10:43 1292772668.0
21.09.2011 13:10:43 1292772668.0
21.09.2011 13:10:43 1292772668.0
21.09.2011 13:10:43 1292772668.0
21.09.2011 13:10:43 1292772668.0
21.09.2011 13:10:43 1292772668.0
21.09.2011 13:10:43 1292772668.0
21.09.2011 13:10:43 1292772668.0
21.09.2011 13:10:43 1292772668.0
21.09.2011 13:10:43 1292772668.0
21.09.2011 13:10:43 1292772668.0
21.09.2011 13:10:43 1292772668.0
21.09.2011 13:10:43 1292772668.0
21.09.2011 10:35:43 1292772668.0
21.09.2011 10:35:45 1292772668.0
21.09.2011 15:35:43 1292772668.0
21.09.2011 15:55:43 1292772668.0
And here is the result of the regression analysis: 0.0
Would you like to perform one more test? [yes]
If answering yes one will be queried for input for a new Offline-Regression-Test.
Making TIMaCS able to start Offline-Regression-Tests automatically in special cases
Preventive Error Detection
57/77
Tools for Intelligent System Management of
Very Large Computing Systems
As mentioned before, TIMaCS is able to start actions if some conditions are met. In some cases of
erroneous system-states, it can be helpful for deciding how to cure the error, to have the result of a
regression-test. Offline-Regression-Tests provide the possibility to be started not only by the user
but also by the Filter & Event-Generator via a special message.
To use this possibility, the Offline-Regression-Delegate has to be initialized when starting TIMaCS
by using the option --offreg_enabled=yes. The Offline-Regression-Delegate subscribes to the channel offreg_command and waits for messages. Such messages can be sent by the Filter & Event-Generator if corresponding rules have been set up. This means, that one needs to create eclipse-based
rules which will send a special message with the following parameters to the exchange offreg_command with the following content:
PathToFile (string)
host_name (string)
metric_name (string)
direct_rpc_port (string)
start_time (string)
end_time (string)
averaging_time (string)
deltaT (integer)
group_path (string)
algorithm_for_analysis (string)
time (float)
When the message arrives at the Offline-Regression-Delegate, the corresponding data will be
fetched from the storage, optionally averaged and handed over to the Regression-Analysis, which
calculates the result of the Regression-Test. This result will then be packed into another message
and published as a metric to the metric channel. From there it can be used for further analysis by the
Rule-Engine and the Policy-Engine.
If an Offline-Regression-Test is performed by the Offline-Regression-Delegate, the data used and
the result of the regression analysis can be found in the log-files of htimacsd as well.
Example:
[INFO 2011–09–20
value - 37052.0
[INFO 2011–09–20
value - 42728.0
[INFO 2011–09–20
value - 34820.0
[INFO 2011–09–20
value - 97188.0
[INFO 2011–09–20
value - 92752.0
[INFO 2011–09–20
value - 91320.0
[INFO 2011–09–20
value - 88412.0
[INFO 2011–09–20
value - 107052.0
12:37:20,161 #1058] OfflineRegression test: Time - 14.09.2011 11:42:06,
12:37:20,162 #1058] OfflineRegression test: Time - 14.09.2011 11:47:25,
12:37:20,166 #1058] OfflineRegression test: Time - 14.09.2011 11:48:08,
12:37:20,167 #1058] OfflineRegression test: Time - 14.09.2011 15:35:24,
12:37:20,167 #1058] OfflineRegression test: Time - 14.09.2011 15:36:01,
12:37:20,167 #1058] OfflineRegression test: Time - 14.09.2011 15:39:02,
12:37:20,168 #1058] OfflineRegression test: Time - 14.09.2011 15:40:40,
12:37:20,168 #1058] OfflineRegression test: Time - 14.09.2011 15:48:06,
Preventive Error Detection
58/77
Tools for Intelligent System Management of
Very Large Computing Systems
[INFO 2011–09–20 12:37:20,168
value - 103080.0
[INFO 2011–09–20 12:37:20,168
value - 92620.0
[INFO 2011–09–20 12:37:20,169
value - 89480.0
[INFO 2011–09–20 12:37:20,169
value - 87248.0
[INFO 2011–09–20 12:37:20,169
value - 84728.0
[INFO 2011–09–20 12:37:20,169
analysis: 74097724.0
#1058] OfflineRegression test: Time - 14.09.2011 15:48:40,
#1058] OfflineRegression test: Time - 14.09.2011 16:26:45,
#1058] OfflineRegression test: Time - 14.09.2011 16:27:27,
#1058] OfflineRegression test: Time - 14.09.2011 16:30:07,
#1058] OfflineRegression test: Time - 14.09.2011 16:30:43,
#1058] OfflineRegression test: The result of the regression
Data averaging
An Offline-Regression-Test calculates regression-values for a specified metric for a range of time,
which is specified when requesting the Test. But there a cases thinkable, where there are too many
metric-values, which need to be taken into account. Either because the component is measured very
frequently or the loss of performance happens so slowly, that a very long time-interval has to be
taken into account with numerous values to consider. Depending on the complexity of the algorithm
for the regression analysis, performance can be very slow, when the data-set for the regression analysis is too large. Therefore the Offline-Regression-Test offers the possibility of averaging the data
and thus increase the calculation time for the regression analysis.
If one wishes to average the data, one must answer “yes” to the question „Do you want to average
older values?“ of the interactive API. After that one is asked to provide the date and time until
which the data should be averaged. Depending on how one chooses this point, three different things
can happen:
1. If this time point lies before the start time of the time interval or is equal to it, averaging will
not be performed although one explicitly stated before that it should be done.
2. If this time point lies after the end time of the time interval given or is equal to it, all values
will be averaged if the time period T which is used for the averaging is greater than zero.
3. If this time point is between the beginning and the end of the time interval given, then the
data between the beginning and this time point will be averaged in case the time period T
which will be used for the averaging procedure is greater than zero. For the data that are between the time point and the end of the time interval there will be no averaging.
During the averaging procedure the time interval between the start time and the time specified for
the averaging is divided into time intervals of length T. In case the time interval within which the
averaging is performed is not a multiple of T, the first time interval after the start time will then be
smaller than T. See the following picture for illustration:
Preventive Error Detection
59/77
Tools for Intelligent System Management of
Very Large Computing Systems
Figure 6: Time intervals in the averaging procedure
After the averaging procedure each time interval T will include either one data-point or no datapoints. The first case occurs if there were one or more data-points in this interval before averaging.
The latter case occurs if there was no data-point in the interval before averaging. When averaging
the data, both, values and dates are averaged. This means, that if the data within one interval T are
not equally distributed, the date of the averaged data-point does not lie in the center of the interval
T but at that time where there were most data-points before averaging.
5.3.2.3 Regression Analysis
The algorithm being responsible for the analysis of the data is called Regression Analysis. Those algorithms are implemented via an open interface for making the implementation of a new algorithm
easy—in that case one only needs a file which implements the class RegressionAnalysis and put it
in the corresponding directory.
Which regression analysis is used by a Regression-Test is configured in the configuration file in
case of an Online-Regression-Test and in case of an Offline-Regression-Test the configuration is
done interactively via the user-interface just before starting an Offline-Regression-Test. The Regression Analysis calculates the result in dependence of the chosen parameters and the chosen algorithm.
At the time of writing this book two different regression analyses are included into TIMaCS:
• linear_regression
• integrate_reg
One can choose that regression analysis, which fits better to the metric or which one likes more. If
one is not satisfied with any of the above mentioned regression analyses, one can implement ones
own algorithm and use it with TIMaCS as regression analysis. How to write a regression analysis is
described in Chapter 5.7.2. In the following sections the already implemented algorithms are described.
The linear Regression (linear_regression)
Here, a linear function is fitted to the data and the slope is returned. The idea of linear regression is,
that the values a component returns are about to be constant as long the component is OK. This algorithm is especially useful for predicting the state of a hard disk and evaluating memory errors on
a DIMM.
Preventive Error Detection
60/77
Tools for Intelligent System Management of
Very Large Computing Systems
This algorithm puts a straight line across the (time/value)-pairs and returns the slope. Everything is
OK as long the slope is about Zero. But if the absolute value of the slope is larger than Zero, than
the component is considered as failure-prone. If the result is analyzed by the Filter & Event-Generator, one has to specify a range of tolerance. Inside this range the slope is considered as Zero but if
the value lies outside this range an error message is generated.
The Integration (integrate_reg)
This algorithm sums up all values between start time and end time and returns the sum.
This function is appropriate especially for the analysis of memory errors, since often the total number of memory errors on a DIMM within a specified time interval, e. g. the last 24 hours, is of interest.
Here an averaging of data doesn't make much sense but is possible.
5.4 Management
The Management-Block is responsible for making decisions in order to handle error events. It consists of the following components: Event-Handler, Decision-Maker, Knowledge-Base, Controlled
and Controller, as shown in Figure 3 on page 9. Firstly, it analyses triggered events, received from
the Filter & Event Generator of the Monitoring block, and determines which of them needs to be investigated to make decisions on their handling. Decisions are made in accordance with the predefined policies and rules, which are stored in a knowledge base filled up by system administrators
when configuring the framework and contains policies and rules as well as information about the infrastructure. Decisions result in actions or commands, which are submitted to “delegates” and executed on managed resources (computing nodes) or other components influencing managed
resources (e. g. the scheduler can remove failure nodes from the batch queue).
The implementation of the Management-Block can be done by the Rule-Engine, settled in the 1st
level of the TIMaCS hierarchy, or by the Policy-Engine, settled on higher levels. The Rule-Engine
is responsible for a simple evaluation of incoming messages, neglecting systems states. It consists
mainly of the decision-component, executing rules to handle messages or errors. The Policy-Engine
is settled on higher levels and is responsible for the evaluation of complex events, requiring an evaluation of relationships between incoming events, system-components and internal system-states.
The following sections explain the usage of the Rule-Engine, Policy-Engine and the Delegate in detail.
5.4.1 Rule-Engine
The Rule-Engine is the TIMaCS component responsible for processing incoming messages (e. g.
from the TIMaCS monitoring component) according to a set of rules and configuration settings. A
standard task could be to evaluate the incoming monitoring data messages and, if necessary, to create new messages indicating an incident and escalate the new message to some administrative node.
The rules, their configuration and the AMQP channel settings can be created and deployed using a
graphical editor.
Management
61/77
Tools for Intelligent System Management of
Very Large Computing Systems
For information on how to start working with the Rule-Engine and its GUI client, please have a
look at the tutorial ./ruleEngineTutorial.pdf in the eclipse online help or at this location:
trunk/src/ruleseditor/timacs.rules.help/help/twiki/bin/view/Venus/TimacsRulesTutorial.pdf
The Rule-Engine is mainly responsible for the processing of raw data in form of messages.
Its tasks in more detail:
•
Conversion of sensor specific data into a homogeneous and consistent format to describe
status information (service available/not available) and/or data.
•
Combination of data from several messages belonging to one single logical resource (e. g.
the values "used", "reserved" and "free" for blocks and inodes in disk-free (df) of collectd).
•
Comparison between actual values and configured reference values.
•
Surveillance of threshold values.
•
Possibility to trigger (simple) actions, like restarting daemons.
•
Upstream reporting of actions.
•
Escalation of actions, in case the locally triggered action did not solve the problem.
•
Reduction of data to be sent upstream by filtering and aggregation.
Rule-Engines are registered and bound to AMQP-exchanges. During startup, the Rule-Engine will
create a topic exchange (name: "amq.direct") and will bind itself to this exchange with a default
routing key "rule_engine". Messages have dictionary-like structure, which can be hierarchical,
which means that every dictionary value can be a dictionary itself. For the Rule-Engine to work it is
required that every message has a key "kind" with a value that identifies the further structure of the
message dictionary. Any messages sent to this exchange must have the content_type
"application/sexpr" or "application/json" and be encoded accordingly in order to be correctly processed by the Rule-Engine ("application/sexpr" is a proprietary encoding based on s-expressions,
developed by s+c). By default, the Rule-Engine sends a timer message (kind= "timacs.monitoring.timer") to itself every 30 seconds. These timer messages are especially useful to monitor the availability of the monitoring infrastructure itself.
If errors occur during the processing of messages (e. g. malformed messages or rules), a special
message with kind "timacs.rules.engine.error" is sent to the Rule-Engine's AMQP exchange with the
exchange key "error".
It is the job of the Rule-Engine to process incoming messages according to a configured set of rules.
These rules are part of the Rule-Engine's configuration. They are created and deployed using a
graphical editor.
Questions and Answers concerning the Rule-Engine
•
The configurationReader has the possibility to fill out some brackets. The tutorial says “just
write 'Tutorial' inside the brackets. What should I write inside the brackets, when configuring a system for production?
Management
62/77
Tools for Intelligent System Management of
Very Large Computing Systems
This word in brackets is the property “key group name”, since the configuration-variables
are sorted into key-groups to prevent that all variables exist in the same large name-space.
Thus a configuration-variable is identified by the key-group and the name of the variable.
•
The Tutorial states that one has to write a configuration for each host, which does not scale
for a large cluster. Is there a possibility to write a general configuration being valid for all
nodes or for a group of nodes?
The configuration is built hierarchically. That means that one can make nested “Node List
Config”-objects. Like
(all nodes)
/
\
(group A)
(group B)
/
\
|
(host x) (host y) (host z)
In the configuration host x, host y and host z are represented by a "Node Config"-object,
each of the composed nodes (all nodes, group A, group B) is represented by a "Node List
Config"-object. So if a configuration is valid for all nodes, the corresponding key group has
to be mentioned in all nodes and the corresponding variables, which have the same value for
all nodes are set with a "Map Key To Value" element. If required this value can be overwritten in a subgroup or a host by using again a "Map Key To Value" element at the corresponding place.
5.4.2 Policy-Engine
The Policy-Engine is settled on higher levels and is responsible for the evaluation of complex
events, requiring an evaluation of relationships between incoming events, system-components and
internal system-states. It evaluates events received from the Rule-Engine, which require assessment
of system-states based on information stored in the knowledge base. The Policy-Engine consists of
the following components: Event-Handler, Decision-Maker, Knowledge-Base, and
Controller/Controlled, described below:
Event-Handler
The Event Handler analyses received reports and events applying escalation strategies, to identify
those which require error handling decisions. The analysis comprises methods evaluating the severity of events/reports and reducing the amount of related events/reports to a complex event. The
evaluation of severity of events/reports is based on their frequency of occurrence and impact on
health of affected granularity, as service, compute node, group of nodes, cluster etc. The identification of related events/reports is based on their spatial and temporal occurrence, predefined event relationship patterns, or models describing the topology of the system and dependencies between
services, hardware and sensors. After the event has been classified as “requiring decision”, it is
handed over to the Decision Maker.
Decision-Maker
Management
63/77
Tools for Intelligent System Management of
Very Large Computing Systems
The Decision Maker is responsible for planning and selecting error correcting actions, made in accordance with predefined policies and rules, stored in the Knowledge-Base. The local decision is
based on an integrated information view, reflected in a state of affected granularity (compute node,
node group, etc.). Using the topology of the system and dependencies between granularities and
subgranularities, the Decision Maker identifies the most probable origin of the error. Following predefined rules and policies, it selects decisions to handle identified errors. Selected decisions are
mapped by the Controller to commands, and are submitted to nodes of the lower layer, or to Delegates of managed resources.
Knowledge-Base
The Knowledge Base is filled up by the system administrators when configuring the framework. It
contains policies and rules as well as information about the topology of the system and the infrastructure itself. Policies and rules stored in the Knowledge Base are expressed by a by a set of
(event, condition, action) rules defining actions to be executed in case of error detection.
The configuration of the knowledge-base and operation of the Policy-Engine, is explained in Section 3.4.2 on page 30, and contains:
•
The TIMaCS hierarchy, describing the hierarchical relationship of the TIMaCS framework.
•
The Error-Dependency, describing the error-dependency between components/component-types monitored by the TIMaCS framework.
•
ECA-rules (event, condition, action), describing events and conditions leading to triggering of actions to handle errors
Controller/Controlled
The Controller component maps decisions to commands and submits these to Controlled components of the lower layers, or to Delegates of the managed resources.
The Controlled component receives commands or updates from the Controller of the management
block of the upper layer and forwards these, after authentication and authorization, to addressed
components. For example, received updates containing new rules or information, are forwarded to
the Knowledge Base to update it.
5.4.3 Delegate
The Delegate provides interfaces enabling the receipt and execution of commands on managed resources. It consists of Controlled and Execution components.
The Controlled component receives commands or updates from the channels to which it is subscribed and maps these to device specific instructions, which are executed by the Execution component. In addition to Delegates which control managed resources directly, there are other Delegates
which can influence the behaviour of the managed resource indirectly. For example, the virtualization management component, is capable to migrate VM-instances of affected or faulty nodes to
healthy nodes.
Management
64/77
Tools for Intelligent System Management of
Very Large Computing Systems
5.5 Virtualization
Virtualization is an important part of the TIMaCS project, since it enables partitioning of HPC resources. Partitioning means that the physical resources of the system are assigned to host and execute user-specific sets of virtual machines. Depending on the users’ requirements, a physical
machine can host one or more virtual machines that either use dedicated CPU cores or share the
CPU cores. Virtual partitioning of HPC resources offers a number of benefits for the users as well
as for the administrators. Users no longer rely on the administrators to get new software (including
dependencies such as libraries) installed, but they can install all software components in their own
virtual machine. Additional protection mechanisms including the virtualization hypervisor itself
guarantee protection of the physical resources. Administrators benefit from the fact that virtual machines are easier to manage in certain circumstances than physical machines. One of the benefits of
using TIMaCS is to have an automated system that makes decisions based on a complex set of
rules. A prominent example is the failure of certain hardware components (e. g. fans) which leads to
an emergency shutdown of the physical machines. Prior to the actual system shutdown, all virtual
machines are live-migrated to another physical machine. This is one of the tasks of the TIMaCS virtualization component.
The used platform virtualization technology in the TIMaCS setup is the Xen Virtual Machine Monitor [14] since Xen with para-virtualization offers a reasonable trade-off between performance and
manageability. Nevertheless, the components are based on the popular libvirt (http://libvirt.org/) implementation and thus can be used with other hypervisors such as the Kernel Virtual Machine
(KVM). The connection to the remaining TIMaCS framework is handled by a Delegate that receives commands and passes them to the actual virtualization component. A command could be the
request to start a number of virtual machines on specific physical machines or the live migration
from one machine to another. If the framework relies on a response, i. e. it is desirable to perform
some commands synchronously, the Delegate responds back to an event channel.
The figure below describes the architecture of the TIMaCS virtualization components. The image
pool plays a central rule since it contains all virtual machines’ disk images either created by the user
or the local administrator. Once a command is received via the Delegate, the virtualization component takes care of executing it.
Virtualization
65/77
Tools for Intelligent System Management of
Very Large Computing Systems
Figure 7: TIMaCS Virtualization Components
The vmManager Delegate resides in /src/timacs/delegates.
There exist two executables in /bin:
can be used to start the delegate in standalone mode.
•
delegate
•
vmManagerTestClient.py
is a wrapper script for TestClient.py, a client to test the delegate
Both executables expect the two config files (see Chapter 3.6) to be stored in /config under the
names delegate.conf and directory.conf as well as a hierarchy configuration in a file hierarchy.conf.
The README file in /src/timacs/delegates explains the use and configuration in detail.
Information about the vmManager can be found in the README file in /src/timacs/vmManager.
Virtualization
66/77
Tools for Intelligent System Management of
Very Large Computing Systems
5.6 Using TIMaCS Graphical User-Interface
To use GUI, open in your web-browser: http://localhost:8080/TimacsGUI/index.html. In case you
have installed tomcat on other host, use that hostname instead of localhost. After opening in GUI
in your web-browser, you should see on the left panel:
Figure 8: TIMaCSGUI tools on left panel
Click on the Status Map tool, a Graph of your infrastructure (following TIMaCS-hierarchy) will be
displayed in a Tab on the center panel. Some overview information or aggregated data are foreseen
to be demonstrated in the Graph.
To browse the monitoring data:
1. Click on Host-Status tool button
2. After the “Host-Status” button is clicked, the list of available hosts will be retrieved from
TIMaCS server and will be shown as a tree in a new Tab on the center panel.
Using TIMaCS Graphical User-Interface
67/77
Tools for Intelligent System Management of
Very Large Computing Systems
Figure 9: TIMaCS-GUI - browsing the
monitoring data
3. Double click on a host to view according metrics.
Using TIMaCS Graphical User-Interface
68/77
Tools for Intelligent System Management of
Very Large Computing Systems
Figure 10: TIMaCS-GUI - selecting
metrics
4. Right click on a metrics, a pop-up menu will be shown viewing last value or history value of
the metrics. Double clicking on a metrics will view both latest and history values.
Using TIMaCS Graphical User-Interface
69/77
Tools for Intelligent System Management of
Very Large Computing Systems
Figure 11: TIMaCS-GUI viewing metric values
5. On the bottom of each window, you can find two tool buttons, one for manually refreshing
the data and one for automatically refreshing data every 30 seconds.
Figure 12: TIMaCS-GUI
Refreshing button
5.7 How to write plug-ins for TIMaCS
5.7.1 Writing custom Delegates
For a custom delegate an adapter needs to be created. That is a module containing a class named
'Adapter', that accepts a dict as initialization parameter. This class must provide a function named
'executeCommand', that accepts a string (the command) and a dict (the arguments) and return any
result of the execution or None. In case of errors, it should raise a Delegate.ExecutionException.
How to write plug-ins for TIMaCS
70/77
Tools for Intelligent System Management of
Very Large Computing Systems
The file 'vmManager.py' contains the adapter for the vmManager, that can be used as blueprint for
writing custom adapters.
Important: the name of the module also determines the command type, which has to be set in the
'kind-specific' field of all messages. For example, the vmManager delegate has the command type
'vmManager', because it's adapter is specified in the file ' vmManager.py' and thus in the module
'vmManager'.
To start custom delegates, a configuration section has to be added to the configuration file for the
Delegates. Details can be found in Chapter 3.6.
5.7.2 Writing plug-ins for the regression analysis
As already mentioned, at the time of writing TIMaCS is delivered with two regression analyses.
These are implemented via an open interface, so that adding another regression analysis is easy.
How to implement a regression analysis?
First put a new file into the directory
src/timacs/regressiontests/regression_analysis/
The name of this file must fulfill two conditions:
1. The ending of the file name must be .py.
2. The name of the file must be different from all other file names in this directory. (Otherwise
an existing file will be overridden.)
To make TIMaCS able to use the algorithm implemented in this file correctly, one must use the following template to implement the algorithm:
class RegressionAnalysis():
"""Inside this string you may write some documentation about the algorithm."""
def __init__(self, dataArray):
self.dataArray = dataArray
# You may add more variables used by the algorithm, e.g.
self.result = 0
# This line is just an example and may be deleted
self.erromsg = "" # If something goes wrong you may use this string
# for writing an errormessage inside
def getRegression(self):
"""Inside this string you may write some documentation about the algorithm."""
# Write here your algorithm and use python as programming language
# This returns the result of the regression analysis.
# If your variable containing the result of the analysis is called
# differently, change the name of self.result.
return self.result, self.erromsg
How to write plug-ins for TIMaCS
71/77
Tools for Intelligent System Management of
Very Large Computing Systems
Now one only needs to mention the name of this file as regression analysis in the configuration file
(in the case of an online Regression-Test) or interactively when configuring an Offline-RegressionTest.
5.7.3 Writing plug-ins for a batch-system
Usually user-jobs in a cluster are managed using a batch-system (BS). Since a large part of the administration of the cluster is taken by TIMaCS, TIMaCS needs to interact with the BS at two sites.
On the one hand monitoring-information from the BS is needed (e. g. How much jobs are in each
queue? Do the queues accept jobs and distribute them to the nodes?), on the other hand TIMaCS
should be able to manage the BS, which could mean to remove faulty nodes from the BS or to close
and open queues. All this functionality is controlled by the following interface consisting of management-interface- and monitoring-interface-functions:
Management Interface functions
1. createSubmitScript()
Allows to create a submission script with specified parameters. This function is used by
Compliance-Tests for submitting benchmarks via the batch-system.
Input parameters:
message (type Message class) – consists of parameters specified in a job submission:
name_of_sensor_or_benchmark, queue_name, memory_usage, targethost,
number_of_cpus, time_ID, email.
path (type string) – Path to a file, which contains the configuration-information of the
benchmark, which should be submitted to the BS.
work_dir (type string) – Name of the working directory.
Output parameters:
Path to the created submission-script.
2. submitJob()
Allows to submit a job with a specified submission-script.
Input parameters:
jobScriptPath (type string) – Path to the submission-script.
Output parameters:
jobID (type string) – Identifier of the submitted job.
3. deleteJob()
Allows to delete a job, which is not longer necessary.
Input parameters:
jobId (type string) – Identifier of the submitted job.
Output parameters:
retValue (type string) – Returns a string from the BS.
4. moveJob()
Allows to move a job from one queue to another.
Input parameters:
jobId (type string) – Identifier of the submitted job.
How to write plug-ins for TIMaCS
72/77
Tools for Intelligent System Management of
Very Large Computing Systems
(type string) – Name of the destination queue.
Output parameters:
retValue (type string) – Returns a string from the BS.
dest
5. holdJob()
Allows to hold a job when necessary.
Input parameters:
jobId (type string) – Identifier of the submitted job.
Output parameters:
retValue (type string) – Returns a string from the BS.
6. releaseJob()
Allows to release a previously hold job when necessary.
Input parameters:
jobId (type string) – Identifier of the submitted job.
Output parameters:
retValue (type string) – Returns a string from the BS.
7. takeNodeOffline()
Allows to close a host in case of a system failure.
Input parameters:
nodeId (type string) – Identifier of the host to close.
Output parameters:
retValue (type string) – Returns a string from the BS.
8. takeNodeOnline()
Allows to open a host which was previously closed.
Input parameters:
nodeId (type string) – Identifier (name) of the host to open.
Output parameters:
retValue (type string) – Returns a string from the BS.
9. setQueueStatus()
Allows to change two different statuses of a queue (active/inactive and open/close for LSF,
enabled/disabled and started/stopped for PBS).
Input parameters:
queueName (type string) – Name of the queue.
status (type list) – Consists of two boolean values for each status of the queue.
Output parameters:
retValue (type string) – Returns a string from the BS.
Monitoring Interface functions
1. getQueuesStatus()
Allows to get a system information about a queue status.
Input parameters:
queueName (type string) – Name of the queue.
How to write plug-ins for TIMaCS
73/77
Tools for Intelligent System Management of
Very Large Computing Systems
Output parameters:
retValue (type string) – Returns a string from the BS.
2. getJobsStatus()
Allows to get system information about the status of a job.
Input parameters:
jobId (type string) – Identifier of the job.
userName (type string) – Name of the user about whose job one needs to get information.
Output parameters:
retValue (type string) – Returns a string from the BS.
3. getNodeStatus()
Allows to get system information about the status of a node.
Input parameters:
nodeId (type string) – Identifier (name) of the node.
Output parameters:
retValue (type string) – Returns a string from the BS.
If one wants to write a plug-in for another BS, all these functions have to be implemented. For an
easy integration of further BSs, the interface is implemented as open interface.
At the moment, the following three BSs are supported:
•
LoadLeveler from IBM
•
LSF
•
OpenPBS (Torque)
Structure
The batch-system package is responsible for all communication with the batch-system. It consists of
one subpackage for each integrated BS and the interface module batch_system.py. Each subpackage in turn consist of two files: MonitoringInterface.py and ManagementInterface.py. In these two
files the above defined functions are implemented. To invoke the BS interface one needs to import
the file batch_system.py. To write a plug-in to the BS interface one should keep the above mentioned file-structure and implement the list of functions mentioned above.
5.7.4 Writing sensors and benchmarks for Compliance-Tests
As mentioned before, sensors and benchmarks are implemented via an open interface to make the
integration of further sensors and benchmarks easy.
Implementing a sensor
To implement a sensor the following template has to be used:
import timacs.compliancetests.delegate_compl as compl
# import more python modules to your need
class CompliancetestSensor():
How to write plug-ins for TIMaCS
74/77
Tools for Intelligent System Management of
Very Large Computing Systems
def __init__(self, timeout_s, command):
self.commandline = "...” # include here the shell-command to be
# executed via ssh. This can as well be a
# script or program to be executed
self.commandsearchpath = command.commandsearchpath
self.errormsg = ""
self.host = command.targethost
self.sensor = command.name_of_sensor_or_benchmark
self.timeout_s = timeout_s
self.waiting_interval = command.waiting_intervall_s
# Include more variables to your needs
def request_measurement(self):
a = compl.SubmitCommand(self.sensor)
result, self.errormsg = a.submission_with_timeout(self.timeout_s,
self.waiting_interval, self.commandline, self.host,
self.commandsearchpath)
# you can include some code to reduce the result to the
# important information
return str(result).strip(), self.errormsg
class ConfigurationInformation():
def __init__(self):
pass
def get_parameter_information(self):
# if the sensor does not require any additional parameters,
# you can use the following three lines
additional_parameters = False
parameter_info = {}
return additional_parameters, parameter_info
# if you need additional parameters for execution the sensor,
# set additional_parameters to True and include all additional
# parameters into the dictionary parameter_info, like this:
# parameter_info = {"variable1": "human readable description",
“variable2”: “human readable description",...}
Implementing a benchmark
To implement a benchmark the following template has to be used:
class CompliancetestBenchmark(object):
def __init__(self, parameter_dict):
self.parameter_dict = parameter_dict
# Include more variables to your needs
def request_measurement(self):
# include here, what the benchmark should do
return result, errormessage
How to write plug-ins for TIMaCS
75/77
Tools for Intelligent System Management of
Very Large Computing Systems
class ConfigurationInformation(object):
def __init__(self):
pass
def get_parameter_information(self):
# if the sensor does not require any additional parameters,
# you can use the following three lines
additional_parameters = False
parameter_info = {}
return additional_parameters, parameter_info
# if you need additional parameters for execution the sensor,
# set additional_parameters to True and include all additional
# parameters into the dictionary parameter_info, like this:
# parameter_info = {"variable1": "human readable description",
“variable2”: “human readable description",...}
6 Acknowledgment
The results presented in this paper are funded by Federal Ministry of Education and Research
(BMBF) in the project TIMaCS with reference number 01IH08002.
Acknowledgment
76/77
Tools for Intelligent System Management of
Very Large Computing Systems
Bibliography
1. Strohmaier, E., Dongarra, J.J., Meuer, H.W., Simon, H.D.: Recent trends in the marketplace
of high performance computing, Parallel Computing, Volume 31, Issues 3–4, pp. 261–273
March- April (2005)
2. Wong, Y.W., Mong Goh R.S., Kuo, S., Hean Low, M.Y.: A Tabu Search for the Heterogeneous DAG Scheduling Problem, 15th International Conference on Parallel and Distributed
Systems (2009)
3. Asanovic, K., Bodik, R., Demmel, J., Keaveny, T., Keutzer, K., Kubiatowicz, J., Morgan,
N., Patterson, D., Sen, K., Wawrzynek, J., Wessel, D., Yelick, K.: A view of the parallel
computing landscape, Communications of the ACM, v. 52 n. 10, October (2009)
4. Ganglia web-site, http://ganglia.sourceforge.net/
5. Zenoss web-site, http://www.zenoss.com
6. TIMaCS project web-site, http://www.timacs.de
7. organic-computing web-site, http://www.organic-computing.de/spp
8. Wuertz, R.P.: Organic Computing (Understanding Complex Systems), Springer 2008
9. IBM: An architectural blueprint for autonomic computing,
http://www03.ibm.com/autonomic/pdfs/AC_Blueprint_White_Paper_V7.pdf, IBM Whitepaper, June
2006. Cited 16 December 2010
10. Advanced Message Queuing Protocol (AMQP) web-site, http://www.amqp.org
11. RabbitMQ web-site, http://www.rabbitmq.com
12. Nagios web-site, http://www.nagios.org/
13. eclipse Graphical Modeling Project (GMP) http://www.eclipse.org/modeling/gmp/
14. Barham, P., Dragovic, B., Fraser, K., Hand, S., Harris, T., Ho, A., Neugebauer, R., Pratt, I.,
Warfield, A.: Xen and the Art of Virtualization, in SOSP ’03: Proceedings of the 19th ACM
Symposium on Operating Systems Principles, ACM Press, Bolton Landing, NY, USA
(2003)
Acknowledgment
77/77