1
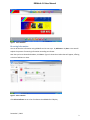
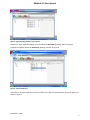
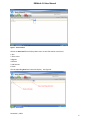
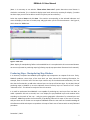
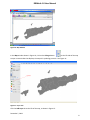
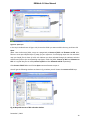
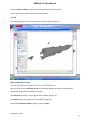
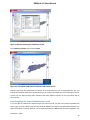
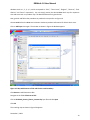
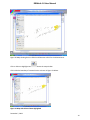
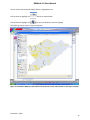
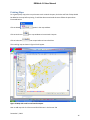
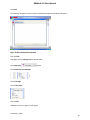
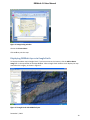
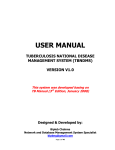
DRMInfo 1.0 User Manual 14 January, 2010 Contents Introduction .................................................................................................................................................. 2 Getting started with DRMInfo 1.0 ................................................................................................................ 2 Selecting the Database............................................................................................................................. 2 Browsing Information ............................................................................................................................... 3 Producing Maps - Manipulating Map Window ............................................................................................. 7 Overlaying Elements at Risk over Sources of Risk layers ........................................................................ 11 Producing Maps for Lower Administrative Levels .................................................................................. 12 Printing Maps .............................................................................................................................................. 16 Displaying DRMInfo layers in Google Earth ................................................................................................ 19 Produced with funding support from the European Commission’s Humanitarian Aid department (ECHO) i DRMInfo 1.0 User Manual Introduction DRMInfo is a tool for organizing, analyzing and presenting geographical, socio-economic and other useful scientific information to support Disaster Risk Management decisions. It is an adaptation of the UNICEF DevInfo 6.0 software for specific use in Timor-Leste, and contains local maps and information. National Disaster Management Directorate staff and members of District Disaster Management Committees are the principal operators of DRMInfo. These staff should have a basic capacity to operate Windows software. They will use DRMInfo to prepare information products; primarily thematic maps, but also tables and graphs, which show the nature of the disaster risk environment at the national, district and lower administrative levels. In the course of their risk assessment activities, members of Disaster Management Committees may go to the National Disaster Operations Centre or District DOCs to request specific information products to be made for them using the DRMInfo resources available at those sites. The use of DRMInfo, as well as the data contained within it, is structured according to the following principle: “Sources of risk”, such as floods, drought, high winds and pests; and “elements at risk”; such as houses, infrastructure and crops; interact to produce disaster risk situations with a range of likelihoods and severities. Accordingly, DRMInfo organizes its information into those two categories. This user manual is focused on how DRMInfo can be used for producing disaster risk maps for analysis, according to the interest of the user. After working through this manual, the reader who has DRMInfo software on their computer should be able to produce maps of any suco, sub-district or district in Timor-Leste that provide a description of the risk environment. Getting started with DRMInfo 1.0 Double-click the DRMInfo1.0 icon on the desktop to start the software. Selecting the Database In order to browse information in DRMInfo you need access to the database where the data are stored. The DRMInfo.mdb database contains data related to DRM. Steps for selecting the database: Click on Database Menu at the upper left corner of the DRMInfo screen shown in Figure 1; a database selection window will appear. Click on DRMInfo.mdb to choose that database. Click the OK button. Now you are connected with the DRMInfo database and can access its information. (Note: The DRMInfo.mdb is by default installed inside C:\DevInfo\DevInfo 6.0\DRMINfo 1.0\Data. If you could not find in the list you have to navigate to above folder using More option from database selection window.) December 7, 2009 2 DRMInfo 1.0 User Manual Figure 1 Select database Browsing Information You can browse the information using DRMInfo tool in two ways: by Indicator or by Area. Here we will explain the process of accessing information according to Indicator. Now that you have selected a database, click Start. Figure 2 shows the window that will appear, offering a choice of Indicator or Area . Figure 2 Select Indicator Click Select Indicator to see a list of Indicators that DRMInfo will display. December 7, 2009 3 DRMInfo 1.0 User Manual Click at Tree View just above the Indicator Display window to show the Indicator Classification Window, as in Figure 3 Figure 3 Tree View Figure 4 Sectors – Showing the types of hazards that are covered in DRMInfo Click on Sector Option, shown in Figure 5. Then Choose Type of Risk. For example, Flood. December 7, 2009 4 DRMInfo 1.0 User Manual Figure 5 Figure Showing Indicators List to Select. Double Click each required Indicator in the list below the Available () heading and the selected Indicators will appear below the Selected () heading, as shown in Figure 6. Figure 6 Selected indicators Click Next on the upper right corner above Available Tab. Now the Area Selection Screen will appear, as shown in Figure 7. December 7, 2009 5 DRMInfo 1.0 User Manual Figure 7 Area selection Choose an Area Level from the drop down menu to see information at that level: 1 Asia 2 Timor-Leste 3 Regions 4 Districts 5 Sub Districts 6 Sucos The corresponding Area level name will display. See Figure 8. Figure 8 Area names December 7, 2009 6 DRMInfo 1.0 User Manual (Note: It is necessary to see whether “Show where data exists” option above Area Level button is checked or unchecked. If it is checked it displays area levels where they are data for display. If no data has been input you will not be able to see the list of Area you have selected.) Select the required Areas and click Next. The statistics corresponding to the selected indicators and areas will display in the form of a table, map and graph when you click on those buttons. See Figure 9, which shows the Table view. Figure 9 Table view (Note: Option for manipulating Tables is also available but it is not explained in this user manual because we are more focused on producing maps by following step by step procedures illustrated in this manual.) Producing Maps - Manipulating Map Window It is necessary to explain how DRMInfo puts together map components on request of the user. Firstly, DRMInfo produces a base layer of the Area level you have selected for browsing information, for example, Area 4 is District level. The base layer consists only of the administrative boundary. The user then has the functionality to add other relevant layers on the top of the base layer. So, the basic idea of producing maps in DRMInfo is to select indicators that will overlay layers of “sources of risk” and/or “elements at risk”. This allows for analysis of the risk scenario. It is useful to understand that DRMInfo is not capable of producing any new layers from raw data, as could a powerful GIS such as ArcGIS; but it can display the pre-produced layers and combine them according to the needs of the user - and give precise geographic information for selected area and indicators. DRMInfo provides the functionality of producing tailored risk maps of the area of interest, and print them out for further use as required. DRMInfo allows the user who has limited knowledge of GIS software and GIS techniques to reproduce risk maps of their area of interest with an easily followed procedure. December 7, 2009 7 DRMInfo 1.0 User Manual Figure 10 Map window In the Map window shown in Figure 10, click on the Enlarge button on the left side of the map to open a new window that displays the map with symbology controls. See Figure 11. Figure 11 Layer view Click the Add Layer tab to the left of the map, as shown in Figure 12. December 7, 2009 8 DRMInfo 1.0 User Manual Figure 12 Add layer To choose a layer, click Browse at the bottom of the Add Layer window, as shown in Figure 13. Figure 13 Choose Browse December 7, 2009 9 DRMInfo 1.0 User Manual Figure 14 Open layer In the Layer window shown in Figure 134, choose the folder you want to add in the map, and then click Open. (Note: Here inside maps folder, maps are categorized as Sources of Risk and Elements at Risk. Also, there are some pre-analyzed layers of maps for your reference. For overlaying maps over the main base map you should first be clear of which risk indicator you have selected through the indicator selection window and find out the corresponding map layers inside the folder, Sources of Risk and Elements at Risk. It is a good idea first to overlay Sources of Risk and then Elements at Risk respectively). Click Sources of Risk Folder and Click at Open command button to open it. You will get the following windows as shown in Fig 14 where you will choose the sources of risk layer. Fig 15 Map with Sources of Risk selection window. December 7, 2009 10 DRMInfo 1.0 User Manual Select the Source of Risk you require (For Example Flood_River_Flood_Areas) You will get the layer name in the map selection window Click OK The resulting map with the new layer overlaid is shown below in Figure 16. Figure 16 Map with new layer Overlaying Elements at Risk over Sources of Risk layers Now you can overlay the elements at risk layer. (Example: Number of houses at high flood risk). Now follow the procedure of adding layers again. Click Add Layer Icon again. You will get the same window as Figure 13. Click Browse again. You will get the same window as Figure 14. Choose folder Elements at Risk as Figure 17 and click Open December 7, 2009 11 DRMInfo 1.0 User Manual Figure 17 Window showing list of Elements at Risk. Click Inhabited_Houses Layer and click Open Figure 18. A map with combination of elements and sources of risk Now the map with the combination of sources of risk and element at risk is displayed where you can analyze the situation and find out which houses are at risk areas and which are not. Following the similar process you can easily overlay other elements and other different sources of risk to produce map of your interest. Producing Maps for Lower Administrative Levels If you are able to produce the respective layers for national level, you will also be able to produce the same layers for other administrative levels because DRMInfo has ability to handle administrative area based information and map features. You should understand the Area levels we have supplied in the December 7, 2009 12 DRMInfo 1.0 User Manual database such as 1, 2, 3, 4, 5, and 6 correspond to “Asia”, “Timor-Leste”, “Regions”, “Districts”, “Subdistricts” and “Sucos” respectively. You can simply overlay the desired Area level map for respective area and zoom into it to produce map. The detailed illustration is given below: Now, go back and follow the procedure to produce the map similar to Figure 16. Choose Level 4 from the Area Level selection window to produce information for district level areas. Click on Add Layer Icon again. The window as shown in Figure 19 Window appears. Figure 19. Map with Sources of Risk and District Level Boundary. Click Browse to add elements at Risk Navigate to the folder Elements at Risk Click at Inhabited_Houses_District_Lautem.shp layer file and click Open Click OK The resulting map as shown in Figure 20 appears December 7, 2009 13 DRMInfo 1.0 User Manual Figure 20 Map showing Sources of Risk and Elements at Risk for the Selected area. Click on Select to Highlight Icon above the map window. Click inside the boundary of Lautem District as shown in Figure 21 below. Figure 21 Map with Selected Area Highlighted December 7, 2009 14 DRMInfo 1.0 User Manual You will notice that the whole Lautem district is highlighted now. Click at Zoom to Highlight Icon Click at Remove Highlight Icon above the map window. over the map window to remove highlight. The resulting map as shown in Figure 22 appears Figure 22. Zoomed in Map for Lautem District with sources of risk and elements at risk layers overlaid December 7, 2009 15 DRMInfo 1.0 User Manual Printing Maps For a good quality map, other map elements such as North Compass, Scale Bar and Title of Map should be added in the map before printing. To add the above mentioned elements follow the procedures illustrated below: Click at Wizard option in the map window. Click at North Icon over map window to insert North Compass Click at Scale Icon over map window to insert Scale Bar. The resulting map as shown in Figure 23 will appear Figure 23 Map with scale bar and north compass. Now to add map title click Format and Click Edit Icon in the Format Tab December 7, 2009 16 DRMInfo 1.0 User Manual Screen as show in Figure 24 (Map Legend Adding window) will appear. Figure 24 Map Legend Adding window You can type the Title for the Map and click OK Click Next and window as displayed in Figure 25 will appear Figure 25 Window for Map preview. December 7, 2009 17 DRMInfo 1.0 User Manual Click Next The following window as shown in Figure 26 (Wizard Completion Window) will appear Figure 26 Wizard Completion Window Click at Finish Now Again Click to Enlarge Icon on Map window Click Page Setup option Click Orientation to Landscape Click Fit to Page Click at Save Print Click at Print Window as shown in Figure 27 will appear December 7, 2009 18 DRMInfo 1.0 User Manual Figure 27 map printing window Choose the Printer Name Click at Ok to print the map Displaying DRMInfo layers in Google Earth To Display the above map in Google Earth, if you have access to the internet, click the Add to Raster Image icon in the top toolbar of the Map Window. When Google Earth initializes it will display the map overlaid on the imagery, as shown in Figure 15. Figure 15 Google Earth with DRMInfo layers December 7, 2009 19