1
amount to a very simple domain theory. Domain theories are under-used in software engineering because the
eort required to develop a complete and consistent domain theory usually outweighs the gains. In our case,
we do not insist on a complete domain theory, but require only a theory expressing instantiations of global
variables that can easily be provided by a software engineer. In addition, our approach allows for revisions of
the domain theory based on conicts discovered during
statechart generation. This use of a domain theory is a
novel one, as traditionally domain theories are considered absolute.
The addition of semantic information also allows a justied merging of multiple scenarios. Dierent scenarios
will often contain identical or similar behaviors, and the
use of a domain theory allows us to merge these scenarios in a way such that the behavior intended by the user
is preserved.
Since scenarios only give a partial description of a system, we expect the use of this algorithm to be similar
to that of a code generator | i.e., the algorithm produces a skeleton design which the user then has to modify/complete. Since the user needs to modify the generated statecharts, they must be readable. This means
that the statecharts must include sensible use of hierarchy and orthogonality. We have devised a number of
ways of introducing hierarchy into the generated statecharts. We believe that the use of hierarchy is crucial
to the success of design generation tools.
Section 2 introduces the relevant parts of the UML along
with an example that will be referred to throughout the
paper. Section 3 shows how scenarios can be annotated
with semantic information and Section 4 presents an
algorithm that uses this semantic information to generate statechart designs. Section 5 discusses related approaches and we conclude in Section 6.
2 UML NOTATION AND EXAMPLE
Throughout this paper, we will use an ongoing example
to illustrate our techniques. The well-known ATM example (see e.g. [13]) is rather small, yet complex enough
to illustrate the main issues. The example describes typical scenarios for user interaction with an ATM machine
(e.g., inserting or removing a card, entering a password),
and interaction between the ATM, a consortium and the
bank for account validation.
Class Diagram
A class diagram is a notation for modeling the static
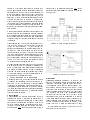
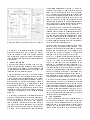
structure of a system. It describes the classes in a system and the relationships between them. Figure 1 shows
an example of a class diagram for our ATM example. In
an object-oriented fashion, the main class (here \ATM
toplevel") is broken down into sub-classes. The aggregation relation ( 3) shows when one class is part of
another one. The generalization relation ( ) shows
when one class is an instance of another. For further
details, see [17].
Figure 1: A Class Diagram for the ATM.
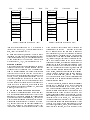
Figure 2: Example of a Statechart.
Statecharts
Statecharts, introduced originally by D. Harel [6], are
nite state machines extended with hierarchy and orthogonality (parallelism), allowing a complex system to
be expressed in a more compact and elegant way. Figure 2 shows a simple example of a statechart2. Nodes
can either be simple nodes, or composite nodes which
themselves contain other statecharts. The initial node
in a statechart is marked by . Transitions between
states have labels of the form e[c]=a. If event e occurs
and guard c holds, then the transition may be selected
to re which results in action a being taken and a state
change occurring. This behavior is extended in a natural way to handle composite nodes. In Figure 2, if the
system is in state B when the transition e[c]=a res,
All class-diagrams and statecharts in this paper have been
drawn using the Argo/UML tool [2].
2