1
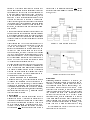
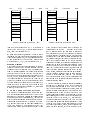
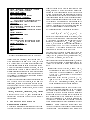
Generating Statechart Designs From Scenarios
Jon Whittle
Recom / NASA Ames Research
M/S 269-2
Moett Field, CA 94035 USA
+(650) 604-3589
[email protected]
ABSTRACT
This paper presents an algorithm for automatically generating UML statecharts from a collection of UML sequence diagrams. Computer support for this transition between requirements and design is important for
a successful application of UML's highly iterative, distributed software development process. There are three
main issues which must be addressed when generating
statecharts from sequence diagrams. Firstly, conicts
arising from the merging of independently developed sequence diagrams must be detected and resolved. Secondly, dierent sequence diagrams often contain identical or similar behaviors. For a true interleaving of the
sequence diagrams, these behaviors must be recognized
and merged. Finally, generated statecharts usually are
only an approximation of the system and thus must be
hand-modied and rened by designers. As such, the
generated artifact should be highly structured and readable. In terms of statecharts, this corresponds to the
introduction of hierarchy. Our algorithm successfully
tackles all three of these aspects and will be illustrated
in this paper with a well-known ATM example.
Keywords
UML, Scenarios, Automated Software Engineering
1 INTRODUCTION
The Unied Modeling Language (UML) [17] provides a
standardized collection of notations for describing artifacts in a software-intensive system. It supports modern
complex software development, whereby requirements
are expressed in one notation, e.g., sequence diagrams;
the design is then described in other notations, e.g.,
class diagrams and statecharts; nally code is produced
using the earlier notations as a guide. This approach
allows dierent stakeholders to develop models independently and encourages rapid prototyping.
Johann Schumann
Caelum / NASA Ames Research
M/S 269-2
Moett Field, CA 94035 USA
+(650) 604-0941
[email protected]
Each UML notation represents a particular aspect of a
software system from a particular viewpoint. However,
there exists a good deal of overlap between many notations. This overlap can be exploited, in the form of
automatic translations between notations, to reduce the
time spent in design and to help maintain consistency
between the models of dierent developers.
Currently, commercial tools such as iLogix's Rhapsody
[15] and Rational's Rose [14] do not adequately bridge
the gaps between UML notations. The generation of
C++ code is now commonplace, but the generation of
UML models themselves has not been adequately addressed. Some model translations can be trivially dened because the models represent the same information
in slightly dierent ways. One such example is converting between sequence diagrams and collaboration diagrams. However, other translations are inherently more
involved, such as translating between requirements and
actual system designs.
This paper presents an algorithm which supports the
design process by generating statechart designs automatically from scenarios. A scenario is a trace of an
individual execution of a (software) artifact [19]. Scenarios are widely used as a (pre-)requirements technique
since they describe concrete interactions and are therefore easier for customers and domain experts to use than
an abstract model. In what follows, scenarios will be
expressed as UML sequence diagrams and the design
model will consist of a class diagram and UML statecharts.
Since each scenario is usually written in isolation, bringing many scenarios together will result in inconsistencies
which have to be detected and resolved1. UML sequence
diagrams alone do not contain enough semantic information to enable the automatic detection of conicts, but
this information can be obtained by allowing the user to
express constraints on the diagrams. UML provides a
convenient notation for giving such constraints, the Object Constraint Language [17] (OCL), which is a sideeect free specication language. The OCL constraints
This is similar to the feature interactions problem of the
telecommunications industry [11].
1
amount to a very simple domain theory. Domain theories are under-used in software engineering because the
eort required to develop a complete and consistent domain theory usually outweighs the gains. In our case,
we do not insist on a complete domain theory, but require only a theory expressing instantiations of global
variables that can easily be provided by a software engineer. In addition, our approach allows for revisions of
the domain theory based on conicts discovered during
statechart generation. This use of a domain theory is a
novel one, as traditionally domain theories are considered absolute.
The addition of semantic information also allows a justied merging of multiple scenarios. Dierent scenarios
will often contain identical or similar behaviors, and the
use of a domain theory allows us to merge these scenarios in a way such that the behavior intended by the user
is preserved.
Since scenarios only give a partial description of a system, we expect the use of this algorithm to be similar
to that of a code generator | i.e., the algorithm produces a skeleton design which the user then has to modify/complete. Since the user needs to modify the generated statecharts, they must be readable. This means
that the statecharts must include sensible use of hierarchy and orthogonality. We have devised a number of
ways of introducing hierarchy into the generated statecharts. We believe that the use of hierarchy is crucial
to the success of design generation tools.
Section 2 introduces the relevant parts of the UML along
with an example that will be referred to throughout the
paper. Section 3 shows how scenarios can be annotated
with semantic information and Section 4 presents an
algorithm that uses this semantic information to generate statechart designs. Section 5 discusses related approaches and we conclude in Section 6.
2 UML NOTATION AND EXAMPLE
Throughout this paper, we will use an ongoing example
to illustrate our techniques. The well-known ATM example (see e.g. [13]) is rather small, yet complex enough
to illustrate the main issues. The example describes typical scenarios for user interaction with an ATM machine
(e.g., inserting or removing a card, entering a password),
and interaction between the ATM, a consortium and the
bank for account validation.
Class Diagram
A class diagram is a notation for modeling the static
structure of a system. It describes the classes in a system and the relationships between them. Figure 1 shows
an example of a class diagram for our ATM example. In
an object-oriented fashion, the main class (here \ATM
toplevel") is broken down into sub-classes. The aggregation relation ( 3) shows when one class is part of
another one. The generalization relation ( ) shows
when one class is an instance of another. For further
details, see [17].
Figure 1: A Class Diagram for the ATM.
Figure 2: Example of a Statechart.
Statecharts
Statecharts, introduced originally by D. Harel [6], are
nite state machines extended with hierarchy and orthogonality (parallelism), allowing a complex system to
be expressed in a more compact and elegant way. Figure 2 shows a simple example of a statechart2. Nodes
can either be simple nodes, or composite nodes which
themselves contain other statecharts. The initial node
in a statechart is marked by . Transitions between
states have labels of the form e[c]=a. If event e occurs
and guard c holds, then the transition may be selected
to re which results in action a being taken and a state
change occurring. This behavior is extended in a natural way to handle composite nodes. In Figure 2, if the
system is in state B when the transition e[c]=a res,
All class-diagrams and statecharts in this paper have been
drawn using the Argo/UML tool [2].
2
User
Consortium
ATM
Bank
Display main screen
Insert card
ATM
Consortium
Bank
Display main screen
Insert card
Request password
Request password
Enter password
Enter password
Verify account
Bad account message
User
Bad account
Verify account
Verify card with bank
Bad bank account
Request password
Print receipt
Cancel
Eject card
Canceled message
Request take card
Eject card
Take card
Take card
Display main screen
Display main screen
Figure 3: Interaction with an ATM (SD1).
then the system changes state to A1. If the system is
in any of the states A1; A2; A3 when transition f [d]=b
res, then it will change state to C .
By using composite nodes, hierarchy (or depth) can be
introduced. This not only decreases the number of individual nodes substantially, but also enhances readability and maintainability of a statechart. For details on
statecharts see e.g., [6, 17], for their semantics cf. [7].
Sequence Diagrams
The basis for our approach are scenarios which describe
concrete examples of the system's intended behavior.
Scenarios can be expressed in UML as sequence diagrams. A sequence diagram (SD) shows the interaction
between objects of a system over time. The SD in Figure 3 is an example for interactions between the objects
\User", \ATM", \Consortium" and \Bank". The vertical lines represent the life-line (or time-line) for the
given object, dening the object's life during the interaction. Messages (like \Insert card") are exchanged between the objects. In this paper, we will focus on basic
SDs; for further details and extensions (e.g., conditional
messages, or iteration) cf. [17].
3 ADDING SEMANTIC INFORMATION
The simplicity of sequence diagrams makes them suitable for expressing requirements as they can be easily
understood by customers, requirements engineers and
software developers alike. Unfortunately, the lack of semantic content in sequence diagrams makes them ambiguous and therefore dicult to interpret. For example, suppose there exists an additional sequence diagram, SD0, identical to SD1 in Figure 3 except that
there are two \Insert card" messages adjacent to each
Bad password
Verify card with bank
Bad bank password
Figure 4: Interaction with an ATM (SD2).
other. There are three possible ways to interpret the
conjunction of the two SDs | either one or two cards
may be inserted; exactly one card must be inserted so
SD0 is incorrect; or, exactly two cards must be inserted
so SD1 is incorrect. In current practice, ambiguities are
often resolved by examining the informal documentation
but, in some cases, ambiguities may go undetected leading to costly software errors. In the case of computer
generation of designs, the documentation is usually too
informal for the automatic resolution of conicts. There
are two extreme ways to overcome this problem. First,
insist that the user provides a complete, formal domain
theory providing semantic information about the messages. Second, assume no additional semantic information but interpret scenarios based on some heuristic.
Neither of these is sucient, however. The provision
of a complete domain theory is overly burdensome and
an algorithm with no semantic information ultimately
produces incorrect results.
We make a compromise, whereby messages in a sequence
diagram may be annotated with a pre/post-condition
style specication expressed in OCL. Note that this is
only a small additional burden on the user, since the
amount of information required by our algorithm for a
successful merging of SDs is actually very small. The
specications should include the declaration of global
state variables, where a state variable represents some
important aspect of the system, e.g., whether or not
the user has inserted his card into the ATM. Pre- and
post-conditions should then include references to these
variables. Note that not every message needs to be given
a specication, although, clearly, the more semantic information that is supplied, the better the quality of the
cardIn, cardHalfway, passwdGiven : Boolean
card : Card, passwd : Sequence
Insert card(c : Card)
pre : cardIn = false
post: cardIn = true and card = c
Enter password(p : Sequence)
pre : passwdGiven = false
and p->forAll(p->includes(d)=>digit(d))
post: passwdGiven = true and passwd = p
Take card()
pre : cardHalfway = true
post: cardHalfway = false and cardIn = false
Display main screen()
pre : cardIn = false and cardHalfway = false
post:
Request password()
pre : passwdGiven = false
post:
Eject card()
pre : cardIn = true
post: cardIn = false and cardHalfway = true
and card = null and passwd = null
Request take card()
pre : cardHalfway = true
post:
Canceled message()
pre : cardIn = true
post:
Figure 5: Domain Knowledge for the ATM class.
conict detection. Currently, our algorithm only exploits constraints of the form var = value, but there
may be something to be gained from reasoning about
other constraints using an automated theorem prover.
As well as being used for conict detection, the OCL
constraints can be used to identify identical states in
dierent sequence diagrams which allow these diagrams
to be merged. The constraints also allow an automatic
partitioning of the generated statecharts into hierarchical super-nodes (cf. Section 4).
Figure 5 gives specications for selected messages in our
ATM example. The state variables, in the form of a
state vector, are used to characterize states in the generated statechart. The state vector is a vector of values
of the state variables. In our example, the state vector
has the form:
< cardIn^, cardHalfway^, passwdGiven^, card^, passwd^>
where var^ 2 Dom(var) [ f?g, and ? represents an unknown value. The notion of state vector is crucial to
our algorithm.
4 GENERATING STATECHARTS
Single Sequence Diagrams
We shall rst consider how individual SDs can be converted into statecharts. This process starts by detecting
conicts between the SD and the domain theory (and
hence, other SDs). Note that there are two kinds of constraints on a SD: constraints on the state vector given
by an OCL specication, and constraints on the ordering of messages given by the SD itself. Conicts between
these constraints mean that either the scenario does not
follow the user's intended semantics or the domain theory is incorrect. The decision as to which holds must be
taken by the user and appropriate modications must
be made. This enables both the domain theory and the
SDs to be rened during statechart generation.
Let a sequence diagram be represented as follows:
mr s 0
m2 : : : m?!
m1 s0 ; s ?!
r?1 0
sr?1 ; sr ?!
s0 ?!
r
0 1
(1)
where the mi are messages between objects and si , s0i are
the state vectors immediately before and after message
mi is executed. The source and destination objects of
message mi are denoted by msource
and mdest
i
i , respectively. Si will be used as a notational convenience to
denote either si or s0i . Si [j ] is the j th element of the
the vector Si . vj will denote the name of the variable
associated with position j in the state vector.
The initial state vectors are obtained directly from the
message specications: if mi has a precondition vj = y,
then let si [j ] := y, and if mi has a postcondition vj = y,
let s0i [j ] := y. Otherwise, si [j ] = s0i [j ] := ?.
Since each message is specied independently, the initial
state vectors will contain a lot of unknown values. Most
(but not all) of these can be given a value in one of two
ways.
Unication: two state vectors, Si and Sj (i 6= j ),
are considered the same if they are uniable, i.e.,
there exists a variable assignment such that
(Si ) = (Sj ). This amounts to the detection of
loops within a SD.
The frame axiom: for each j , if si [j ] = ?, i > 0,
then let si [j ] := s0i?1 [j ] and if s0i [j ] = ? then let
s0i [j ] := si [j ]. This assumes, of course, that there
are no hidden side-eects between messages.
These two techniques extend the state vectors by propagating variable values throughout the SD. This allows
us to detect conicts between state vectors | a conict
is detected if the state vector immediately following a
message and the state vector immediately preceding the
next message dier (if they are uniable they will already have been unied). Any reported conicts must
be resolved by the user and the algorithm is started
again. Figure 6 shows how these techniques t together.
Example. Figure 7 shows SD1 from Figure 3 after
the state vectors have been extended by unication and
the frame axiom. Our procedure detects a conict with
Input. A SD annotated with state vectors
Output. A SD with extended annotations
for each state vector Si do
if there is some j and some unier with (Si ) = (Sj ) then
unify Si and Sj ;
propagate instantiations with frame axiom;
if there is some k; l with s0k (l) 6= sk+1 (l) then
Report Conict;
break;
done
Figure 6: Extending the state vector annotations.
the domain theory. This arises because state vectors
SV1 and SV2 are unied (the gure shows the instantiations of the vectors after unication). This corresponds to the fact that the ATM returns to its initial
state after \Take card" is executed. The state vectors
tell us that there is a potential loop at this point, which
will be created when the SD is translated into a statechart (see Figure 8). The eect of this loop is that
there exists an execution path such that the variable
passwdGiven is set to true when \Request password"
is encountered (the value of passwdGiven is the third element in the vector). However, the domain theory tells
us that passwdGiven must be false as a pre-condition
of \Request password". Hence, there is a conict, which
represents the fact that the developer did not account
for the loop possibility when designing the domain theory. The user must now decide on a resolution of this
conict | either he can tell the system that the loop is
not possible, in which case the unier that detected the
loop is discarded; or he modies the sequence diagram;
or he modies the domain theory. The action taken in
this case is that the domain theory is updated by giving
\Eject card" the additional postcondition passwdGiven
= false. This extra postcondition resets the value of
the variable when the ATM user removes his card.
Translation into Finite State Machines
Once conicts have been resolved, we are ready to generate a statechart. Our strategy is to generate a number
of at statecharts (in fact, nite state machines (FSMs))
for each individual SD, one for each object in the SD.
Each FSM describes the behavior of the class to which
the corresponding object belongs. Messages directed towards a particular object, O, are considered events in
the FSM for O. Messages directed away from O are
considered actions. A loop is detected if the state vector immediately after the current message has been executed is the same as an existing state vector and if
this message is state-changing, i.e., si 6= s0i . Note that
User
SV1
ATM
Consortium
Display main screen <f,f,t,null,null>
<f,f,t,null,null>
Insert card
<f,f,t,null,null>
<t,f,t,c,null>
Request password <t,f,f,c,null>
<t,f,f,c,null>
Enter password <t,f,t,c,p>
<t,f,f,c,null>
Verify account
Bank
conflict
<t,f,t,c,p>
Verify card with bank
<t,f,t,c,p>
<t,f,t,c,p>
<t,f,t,c,p>
Bad bank account
Bad account message
Bad account
<t,f,t,c,p>
Print receipt
<t,f,t,c,p>
<t,f,t,c,p>
<f,t,t,null,null> Eject card
<t,f,t,c,p>
<f,t,t,null,null> Request take card <f,t,t,null,null>
<f,t,t,null,null> Take card
<f,f,t,null,null>
<t,f,t,c,p>
<t,f,t,c,p>
SV2
<f,f,t,null,null>
<f,f,t,null,null>
Display main screen
Figure 7: Figure 3 with Extended Annotations.
some messages may not have been given a specication,
hence they will not aect the state vector. To identify states based solely on the state vector will result in
incorrect loop detection (e.g., a message with no specication will always loop back to its starting state). To
overcome this, loops are only created when the message
changes the state.
Figure 8 shows how a single SD is translated into a FSM
for each object. A FSM, as generated by Figure 8, is
a 6-tuple (N; s0 ; V; ; L; ) where N is the set of nodes,
s0 2 N is the initial node, V is the set of state vectors,
: N ! V is a labelling of the nodes with state vectors,
L is the set of transition labels and N L N is the
transition relation. Transition labels are either events,
denoted hev; mi, or actions, denoted hac; mi, where m
is a sequence of messages. Note that we create a transition for each event and each action. This produces an
overly large number of states but makes analysis easier. For presentation to the user, actions and events can
be amalgamated into the same transition in the usual
statechart style. Our implementation also deals with
conditional branches expressed in the sequence diagram
which introduce transition guards into the FSM, but we
omit these here for the sake of clarity3 . The detection of
loops is done in the second if statement in the denition
of add.
Multiple Sequence Diagrams
The previous section dealt with a single sequence diagram. The key ideas were how to identify if a SD conicts with the domain theory and how to detect loops.
When merging multiple sequence diagrams, one way
would be to convert each SD to FSMs and then take
the union of those FSMs. This is essentially the ap3 The semantics of conditional messages in UML SDs is unclear.
We follow that presented in [4] where keywords IF, ENDIF, CASE,
ENDCASE are used to partition a SD into conditional branches.
Input. A sequence diagram, S , containing objects
O1 ; : : : ; Ok and messages m1 ; : : : ; mr (as in (1)).
Output. A FSM COi for each object, 1 i k.
for i = 1; : : : ; k do
Create a new FSM, COi , with a single node, n0;i
(the initial node) and current node in COi := n0;i ;
done
for i = 1; : : : ; r do
add(mi ; ac; msource
);
i
add(mi ; ev; mdest
);
i
done
where add(mess, type, obj )
curr := current node in Cobj ;
if there is a n 2 NC with hcurr; l; ni 2 and l = htype; messi and s0i = (n) then
current node in Cobj := n;
return
if there is a n 2 NC with s0i = (n)
and mi is state-changing then
add new transition hcurr; htype; messi; ni;
current node in Cobj := n;
return
add a new node n and let (n) := s0i ;
add a transition hcurr; htype; messi; ni;
current node in Cobj := n;
return
obj
obj
messages:
Denition 1 Two nodes, n1 and n2 in a FSM, are similar if they have the same state vector, (n1 ) = (n2 ),
and they have at least one incoming transition with the
same label, i.e., there exist transitions t1 = hn3 ; l; n1 i
and t2 = hn4 ; l; n2i for some nodes n3 ; n4 .
The existence of a common incoming transition means
that in both cases, an event has occurred which leaves
the state variables in an identical assignment. Hence,
the denition takes into account the ordering of the messages and the current state.
We illustrate how -transitions are introduced when considering the FSMs generated for an object, O. Suppose
we start with sequence diagrams which are translated
into FSMs C1 ; : : : ; Ck , then we create a new FSM, C ,
which includes C1 ; : : : ; Ck and has -transitions as follows:
Figure 8: Translating a sequence diagram into FSMs.
1. Let C be the union of C1 ; : : : ; Ck , i.e., NC = [i NCi ,
C = [i Ci etc.
2. Let C have a new initial node n0 and create transitions from n0 to each of the initial nodes of
C1 ; : : : ; C k .
3. For each pair of similar nodes, n1 and n2 in NC ,
create -transitions from n1 to n2 and from n2 to
n1 .
proach taken in [18]. Recall, however, that one of our
main aims is to generate readable statecharts which can
then be further modied by the user. Merely taking the
union of the FSMs would result in a chart with many
independent branches, one for each SD. Our approach
makes an analysis of which nodes in dierent FSMs can
be identied so that dierent branches can be merged.
The result is a statechart with fewer nodes corresponding more closely to the statechart that a designer might
produce manually from the SDs.
The idea is that we recognize similar nodes from different FSMs and join them with empty -transitions.
A standard algorithm from [1] can then be used to remove these -transitions and simultaneously merge similar nodes. A key question then is how to recognize
similar nodes. The obvious solution is to dene similarity such that two nodes are similar if their state vectors
are the same. However, such a denition would produce
an excessive number of similar nodes since some messages do not change the state vector. The way around
this when merging multiple SDs is to base the notion of
similarity on both the state vectors and the ordering of
The algorithm that we use subsequently is a variant of a
standard algorithm for transforming a non-deterministic
nite automaton (NFA) into a deterministic nite automaton (DFA) [1]. Each state in the DFA is a set
of NFA states which simulates \in parallel" all possible moves the NFA can make on a given input string.
In order to leverage o this algorithm, we introduce transitions as above. These -transitions are removed by
the algorithm resulting in a FSM that has successfully
interleaved a number of SDs by placing similar nodes
into a single state in the output.
Note that the output of the algorithm is only deterministic in the sense that there are no -transitions remaining. It still may be the case, however, that there are
two transitions leaving a state labelled with the same
events but dierent actions. Hence, our algorithm may
produce non-deterministic statecharts. Note that this is
a good thing, as a designer may wish to leave a design
non-deterministic initially and rene it later.
Example. Figure 11 gives the statechart generated automatically from the SDs in Figures 3, 4, 9 and 10. Our
algorithm, implemented in Java, has actually been applied to the full ATM example, which consists of eleven
User
ATM
Consortium
Bank
Display main screen
Insert card
User
ATM
Consortium
Bank
Display main screen
Insert card
Request password
Request password
Cancel
Enter password
Verify account
Canceled message
Cancel
Eject card
Canceled message
Request take card
Eject card
Take card
Request take card
Display main screen
Take card
Display main screen
Figure 9: Interaction with an ATM (SD3).
Figure 10: Interaction with an ATM (SD4).
Figure 11: Statechart generated from SD1, SD2, SD3 and SD4.
SDs. Two conicts were found and a loop was detected
which was not intended, but which was allowed by the
SDs and domain theory. In this way, the algorithm carries out some degree of validation of the input SDs.
Introducing Hierarchy
So far, we have shown how to generate FSMs without
any hierarchy. In practice, however, statechart designs
tend to get very large and so the judicious use of hierarchy and orthogonality is crucial to readability and maintainability of the designs. In what follows, we consider
how hierarchy can be introduced automatically into the
FSMs generated by our algorithm.
There are several issues which comprise a \welldesigned" statechart (see, for example, [9]). They include the consolidation of related behavior, the separation of unrelated behavior, and the introduction of
meaningful abstractions. We consider three approaches
for introducing hierarchy into the generated FSMs: using implicit information present in the state vectors, introducing generalizations, and using information explicitly given by the user in class diagrams.
Using the State Vector
The set of state variables in our annotated SDs provides an excellent means for introducing structure into
the generated statechart. State variables usually encode
that the system is in a specic mode or state (e.g., if the
card is inserted or not). Thus it is natural to partition
the statechart into subcharts containing all nodes belonging to a specic mode of the system.
More specically, we recursively partition the set of
nodes according to the dierent values of the variables in
the state vectors. In general, however, there are many
dierent ways of partitioning a statechart, not all of
them suited for good readability. Thus, we introduce
additional heuristic constraints on the layout of the stat-
echart. These constraints rule out unreadable partitions
and are controlled by user-given parameters:
1. the maximum depth of hierarchy (too many nested
levels of compound states limit readability);
2. the maximum number of states on a single level;
3. the maximum percentage of inter-level transitions
(transitions between dierent levels of the hierarchy
limit modularity, but can occasionally be useful);
4. a partial ordering, , over the state variables, describing an order in which partitions should be attempted (some state variables may be more \important" than others and thus should be given priority). The ordering encapsulates important design
decisions about the way in which the statechart
should be split up.
The process of structuring a given subset S of the nodes
of a generated FSM is shown in Figure 12. Given the
set of variables W of the state vector and the ordering
, a sequence W 0 is constructed w.r.t. . Then the
nodes S are partitioned. In case the partition does not
meet the design criteria ((1){(3) above), a warning will
be issued that the given ordering would result in a nonoptimal hierarchy and a new ordering of the variables
is selected. This selection is done until the criteria are
met.
The actual splitting is performed recursively according
to the variable sequence W 0 . Let vj be the top-level variable (minimal in W 0 ) on which to split. The partition is
made up of m equivalence classes corresponding to each
possible value of vj given in the SDs. For example, for
the boolean variable cardIn we would collect all nodes
where this variable is true or false, respectively. Then
these compound states will be partitioned according to
the remaining variables.
Generalizations
Since SDs often represent concrete instances of a more
general behavior, it is useful to be able to introduce generalizations into the generated statechart. We present
one example of this here. The input SDs show that the
event \Cancel" can occur in one of two states (see Figure
11). \Cancel" can be generalized, however, such that
it can occur in any state in which cardIn is true and
cardHalfway is false. This suggests the introduction of
hierarchy by partitioning the statechart over the values
of cardIn and cardHalfway, using the ordering cardIn
cardHalfway. At present, such generalizations are
given explicitly by the user, in the form of expressing
an ordering or invoking a transformation, but it may
be possible to suggest generalizations automatically, for
example, by using machine learning techniques.
Input. A FSM, (N; s0 ; V; ; L; ), S N , an ordering
over the state vector variables, W
Output. A partitioning P of the FSM
W 0 := hv1 ; :::; vk i for vi 2 W and vi vj ; i < j ;
P := partition(S; W 0 );
while :optimal(P ) do
W 0 := select-variable-ordering(W );
P := partition(S; W 0 );
done
where partition(S; W 0 )
vj := rst(WS0 ); // split on rst var. in W 0
DS (vj ) := f(s)[j ]g;
s2S
m := jDS (vj )j;
for 1 i m do
Si := fs 2 S j (s)[j ] = ith(DS (vj ))g;
Pi := partition(Si ; rest(W 0 ));
done
P := hPi jPi =
6 hi i
where optimal(P )
check P according to our design criteria
Figure 12: Sketch of algorithm for partitioning over the
state vector.
Example. Figure 13 shows the FSM from Figure 11
which has been partitioned according to the ordering
cardIn cardHalfway, and in which the \Cancel"
message has been generalized (explicitly by the user) as
in the previous paragraph to produce the same behavior
for the source state of `Request password' as for the
other two states in which it is applicable.
Using Class Diagrams
It is important to incorporate other design decisions
made by the developer into the synthesis process.
Within the UML framework, a natural place for higherlevel design decisions are class diagrams. These describe
the types of the objects in the system and the static relationships among them.
A hierarchical structure of a generated statechart can
easily be obtained from the class diagram: the outermost superstate (surmounting the entire statechart) corresponds to the class node of the corresponding object.
Aggregation results in a grouping of nodes, e.g., in Figure 1, the ATM statechart will have subcharts physical
device and dialogs. If a class contains several subclasses (e.g., card-reader and cash-dispenser are
sub-classes of physical-device in Figure 1), the statecharts corresponding to the sub-classes are sub-nodes of
the current node. Due to space restrictions, we do not
show the resulting statechart when Figure 1 is structured according to the class diagram.
Figure 13: Structured statechart for the ATM example.
The nal way of introducing structure is somewhat
higher-level than the rst two. Typically, the class diagram can be used to obtain a very abstract structure
and the rst two methods can be used to introduce further structure within each subchart generated using the
class diagrams.
5 RELATED WORK
There have been a number of recent attempts at generating specications from scenarios. Our work stresses
the importance of obtaining a specication which can
be read, understood and modied by a designer. This
is reected in the following main ways.
Many approaches make no attempt to interleave dierent scenarios. [18] gives a learning algorithm for generating a temporal logic specication from a set of examples/counterexamples expressed as scenarios. Each scenario gives rise to a temporal
S logic formula Gi and scenario integration is merely i Gi augmented with rules
for identifying longest common prexes. In terms of
generating FSMs, this corresponds to having separate
branches in the FSM, one for each scenario. However,
this does not correspond well to what a human designer
would do.
A more eective integration of scenarios necessitates
some way of identifying identical states in dierent scenarios. The solution to this in [10] is to ask the user
to explicitly name each state in the FSM generated
from a scenario. Dierent states are then merged if
they have been given the same name. This approach
requires a good deal of eort from the user, however.
The SCED tool [13] generates FSMs from traces using
the Biermann-Krishnaswamy algorithm [3]. This algorithm uses backtracking to identify identical states in
such a way that the nal output FSM will be deterministic. As a result, there is no use of semantic information
about the states and the algorithm ultimately may produce incorrect results by identifying two states that are
in fact not the same. In addition, designers will often
introduce non-determinism into their designs which will
only be resolved at a later implementation stage. Hence,
the insistence on determinism is overly restrictive.
[12] tackles the problem of integration by requiring that
the user gives an explicit diagram (a high-level Message
Sequence Chart) showing the transitions from one scenario to the next. This merely shows, however, how the
start and end points of dierent scenarios relate. There
is no way to examine the contents of scenarios to, for example, detect interleavings or loops. [5] follows a similar
approach, essentially using an AND/OR tree instead of
a high-level Message Sequence Chart.
The work closest to our own is described in [16] where
timed automata are generated from scenarios. The
user must provide message specications with ADD and
DELETE lists which maintain a set of currently valid
predicates in a STRIPS-like fashion. States are then
identied if the set of valid predicates is the same.
The ability to introduce structure and hierarchy into
the generated FSM is crucial if user modications must
be made. [10] allows the limited introduction of hierarchy if the structure is explicitly represented in the
scenarios (e.g., concurrent threads expressed in a collaboration diagram lead to a statechart node with two
orthogonal subnodes). However, structure beyond that
present in the scenarios must be introduced manually.
Our work extends this approach by introducing hierarchy where the structure is deduced from other UML
notations, such as a class diagram, or from a domain
theory, where partitioning is made over a state variable.
Most other approaches assume the correctness of the
input scenarios. In practice, the scenarios will contain
ambiguities and inconsistencies. Our algorithm detects
conicts which may correspond to such ambiguities and
hence can be used as a guide for rening the scenarios.
To further extend our consistency checks, we may be
able to leverage o work done in checking the consistency of SCR requirements specications [8], or work in
the feature interactions community [11].
6 CONCLUSIONS
We have presented an algorithm for generating UML
statecharts from scenarios. These scenarios comprise
parts of the system requirements and are given as sequence diagrams. By adding semantic information in
the form of a domain theory we are able to correctly
identify similar states and to detect and report incon-
sistencies. By identifying similar states, our approach
allows the merging of a number of sequence diagrams
into a single statechart. In order to make such an algorithm practical, the generated statecharts must be
readable. To enable this, we introduce structure and
hierarchy into the generated statechart. Information
and guidance for structuring are taken from the domain
theory, a UML class diagram and additional preferences
the user may select. A prototype of this algorithm has
been implemented in Java.
The development of high-quality software requires a rigorous enforcement of formal techniques during the entire
lifecycle. UML covers a wide spectrum of diagrams and
notations on various levels of software development and
encourages an iterative life-cycle. For high productivity,
a transition between the dierent levels has to be made
eectively and fast. However, current CASE tools only
support translations from specication to code (e.g.,
generation of C++ code from class diagrams or statecharts). Our approach can be used to close the gap
between the requirements and specication phase.
Since most requirements do not specify the full behavior of the system, the generated SCs are only a skeleton which serve as a basis for manual renement and
modication. Therefore, our algorithm fully supports
iterative model development. Careful software design
requires that the specication and requirements are always kept in a consistent state. Manually maintaining
consistency is a tedious and error-prone task. Our algorithm provides the rst step towards an automated tool
for carrying out such a task. Future plans will augment
our algorithms so that changes made to the generated
statechart can be fed back to the sequence diagrams. In
this way, design modications can be validated on-they by highlighting scenarios that are no longer valid, or
suggesting new scenarios that become possible.
REFERENCES
[1] A. Aho, R. Sethi, and J. Ullman. Compilers: Principles, Techniques, and Tools. Addison-Wesley,
1986.
[2] Argo/UML. University of California, Irvine, 1999.
http://www.ics.uci.edu/pub/arch/uml/index.html.
[3] A. Biermann and R. Krishnaswamy. Constructing programs from example computations.
IEEE Transactions on Software Engineering, SE2(3):141{153, 1976.
[4] T. Gehrke and T. Firley. Generative sequence
diagrams with textual annotations. In Formale Beschreibungstechniken fur verteilte Systeme
(FBT99), pages 65{72, 1999.
[5] M. Glinz. An integrated formal model of scenarios
based on statecharts. In 5th European Software Engineering Conference (ESEC), pages 254{271, Sitges, Spain, 1995.
[6] D. Harel. Statecharts: A visual formalism for complex systems. Science of Computer Programming,
8:231{274, 1987.
[7] D. Harel, A. Pnueli, J. Schmidt, and R. Sherman.
On the formal semantics of statecharts. In Proc.
2nd LICS, pages 54{64. Springer, 1987.
[8] C. Heitmeyer, R. Jeords, and B. Labaw. Automated consistency checking of requirements specications. ACM Transactions on Software Engineering and Methodology, 5(3):231{261, 1996.
[9] I. Horrocks. Constructing the User Interface with
Statecharts. Addison-Wesley, 1999.
[10] I. Khriss, M. Elkoutbi, and R. Keller. Automating the synthesis of UML statechart diagrams from
multiple collaboration diagrams. In UML98: Beyond the Notation, pages 132{147. Springer, 1999.
[11] K. Kimbler. Feature Interactions in Telecommunications and Software Systems V. IOS Press, 1998.
[12] S. Leue, L. Mehrmann, and M. Rezai. Synthesizing software architecture descriptions from Message Sequence Chart specications. In Automated
Software Engineering, pages 192{195, Honolulu,
Hawaii, 1998.
[13] T. Mannisto, T. Systa, and J. Tuomi. SCED report and user manual. Report A-1994-5, Dept of
Computer Science, University of Tampere, 1994.
[14] Rational Rose. Rational Software Corporation, Cupertino, CA, 1999.
[15] Rhapsody. I-Logix Inc., Andover, MA, 1999.
[16] S. Some and R. Dssouli. From scenarios to timed
automata: building specications from users requirements. In Asia Pacic Software Engineering
Conference, pages 48{57, 1995.
[17] Unied Modeling Language Specication, Version
1.3, 1999. Available from Rational Software Corporation, Cupertino, CA.
[18] A. van Lamsweerde. Inferring declarative requirements specications from operational scenarios. IEEE Transactions on Software Engineering,
24(12):1089{1114, 1998.
[19] K. Weidenhaupt, K. Pohl, M. Jarke, and
P. Haumer. Scenarios in system development: Current practice. IEEE Software, pages 34{45, 1998.


![User Manual [UK]](http://vs1.manualzilla.com/store/data/005698634_1-91739311a55a3b64211d9cd4e7c53c37-150x150.png)